By ForexTime
- Precious metals & commodities in focus ahead of Fed
- Gold waits for fresh fundamental spark
- Silver trapped within range
- Brent slips from 10-month high
- Natural Gas tests 200-day SMA
Global equities were mixed on Wednesday as investors braced for the outcome of the Federal Reserve rate decision.
There was some optimism in the air despite the overall caution after UK inflation data eased more than expected in August. This offered some support to European markets while weakening the pound as investors raised bets around the BoE nearing the end of its hiking cycle. The dollar has entered standby mode, oil is under pressure, and gold seems to be waiting for a fresh directional catalyst.
The Fed interest rate decision this evening could trigger explosive levels of volatility, resulting in fresh opportunities across the board. Our focus today falls on precious metals and commodities with the tool of choice technical analysis.
Gold waits on Fed decision
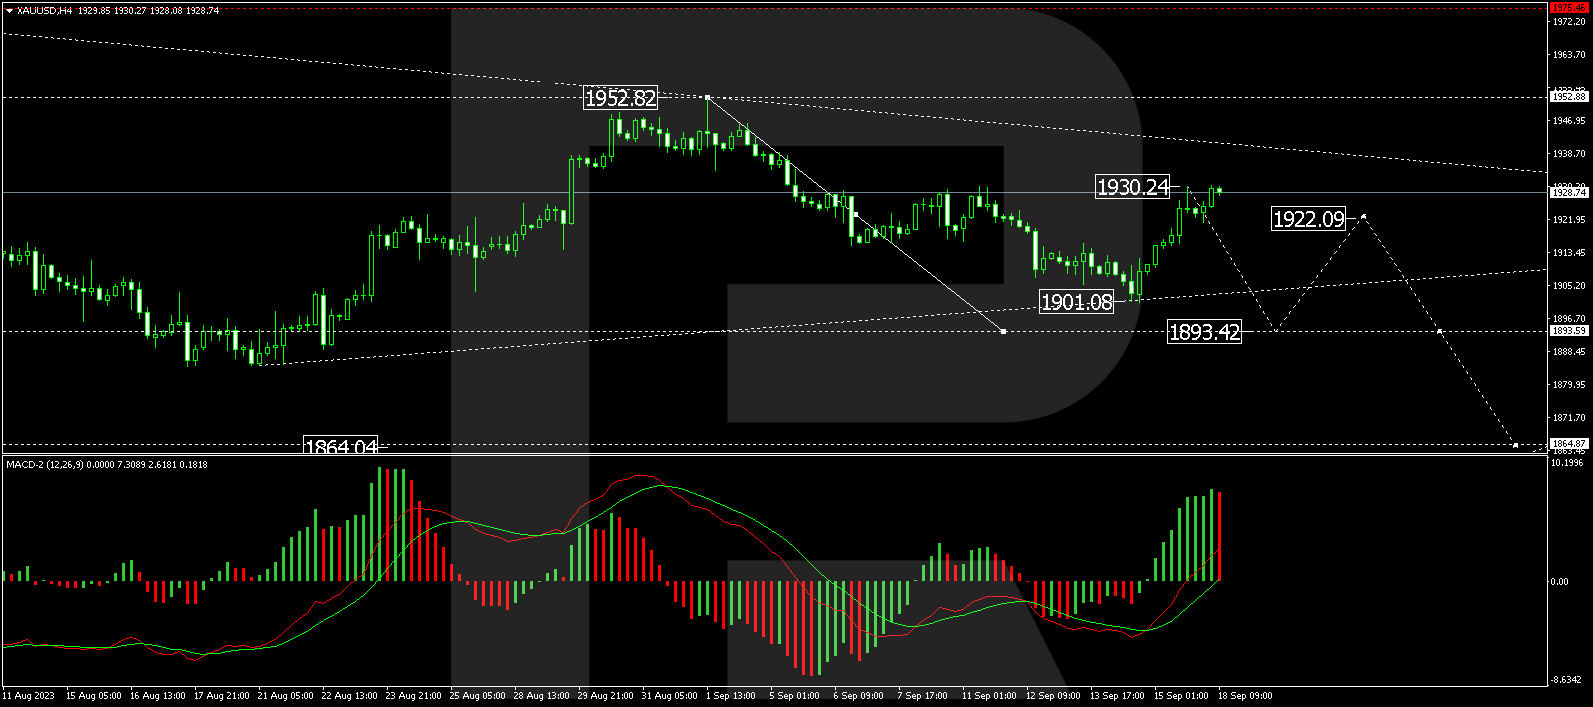
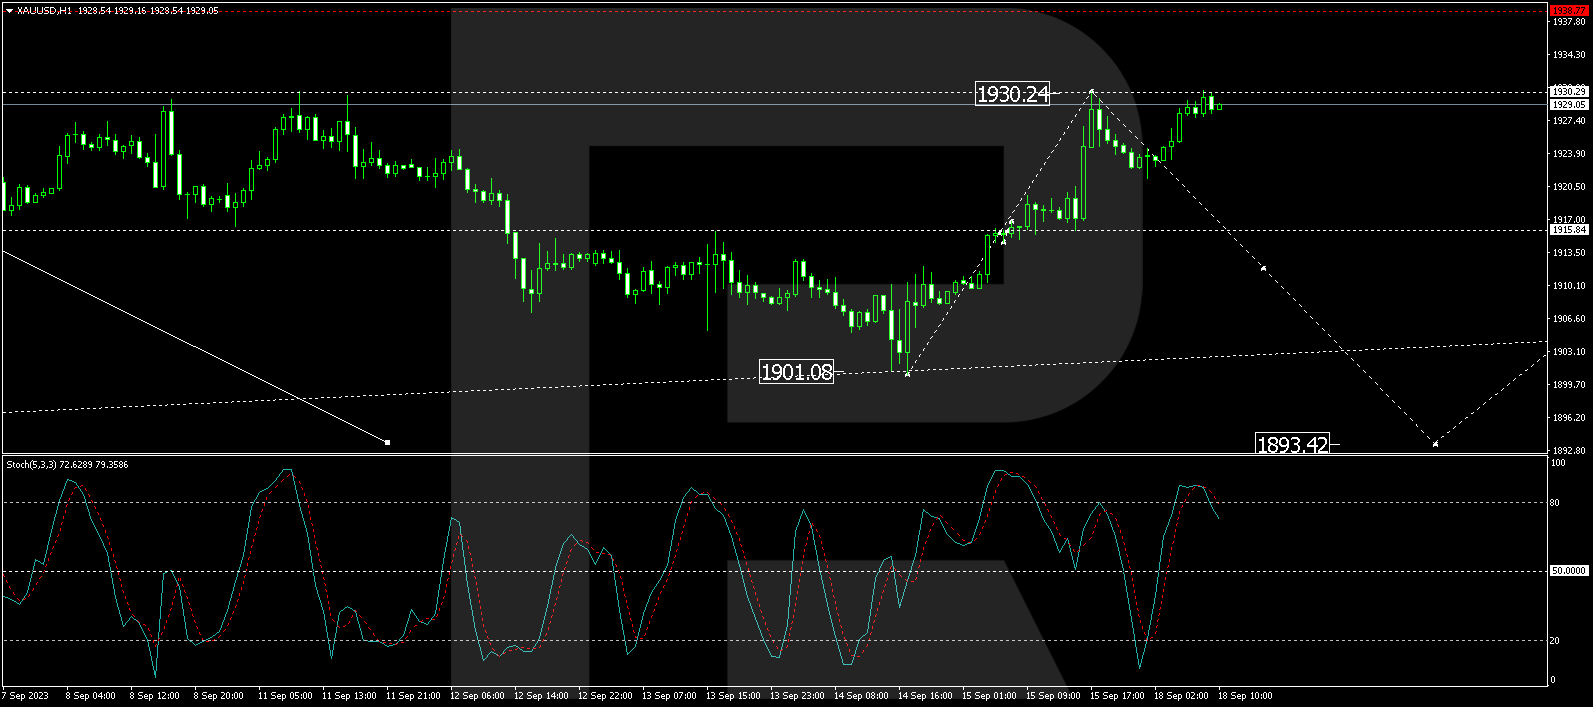
Gold is likely to trade within a tight range until the Fed’s decision this evening.
While the central bank is widely expected to leave rates unchanged, much focus will be on the economic projections, dot plots, and messaging for clues on future hikes. Gold is back within a choppy range on the daily charts with prices recently pushing above the 200-day and 50-day SMA. A breakout may be on the horizon with the Fed decision acting as the directional spark.
- A strong breakout above $1937 may open a path toward $1953.
- Should prices slip below the 200-day SMA at $1924, this could see a decline towards $1906 and $1900, respectively.

Silver trapped within range
Silver prices have been trapped within a range on the daily timeframe since early May 2023.
The metal continues to be influenced by the dollar, Fed hike expectations, and the outlook for industrial demand. Despite the recent rebound from the $22.10 support level, prices are still trading below the 50,100 and 200-day SMA while the MACD trades below zero.
- Sustained weakness below $23.70 could encourage a decline back towards $22.10.
- Should bulls break above the $23.70 level, this could open the doors toward the $25.20 resistance.

Brent slips from 10-month high
After hitting a fresh 10-month high yesterday, Brent has found itself under noticeable pressure with the daily bearish pin bar signalling further losses.
Prices remain firmly bullish on the daily charts as there have been consistently higher highs and higher lows while the MACD trades above zero. Given the strong upside momentum, Brent may be experiencing a technical throwback before bulls attempt to push the commodity beyond $96.10.
- However, a strong breakdown and daily close below $89.70 could signal the return of bears, with the next key level back at the 50-day SMA.

WTI bulls take a breather
It is a similar story for Crude which has shed roughly 1% this morning. Although prices are firmly bullish on the daily charts, the daily bearish pin bar could be an invitation for bears.
- Nevertheless, bulls remain in a position of power above the $88.40 dynamic support level.
- Should prices slip below this point and hit $86.40, this could invalidate the current uptrend with bears targeting lower levels, starting from $84.50 and 50-day SMA.

Natural Gas tests 200-day SMA
Natural gas prices remain in a weak bullish channel on the daily timeframe. However, prices are currently testing the 200-day SMA which may act as a formidable resistance level.
- A strong breakout above this point could encourage an incline towards $3.0 and $3.3 before bulls aim for $4.2.
- If the 200-day SMA proves to be a tough resistance to crack, this could encourage a decline back towards $2.4 and $2.1, respectively.

![]() Article by ForexTime
Article by ForexTime
ForexTime Ltd (FXTM) is an award winning international online forex broker regulated by CySEC 185/12 www.forextime.com