By Tom Stacey, Anglia Ruskin University
Automotive giants Tesla and Volvo have announced pauses to the production of their electric vehicles (EVs) in Europe. Electric vehicles are seeing record sales and demand worldwide, but a lack of parts means that factories cannot sustain their production.
The reasons for this are complex. Parts are taking longer to deliver as attacks by Houthi rebels force ships to avoid the Red Sea. And there are also issues around the monopoly that Chinese factories hold on many EV components, including crucial lithium batteries.
These factors have made it harder (and more expensive) to move parts across the globe to support EV production in Europe.
Modern global supply chains are tightly orchestrated. Moving goods to factories (and away from them to customers) is heavily demand driven. Forecasting this demand has become a huge industry, valued at over US$27 billion (£21.3 billion).
But even with all this intelligence, political tensions, pandemics and even stuck ships can turn this industry on its head overnight. This is particularly the case where the supply side is constrained, as it is with EV batteries from China.
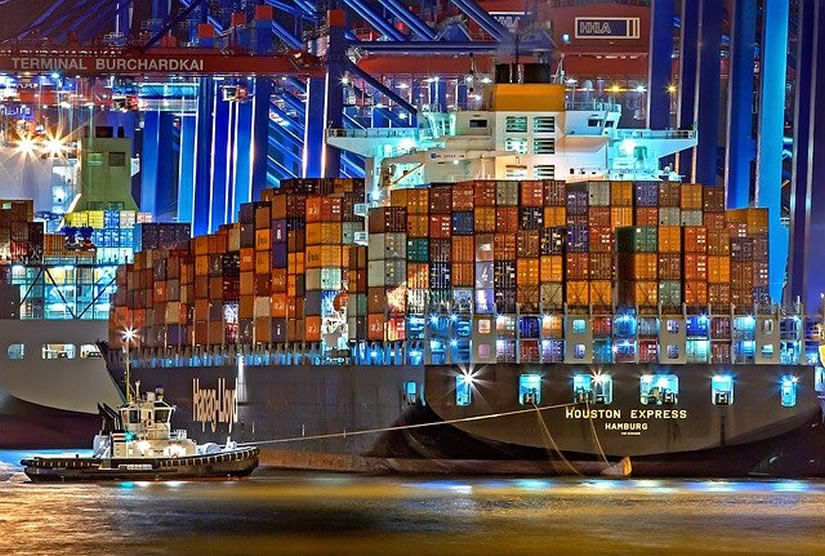
In 2021, a container ship called the Ever Given ran aground in the Suez Canal, blocking this vital shipping route from the far east to Europe for the best part of a week. The blockage prevented goods from passing through the canal, so had the knock-on effect of raising container shipping prices.
Even though the Suez canal has been open for two years, the recent attacks on commercial ships in the Red Sea have caused shipping companies to divert their ships to less direct routes – adding significant costs and time.
What does this mean for consumers and the planet? And are there ways for EV manufacturers to circumvent these risks?
Supply chains are fickle things
If manufacturers cannot produce due to shortages, then factories that make a single product such as Tesla’s gigafactory near Berlin (which produces the best-selling Model Y SUV) have one option – to idle the lines. Hourly-paid workers are sent home and where possible, salaried staff will continue in other roles such as safety checking and testing.
Tesla and Volvo have other factories and other product lines that can keep running. But even finished vehicles travelling from plants in China for sale in Europe are affected by the need to avoid the Red Sea. Vehicle manufacturer, Geely, who also produce Volvo vehicles in China, has warned of delays to European consumers expecting their new cars in early 2024.
Delays are not the only issue associated with shipping parts and vehicles around Africa to avoid the Red Sea. The 3,000 extra miles travelled by ships means they burn more fuel – a lot more fuel.
Peter Sand, a shipping analyst at ocean and air freight analytics platform, Xeneta, has estimated conservatively that each ship taking this route produces 2,700 extra tons of CO₂. If the international shipping industry were a country, it would already be among the world’s top carbon-emitting nations. And greenhouse gas emissions from ships are projected to increase by up to 50% by 2050.
EVs are undoubtedly better for the environment than their combustion engine counterparts. However, when supply is constrained, buyers often have little choice but to delay making the switch. Sales figures from 2023 show that private buyers still did not purchase as many EVs in the historically buoyant month of September as they did in the year before due to uncertainty in the market.
Fleet demand remains strong. But the market can only grow as fast as manufacturers can make cars. And pausing production is not going to help the transition.
Can manufacturers square this circle?
Clearly, these pinch points in the global supply chain have huge repercussions for manufacturers and consumers. Tesla’s factory in Germany is tight-lipped about actual production figures, but reports claim it makes around 4,000 units per week. Each car makes around US$8,000 profit, so this shut down could, in raw terms, lead to a loss of US$64 million in profit.
How do they prevent this? Supply chains do have some element of elasticity, but supply chain managers are always keen to reduce the potential of something known as the “bullwhip effect”. This is where marked differences in order quantities lead to even more shortages down the line. Managing expectations and reassuring buyers will thus help to smooth any issues with supply.
Making supply chains more resilient is also a huge area of research. Rerouting ships to prevent lost components is an example of this concept being put into practice.
If the parts were lost to rebel forces or pirates by taking the Red Sea route, then the revenue loss would be even larger. So although diverting routes is worse for the planet and arguably bad press, it would seem to be the lesser of two evils.
Multinational automotive manufacturer Stellantis has announced that it is instead bypassing the Red Sea by air-freighting parts to its EU factories. But, while this is faster than shipping parts around Africa, it’s not good for either CO₂ emissions or cost.
Keeping the global economy running
To reduce the disruptive potential of geopolitical tensions, Tesla and other automakers are attempting to produce their product closer to the consumer. The strategy is to put factories on each continent or geographical area where their products are sold.
However, as China still produces many of the core EV parts, manufacturers will have to invest heavily in their suppliers and put them closer to their factories.
Ultimately, this will require investment in skills and more factories. But with dropping profit margins, Chinese manufacturing dominance and inflationary pressures, it will continue to be a headache to implement.

Don’t have time to read about climate change as much as you’d like?
Get a weekly roundup in your inbox instead. Every Wednesday, The Conversation’s environment editor writes Imagine, a short email that goes a little deeper into just one climate issue. Join the 30,000+ readers who’ve subscribed so far.![]()
Tom Stacey, Senior Lecturer in Operations and Supply Chain Management, Anglia Ruskin University
This article is republished from The Conversation under a Creative Commons license. Read the original article.