By InvestMacro
Here are the latest charts and statistics for the Commitment of Traders (COT) data published by the Commodities Futures Trading Commission (CFTC).
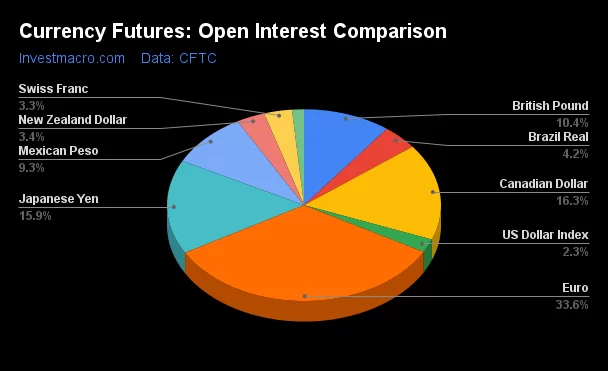
The latest COT data is updated through Tuesday August 13th and shows a quick view of how large market participants (for-profit speculators and commercial traders) were positioned in the futures markets. All currency positions are in direct relation to the US dollar where, for example, a bet for the euro is a bet that the euro will rise versus the dollar while a bet against the euro will be a bet that the euro will decline versus the dollar.
Weekly Speculator Changes led by Swiss Franc & Japanese Yen
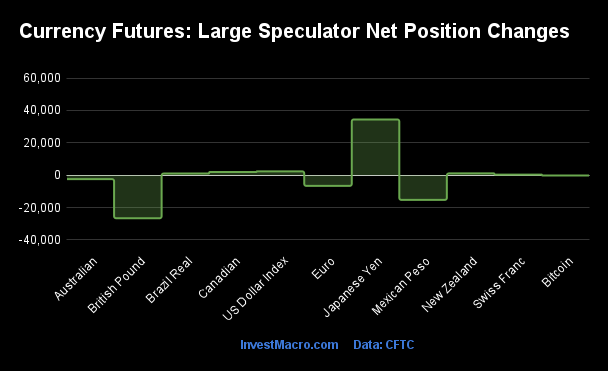
The COT currency market speculator bets were slightly overall higher this week as six out of the eleven currency markets we cover had higher positioning while the other five markets had lower speculator contracts.
Leading the gains for the currency markets was the Japanese Yen (34,458 contracts) with the US Dollar Index (2,400 contracts), the Canadian Dollar (2,021 contracts), the New Zealand Dollar (1,127 contracts), the Brazilian Real (1,041 contracts) and the Swiss Franc (409 contracts) also seeing positive weeks.
The currencies seeing declines in speculator bets on the week were the British Pound (-26,587 contracts), the Mexican Peso (-15,242 contracts), the EuroFX (-6,597 contracts), the Australian Dollar (-2,417 contracts) and with Bitcoin (-143 contracts) also registering lower bets on the week.
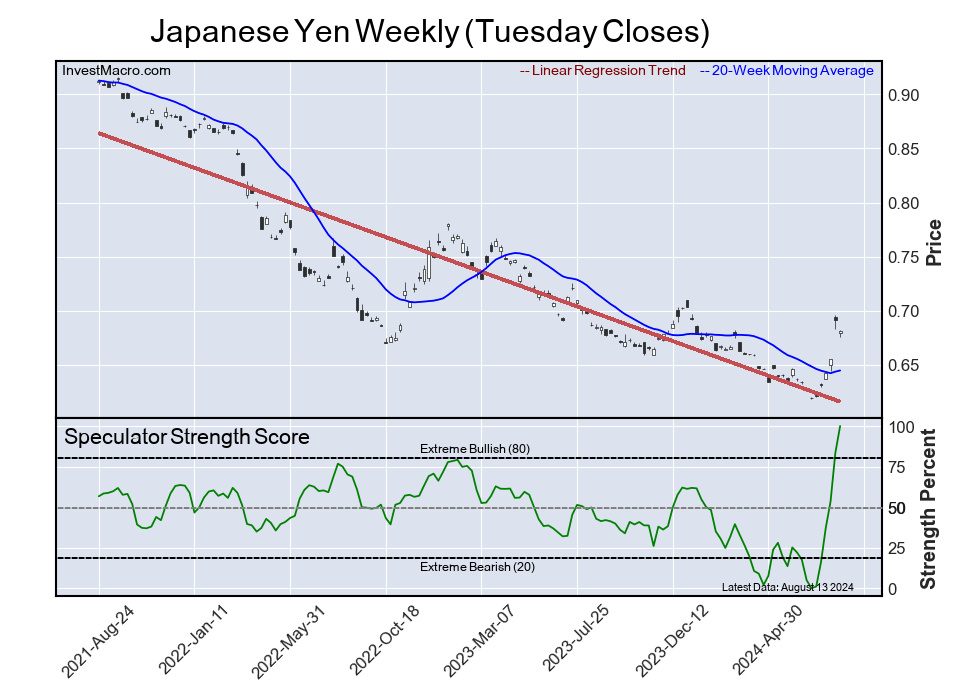
Speculators flip Japanese Yen bets into 1st bullish position since March 2021
Highlighting the COT currency’s data this week is sharp increase in bullish bets for the Japanese yen speculators. Large speculators followed up last week’s surge in buying of yen contracts with another strong weekly gain by +34,458 net contracts this week. Last week’s jump by +62,105 contracts was the third largest weekly gain on record (following +69,020 contracts on March 1st 2011 and the highest weekly change of +77,690 contracts on October 31st 2006).
Overall, speculators have now boosted yen positions for six consecutive weeks for a 6-week total increase of +207,327 contracts that has brought the positioning from -184,223 contracts on July 2nd to this week’s +23,104 contract level.
This is the first weekly bullish position following 178 consecutive weeks of bearish levels that dated back to March 9th of 2021. The 178-week streak of consecutive bearish positions marks the highest all-time streak – illustrating the depth of bearish sentiment the yen has experienced over the past few years.
The yen exchange rate versus the US dollar has now improved by almost 9 percent from the low-point reached in July, according to this week’s closing prices. The July low (USDJPY level of 161.95) was also the weakest level for the yen against the dollar since 1986. The USDJPY closed out the week at 147.54.
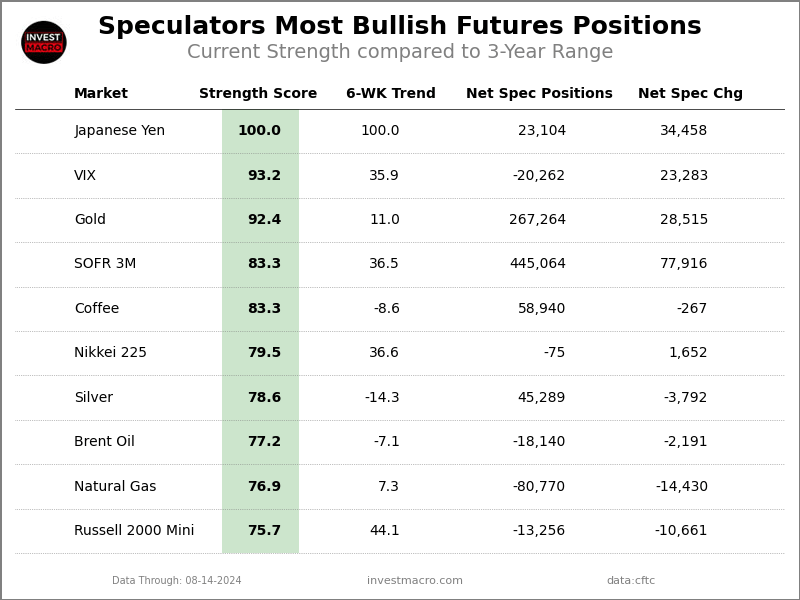
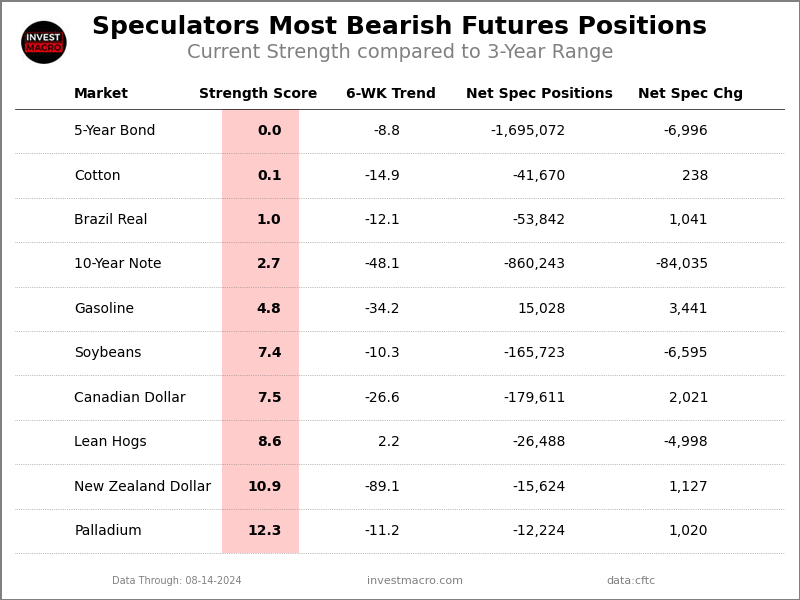
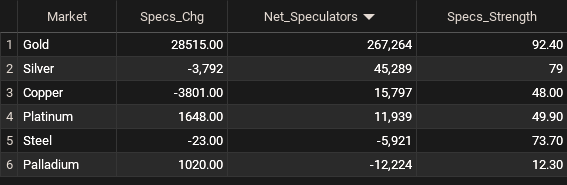
Currencies Net Speculators Leaderboard
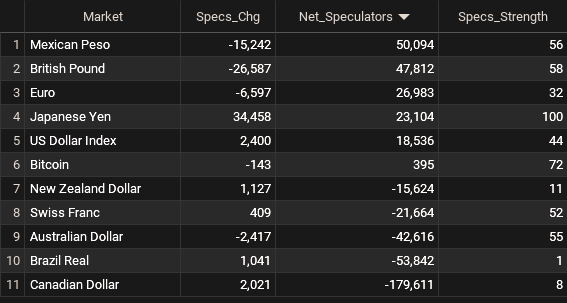
Legend: Weekly Speculators Change | Speculators Current Net Position | Speculators Strength Score compared to last 3-Years (0-100 range)
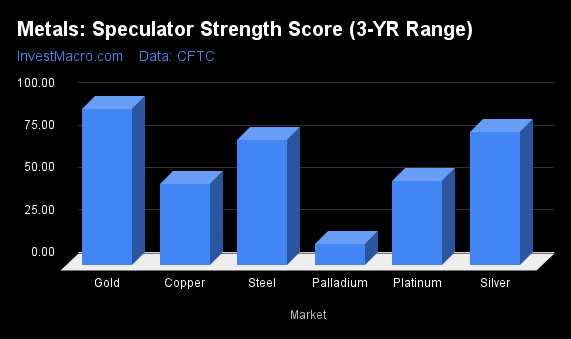
Strength Scores led by Japanese Yen & Bitcoin
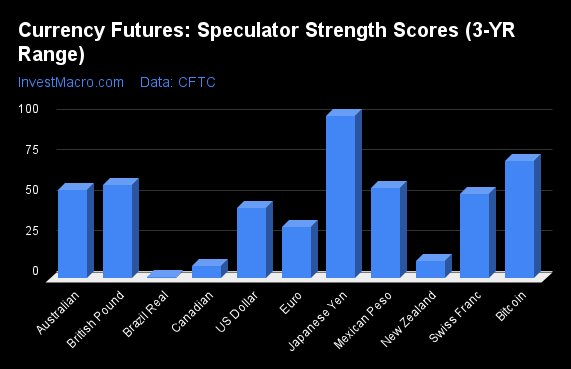
COT Strength Scores (a normalized measure of Speculator positions over a 3-Year range, from 0 to 100 where above 80 is Extreme-Bullish and below 20 is Extreme-Bearish) showed that the Japanese Yen (100 percent) and Bitcoin (72 percent) lead the currency markets this week. The British Pound (58 percent), Mexican Peso (56 percent) and the Australian Dollar (55 percent) come in as the next highest in the weekly strength scores.
On the downside, the Brazilian Real (1 percent), the Canadian Dollar (7 percent) and the New Zealand Dollar (11 percent) come in at the lowest strength levels currently and are in Extreme-Bearish territory (below 20 percent). The next lowest strength score is the EuroFX (32 percent).
Strength Statistics:
US Dollar Index (43.6 percent) vs US Dollar Index previous week (38.4 percent)
EuroFX (31.8 percent) vs EuroFX previous week (34.6 percent)
British Pound Sterling (57.6 percent) vs British Pound Sterling previous week (69.5 percent)
Japanese Yen (100.0 percent) vs Japanese Yen previous week (83.4 percent)
Swiss Franc (52.2 percent) vs Swiss Franc previous week (51.4 percent)
Canadian Dollar (7.5 percent) vs Canadian Dollar previous week (6.6 percent)
Australian Dollar (54.7 percent) vs Australian Dollar previous week (56.8 percent)
New Zealand Dollar (10.9 percent) vs New Zealand Dollar previous week (8.7 percent)
Mexican Peso (56.0 percent) vs Mexican Peso previous week (63.5 percent)
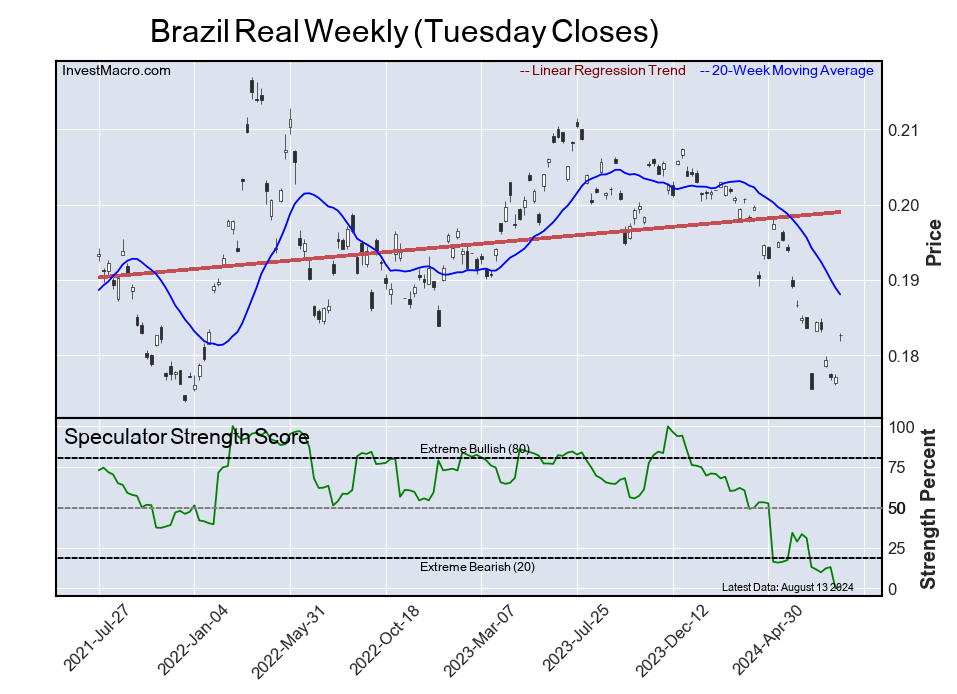
Brazilian Real (1.0 percent) vs Brazilian Real previous week (0.0 percent)
Bitcoin (72.4 percent) vs Bitcoin previous week (74.5 percent)
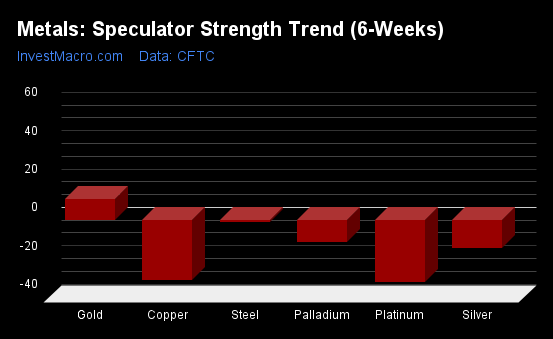
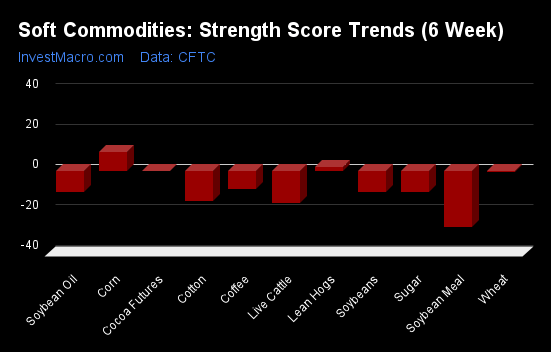
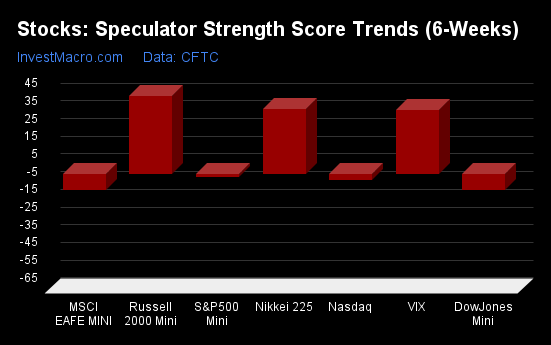
Japanese Yen & Swiss Franc top the 6-Week Strength Trends
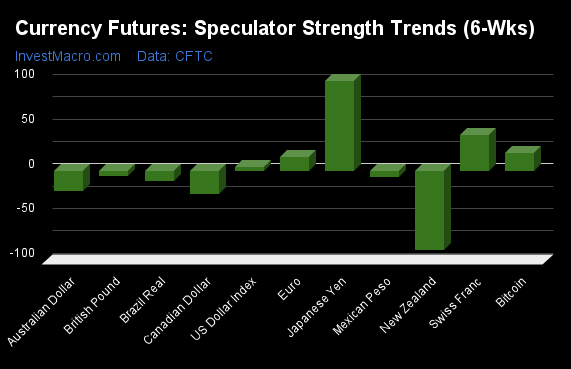
COT Strength Score Trends (or move index, calculates the 6-week changes in strength scores) showed that the Japanese Yen (100 percent) and the Swiss Franc (40 percent) lead the past six weeks trends for the currencies. Bitcoin (20 percent), the EuroFX (16 percent) and the US Dollar Index (4 percent) are the next highest positive movers in the latest trends data.
The New Zealand Dollar (-89 percent) leads the downside trend scores currently with the Canadian Dollar (-27 percent), the Australian Dollar (-23 percent) and the Brazilian Real (-12 percent) following next with lower trend scores.
Strength Trend Statistics:
US Dollar Index (4.2 percent) vs US Dollar Index previous week (-3.0 percent)
EuroFX (15.5 percent) vs EuroFX previous week (17.9 percent)
British Pound Sterling (-6.4 percent) vs British Pound Sterling previous week (13.6 percent)
Japanese Yen (100.0 percent) vs Japanese Yen previous week (78.4 percent)
Swiss Franc (40.4 percent) vs Swiss Franc previous week (24.1 percent)
Canadian Dollar (-26.6 percent) vs Canadian Dollar previous week (-26.5 percent)
Australian Dollar (-22.6 percent) vs Australian Dollar previous week (-13.9 percent)
New Zealand Dollar (-89.1 percent) vs New Zealand Dollar previous week (-83.4 percent)
Mexican Peso (-6.6 percent) vs Mexican Peso previous week (3.7 percent)
Brazilian Real (-12.1 percent) vs Brazilian Real previous week (-30.9 percent)
Bitcoin (19.7 percent) vs Bitcoin previous week (17.5 percent)
Individual COT Forex Markets:
US Dollar Index Futures:
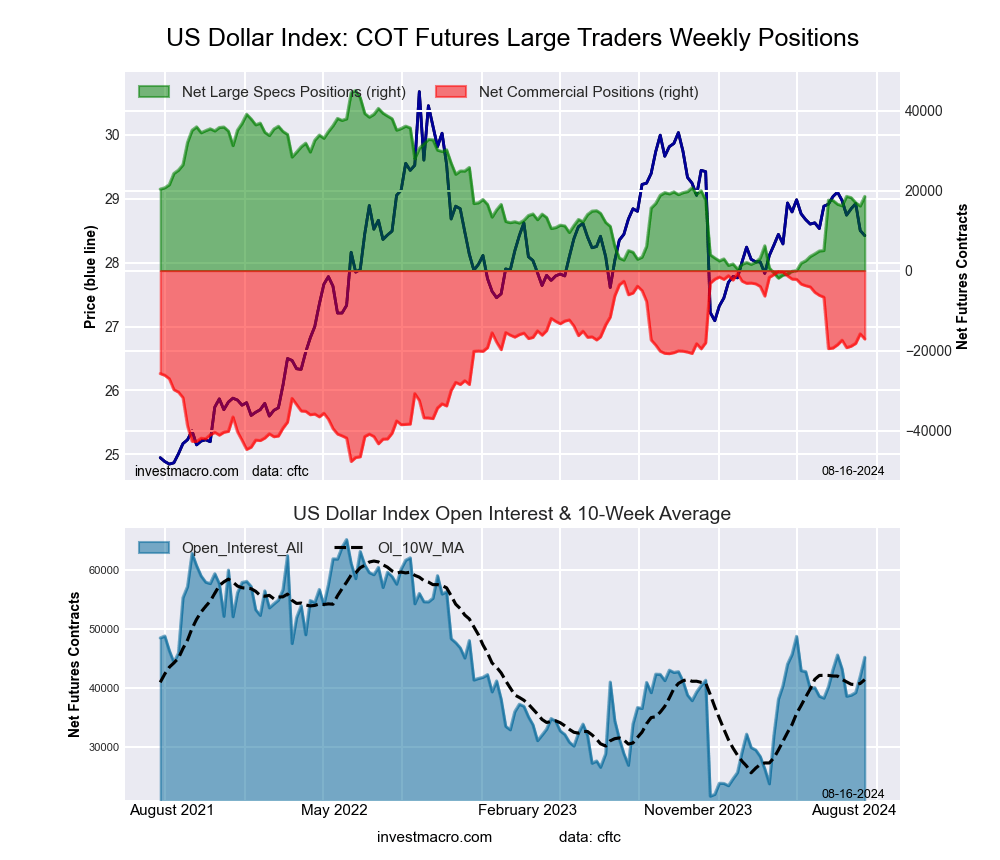 The US Dollar Index large speculator standing this week totaled a net position of 18,536 contracts in the data reported through Tuesday. This was a weekly boost of 2,400 contracts from the previous week which had a total of 16,136 net contracts.
This week’s current strength score (the trader positioning range over the past three years, measured from 0 to 100) shows the speculators are currently Bearish with a score of 43.6 percent. The commercials are Bullish with a score of 64.5 percent and the small traders (not shown in chart) are Bearish-Extreme with a score of 0.0 percent.
Price Trend-Following Model: Weak Uptrend
Our weekly trend-following model classifies the current market price position as: Weak Uptrend. The current action for the model is considered to be: Hold – Maintain Long Position.
| US DOLLAR INDEX Statistics | SPECULATORS | COMMERCIALS | SMALL TRADERS |
| – Percent of Open Interest Longs: | 74.5 | 18.0 | 4.9 |
| – Percent of Open Interest Shorts: | 33.5 | 55.8 | 8.0 |
| – Net Position: | 18,536 | -17,120 | -1,416 |
| – Gross Longs: | 33,686 | 8,138 | 2,194 |
| – Gross Shorts: | 15,150 | 25,258 | 3,610 |
| – Long to Short Ratio: | 2.2 to 1 | 0.3 to 1 | 0.6 to 1 |
| NET POSITION TREND: | | | |
| – Strength Index Score (3 Year Range Pct): | 43.6 | 64.5 | 0.0 |
| – Strength Index Reading (3 Year Range): | Bearish | Bullish | Bearish-Extreme |
| NET POSITION MOVEMENT INDEX: | | | |
| – 6-Week Change in Strength Index: | 4.2 | 3.0 | -37.5 |
Euro Currency Futures:
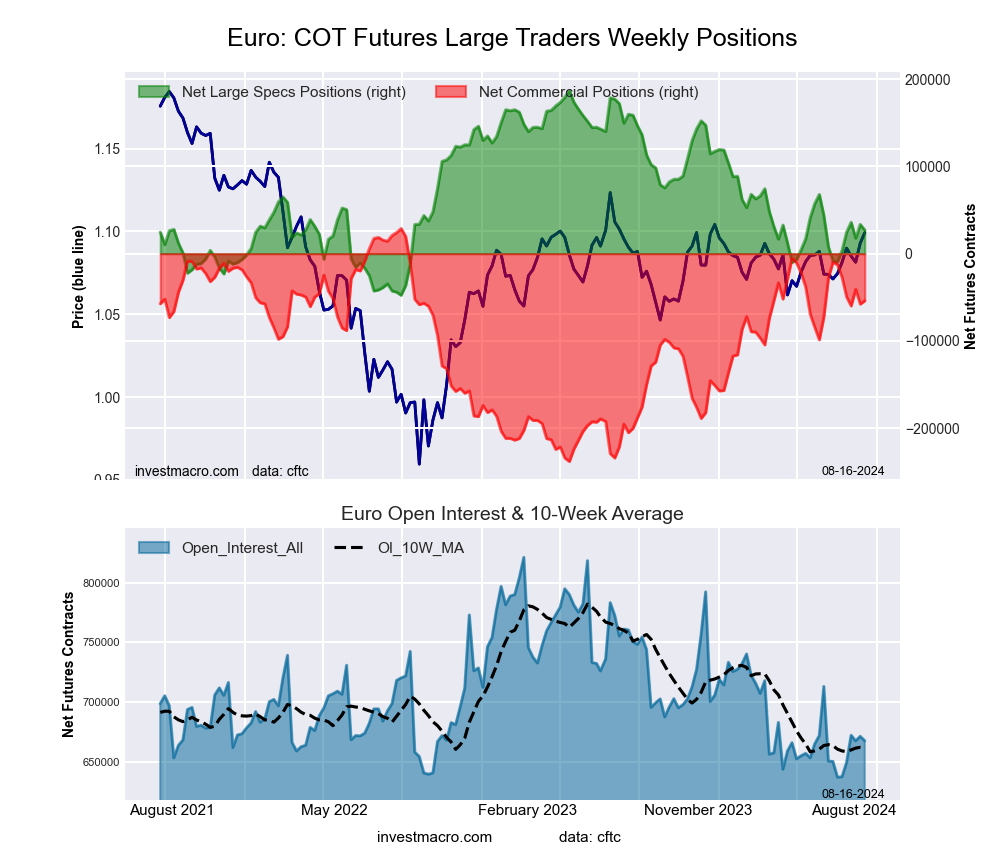 The Euro Currency large speculator standing this week totaled a net position of 26,983 contracts in the data reported through Tuesday. This was a weekly decrease of -6,597 contracts from the previous week which had a total of 33,580 net contracts.
This week’s current strength score (the trader positioning range over the past three years, measured from 0 to 100) shows the speculators are currently Bearish with a score of 31.8 percent. The commercials are Bullish with a score of 69.0 percent and the small traders (not shown in chart) are Bearish with a score of 31.6 percent.
Price Trend-Following Model: Strong Uptrend
Our weekly trend-following model classifies the current market price position as: Strong Uptrend. The current action for the model is considered to be: Hold – Maintain Long Position.
| EURO Currency Statistics | SPECULATORS | COMMERCIALS | SMALL TRADERS |
| – Percent of Open Interest Longs: | 27.3 | 57.3 | 11.6 |
| – Percent of Open Interest Shorts: | 23.3 | 65.4 | 7.6 |
| – Net Position: | 26,983 | -54,027 | 27,044 |
| – Gross Longs: | 182,212 | 382,394 | 77,589 |
| – Gross Shorts: | 155,229 | 436,421 | 50,545 |
| – Long to Short Ratio: | 1.2 to 1 | 0.9 to 1 | 1.5 to 1 |
| NET POSITION TREND: | | | |
| – Strength Index Score (3 Year Range Pct): | 31.8 | 69.0 | 31.6 |
| – Strength Index Reading (3 Year Range): | Bearish | Bullish | Bearish |
| NET POSITION MOVEMENT INDEX: | | | |
| – 6-Week Change in Strength Index: | 15.5 | -15.5 | 10.9 |
British Pound Sterling Futures:
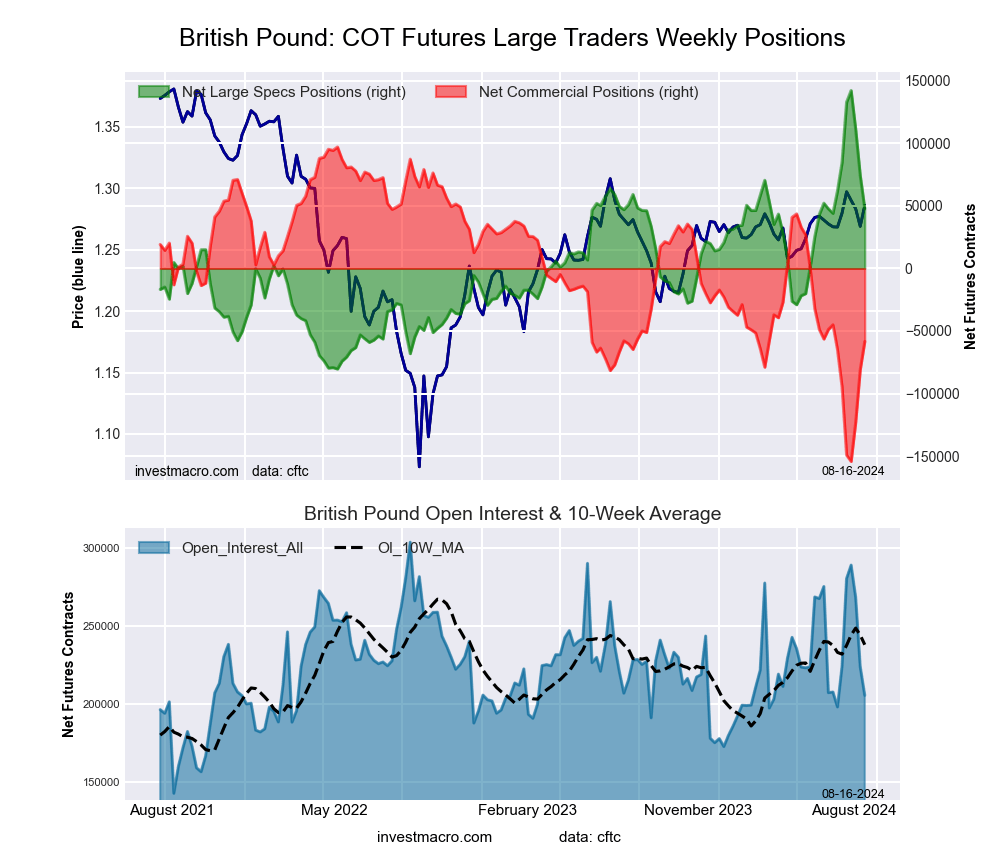 The British Pound Sterling large speculator standing this week totaled a net position of 47,812 contracts in the data reported through Tuesday. This was a weekly decline of -26,587 contracts from the previous week which had a total of 74,399 net contracts.
This week’s current strength score (the trader positioning range over the past three years, measured from 0 to 100) shows the speculators are currently Bullish with a score of 57.6 percent. The commercials are Bearish with a score of 38.2 percent and the small traders (not shown in chart) are Bullish-Extreme with a score of 84.3 percent.
Price Trend-Following Model: Strong Uptrend
Our weekly trend-following model classifies the current market price position as: Strong Uptrend. The current action for the model is considered to be: Hold – Maintain Long Position.
| BRITISH POUND Statistics | SPECULATORS | COMMERCIALS | SMALL TRADERS |
| – Percent of Open Interest Longs: | 49.9 | 27.8 | 17.7 |
| – Percent of Open Interest Shorts: | 26.7 | 56.2 | 12.6 |
| – Net Position: | 47,812 | -58,340 | 10,528 |
| – Gross Longs: | 102,603 | 57,134 | 36,458 |
| – Gross Shorts: | 54,791 | 115,474 | 25,930 |
| – Long to Short Ratio: | 1.9 to 1 | 0.5 to 1 | 1.4 to 1 |
| NET POSITION TREND: | | | |
| – Strength Index Score (3 Year Range Pct): | 57.6 | 38.2 | 84.3 |
| – Strength Index Reading (3 Year Range): | Bullish | Bearish | Bullish-Extreme |
| NET POSITION MOVEMENT INDEX: | | | |
| – 6-Week Change in Strength Index: | -6.4 | 2.7 | 15.8 |
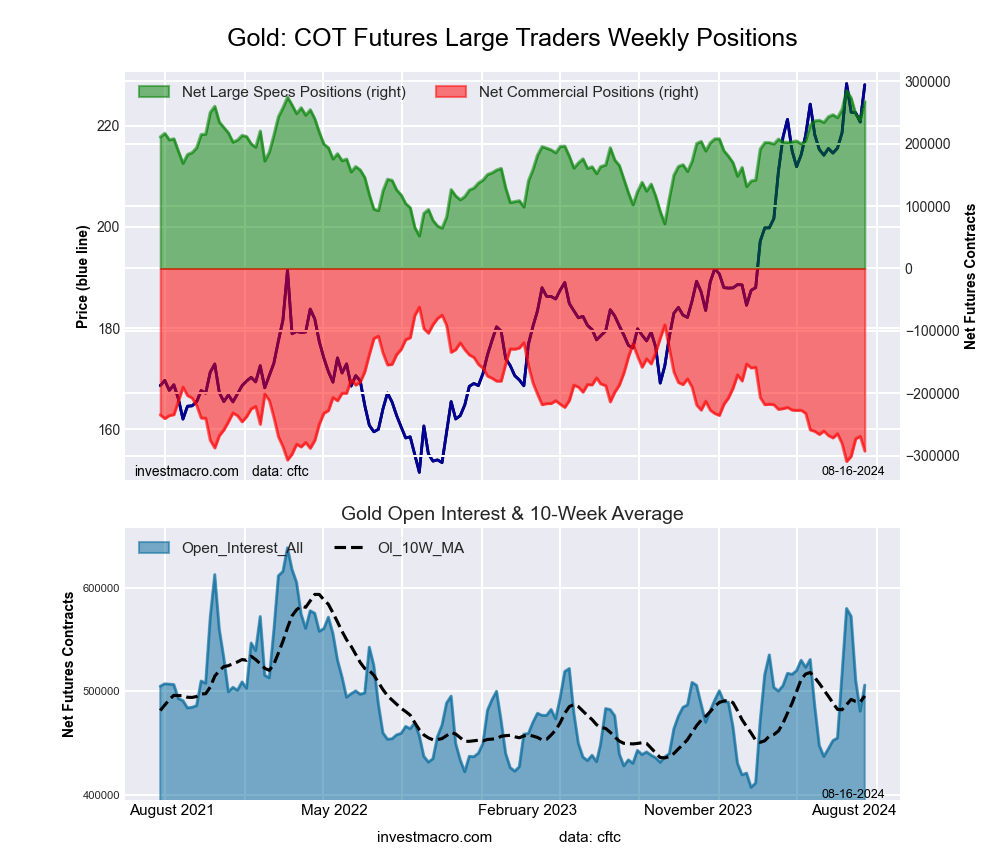
Japanese Yen Futures:
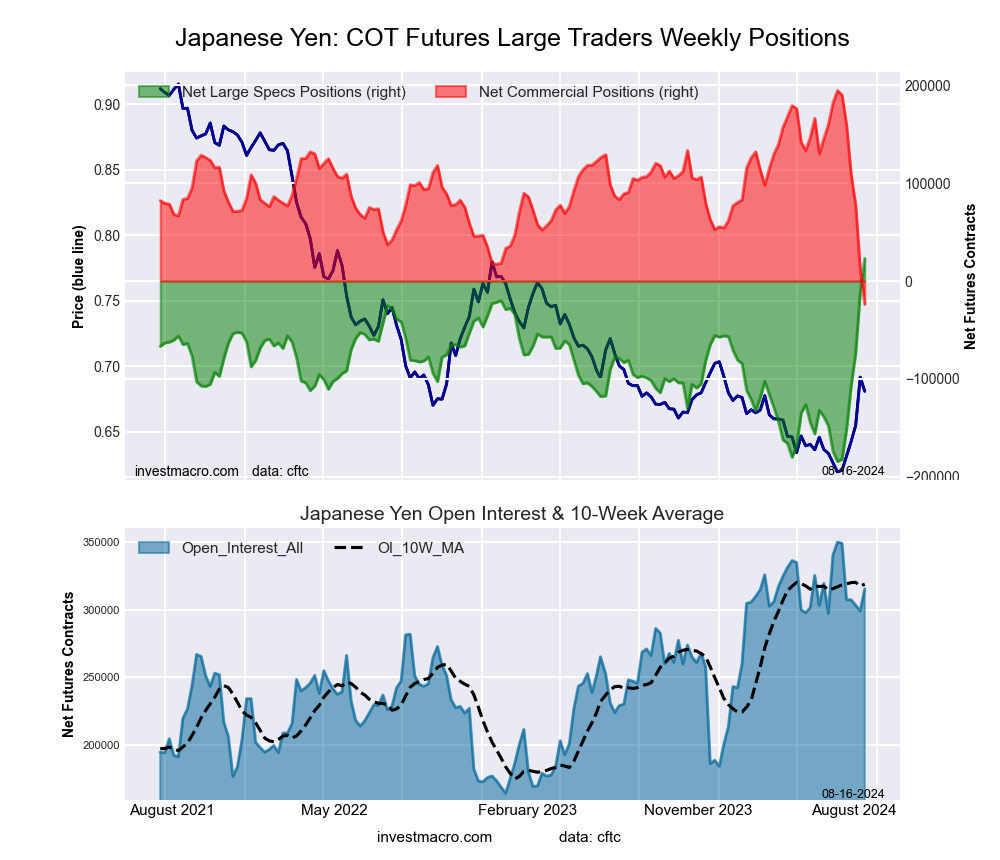 The Japanese Yen large speculator standing this week totaled a net position of 23,104 contracts in the data reported through Tuesday. This was a weekly gain of 34,458 contracts from the previous week which had a total of -11,354 net contracts.
This week’s current strength score (the trader positioning range over the past three years, measured from 0 to 100) shows the speculators are currently Bullish-Extreme with a score of 100.0 percent. The commercials are Bearish-Extreme with a score of 0.0 percent and the small traders (not shown in chart) are Bullish-Extreme with a score of 83.9 percent.
Price Trend-Following Model: Strong Uptrend
Our weekly trend-following model classifies the current market price position as: Strong Uptrend. The current action for the model is considered to be: New Buy – Long Position.
| JAPANESE YEN Statistics | SPECULATORS | COMMERCIALS | SMALL TRADERS |
| – Percent of Open Interest Longs: | 27.6 | 60.3 | 10.5 |
| – Percent of Open Interest Shorts: | 20.3 | 67.7 | 10.4 |
| – Net Position: | 23,104 | -23,527 | 423 |
| – Gross Longs: | 87,101 | 190,064 | 33,201 |
| – Gross Shorts: | 63,997 | 213,591 | 32,778 |
| – Long to Short Ratio: | 1.4 to 1 | 0.9 to 1 | 1.0 to 1 |
| NET POSITION TREND: | | | |
| – Strength Index Score (3 Year Range Pct): | 100.0 | 0.0 | 83.9 |
| – Strength Index Reading (3 Year Range): | Bullish-Extreme | Bearish-Extreme | Bullish-Extreme |
| NET POSITION MOVEMENT INDEX: | | | |
| – 6-Week Change in Strength Index: | 100.0 | -100.0 | 33.7 |
Swiss Franc Futures:
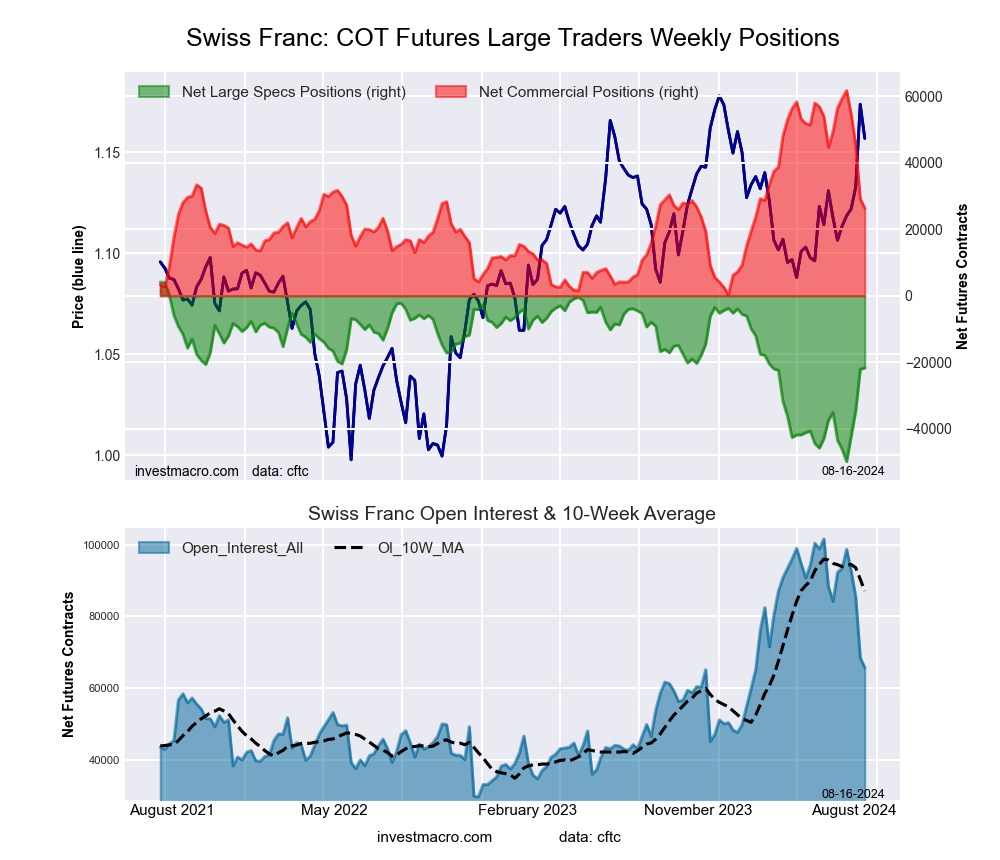 The Swiss Franc large speculator standing this week totaled a net position of -21,664 contracts in the data reported through Tuesday. This was a weekly boost of 409 contracts from the previous week which had a total of -22,073 net contracts.
This week’s current strength score (the trader positioning range over the past three years, measured from 0 to 100) shows the speculators are currently Bullish with a score of 52.2 percent. The commercials are Bearish with a score of 42.4 percent and the small traders (not shown in chart) are Bullish with a score of 56.1 percent.
Price Trend-Following Model: Strong Uptrend
Our weekly trend-following model classifies the current market price position as: Strong Uptrend. The current action for the model is considered to be: Hold – Maintain Long Position.
| SWISS FRANC Statistics | SPECULATORS | COMMERCIALS | SMALL TRADERS |
| – Percent of Open Interest Longs: | 13.9 | 67.0 | 18.5 |
| – Percent of Open Interest Shorts: | 46.9 | 26.9 | 25.6 |
| – Net Position: | -21,664 | 26,308 | -4,644 |
| – Gross Longs: | 9,155 | 44,026 | 12,177 |
| – Gross Shorts: | 30,819 | 17,718 | 16,821 |
| – Long to Short Ratio: | 0.3 to 1 | 2.5 to 1 | 0.7 to 1 |
| NET POSITION TREND: | | | |
| – Strength Index Score (3 Year Range Pct): | 52.2 | 42.4 | 56.1 |
| – Strength Index Reading (3 Year Range): | Bullish | Bearish | Bullish |
| NET POSITION MOVEMENT INDEX: | | | |
| – 6-Week Change in Strength Index: | 40.4 | -49.1 | 37.9 |
Canadian Dollar Futures:
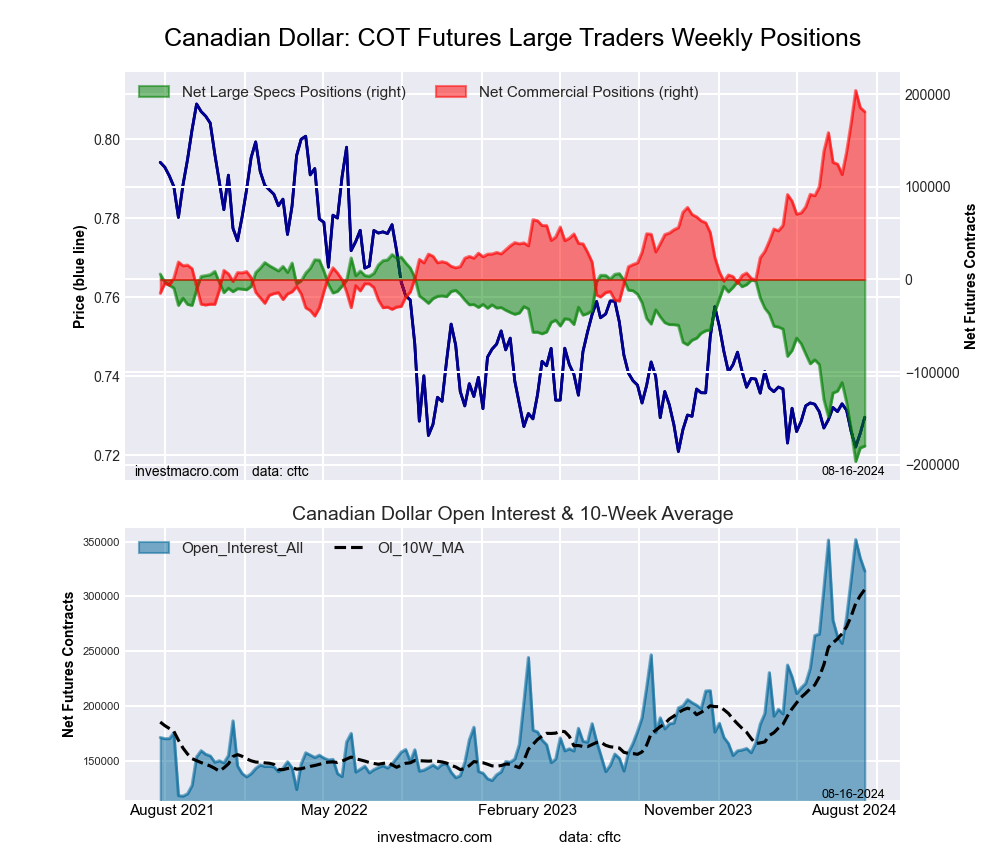 The Canadian Dollar large speculator standing this week totaled a net position of -179,611 contracts in the data reported through Tuesday. This was a weekly rise of 2,021 contracts from the previous week which had a total of -181,632 net contracts.
This week’s current strength score (the trader positioning range over the past three years, measured from 0 to 100) shows the speculators are currently Bearish-Extreme with a score of 7.5 percent. The commercials are Bullish-Extreme with a score of 90.6 percent and the small traders (not shown in chart) are Bearish with a score of 26.8 percent.
Price Trend-Following Model: Weak Downtrend
Our weekly trend-following model classifies the current market price position as: Weak Downtrend. The current action for the model is considered to be: Hold – Maintain Short Position.
| CANADIAN DOLLAR Statistics | SPECULATORS | COMMERCIALS | SMALL TRADERS |
| – Percent of Open Interest Longs: | 6.4 | 82.1 | 9.6 |
| – Percent of Open Interest Shorts: | 62.0 | 26.1 | 10.1 |
| – Net Position: | -179,611 | 180,958 | -1,347 |
| – Gross Longs: | 20,668 | 265,254 | 31,163 |
| – Gross Shorts: | 200,279 | 84,296 | 32,510 |
| – Long to Short Ratio: | 0.1 to 1 | 3.1 to 1 | 1.0 to 1 |
| NET POSITION TREND: | | | |
| – Strength Index Score (3 Year Range Pct): | 7.5 | 90.6 | 26.8 |
| – Strength Index Reading (3 Year Range): | Bearish-Extreme | Bullish-Extreme | Bearish |
| NET POSITION MOVEMENT INDEX: | | | |
| – 6-Week Change in Strength Index: | -26.6 | 23.2 | 8.3 |
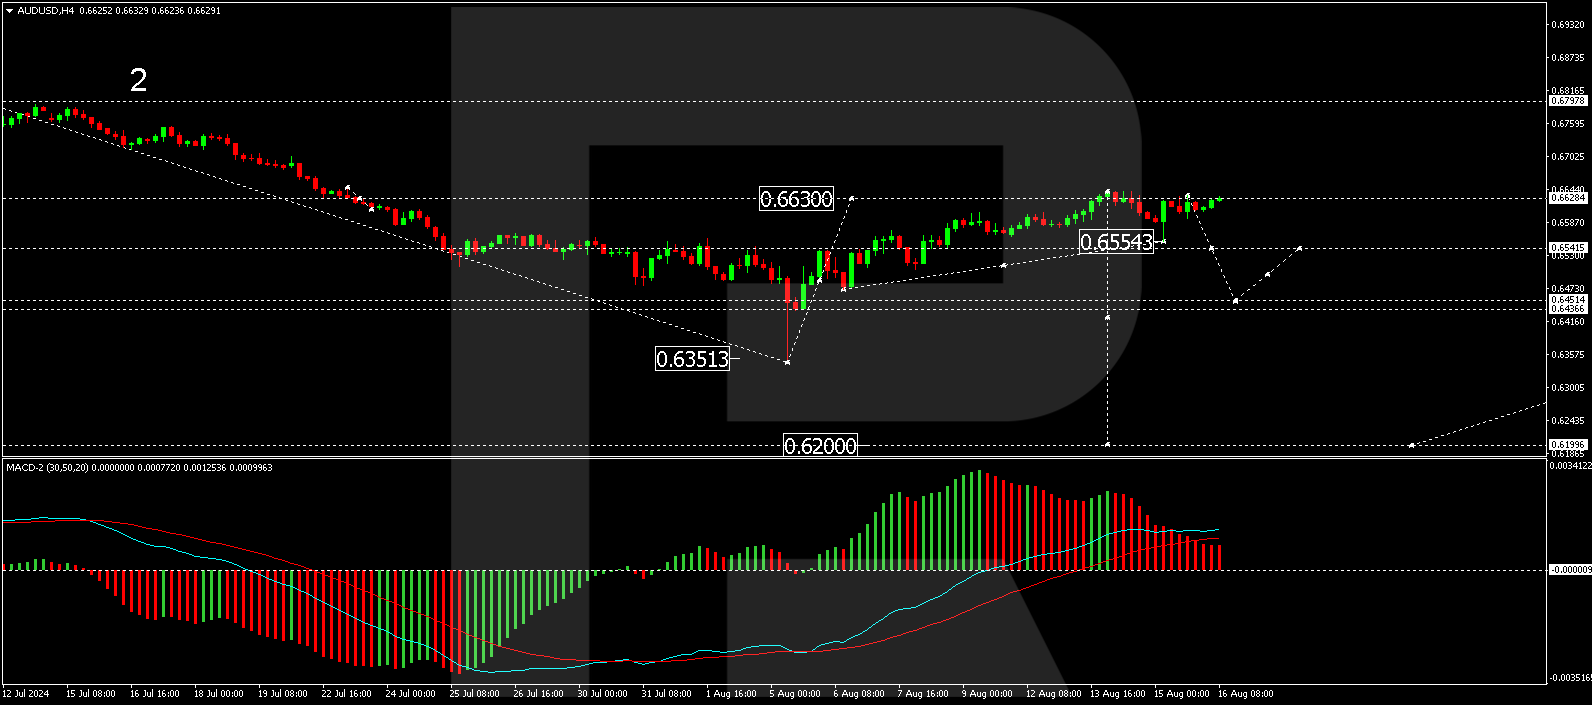
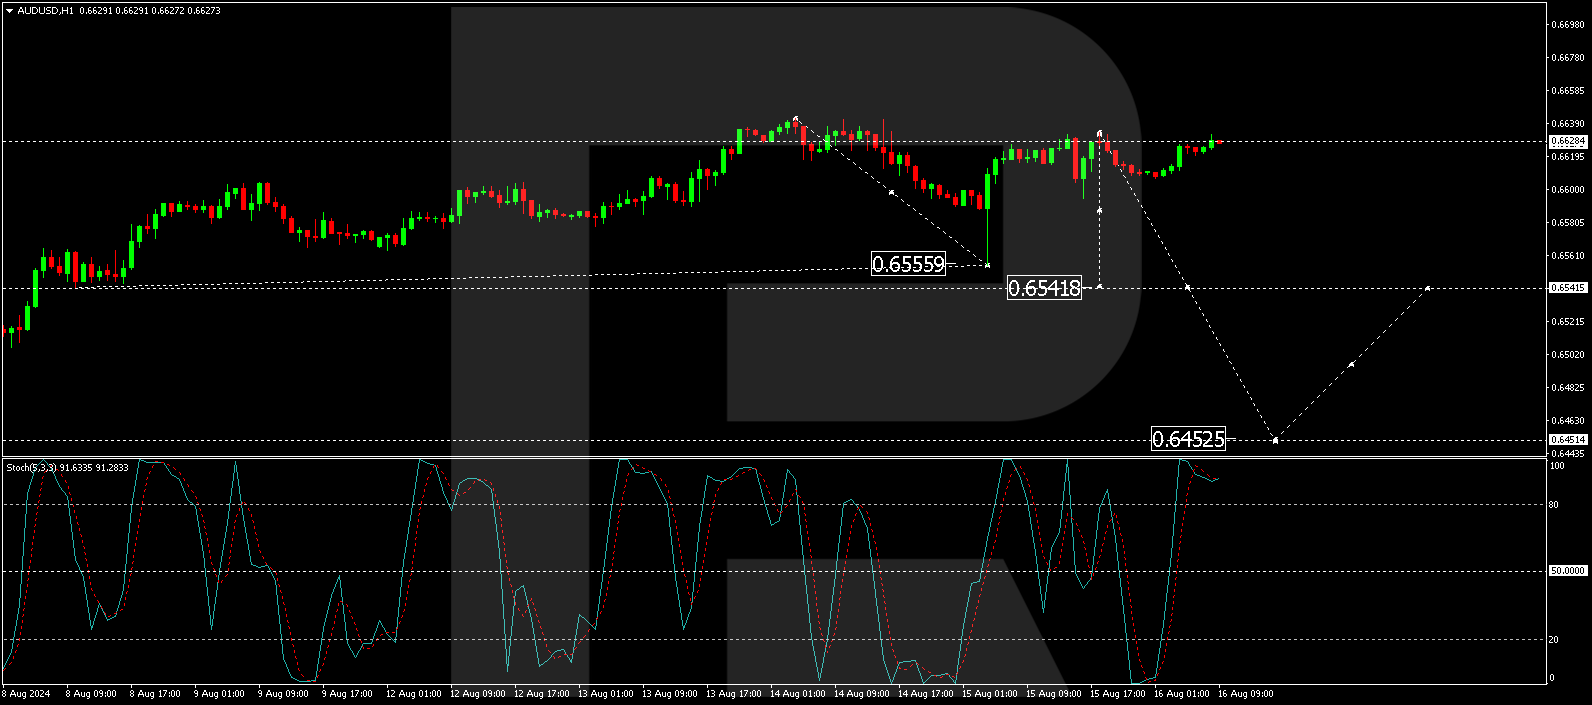
Australian Dollar Futures:
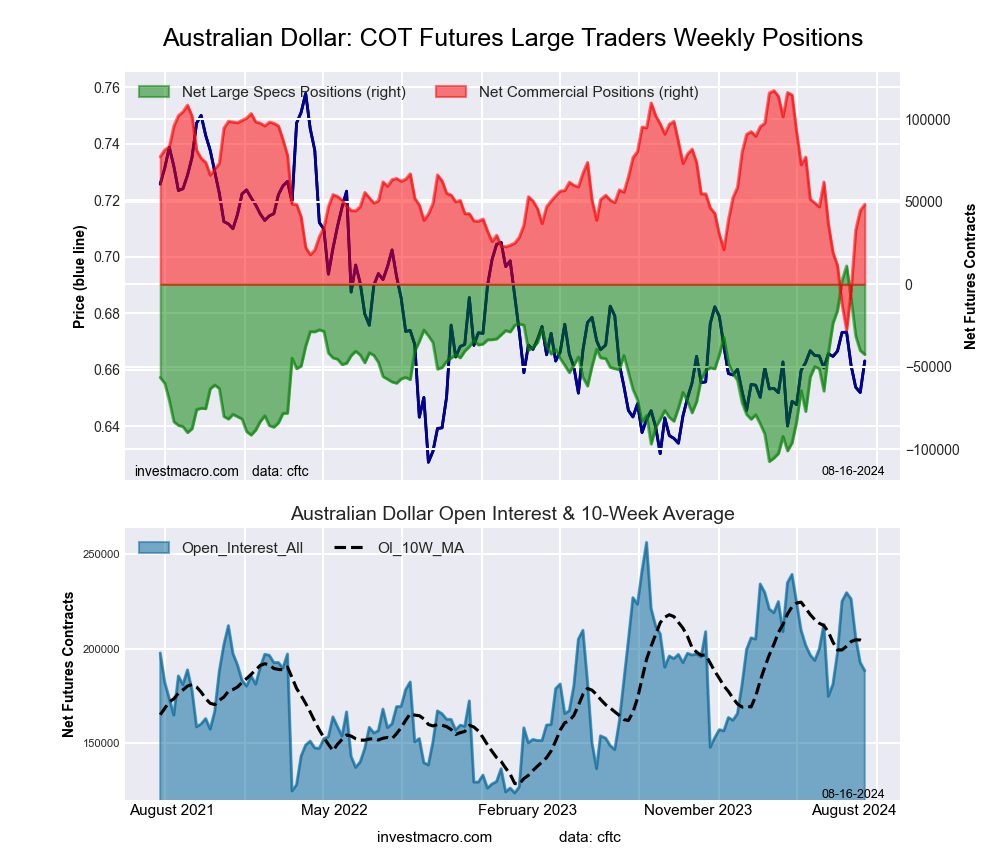 The Australian Dollar large speculator standing this week totaled a net position of -42,616 contracts in the data reported through Tuesday. This was a weekly reduction of -2,417 contracts from the previous week which had a total of -40,199 net contracts.
This week’s current strength score (the trader positioning range over the past three years, measured from 0 to 100) shows the speculators are currently Bullish with a score of 54.7 percent. The commercials are Bullish with a score of 52.5 percent and the small traders (not shown in chart) are Bearish with a score of 40.9 percent.
Price Trend-Following Model: Uptrend
Our weekly trend-following model classifies the current market price position as: Uptrend. The current action for the model is considered to be: Hold – Maintain Long Position.
| AUSTRALIAN DOLLAR Statistics | SPECULATORS | COMMERCIALS | SMALL TRADERS |
| – Percent of Open Interest Longs: | 34.5 | 50.0 | 13.1 |
| – Percent of Open Interest Shorts: | 57.2 | 24.2 | 16.2 |
| – Net Position: | -42,616 | 48,481 | -5,865 |
| – Gross Longs: | 65,028 | 94,084 | 24,636 |
| – Gross Shorts: | 107,644 | 45,603 | 30,501 |
| – Long to Short Ratio: | 0.6 to 1 | 2.1 to 1 | 0.8 to 1 |
| NET POSITION TREND: | | | |
| – Strength Index Score (3 Year Range Pct): | 54.7 | 52.5 | 40.9 |
| – Strength Index Reading (3 Year Range): | Bullish | Bullish | Bearish |
| NET POSITION MOVEMENT INDEX: | | | |
| – 6-Week Change in Strength Index: | -22.6 | 25.6 | -27.2 |
New Zealand Dollar Futures:
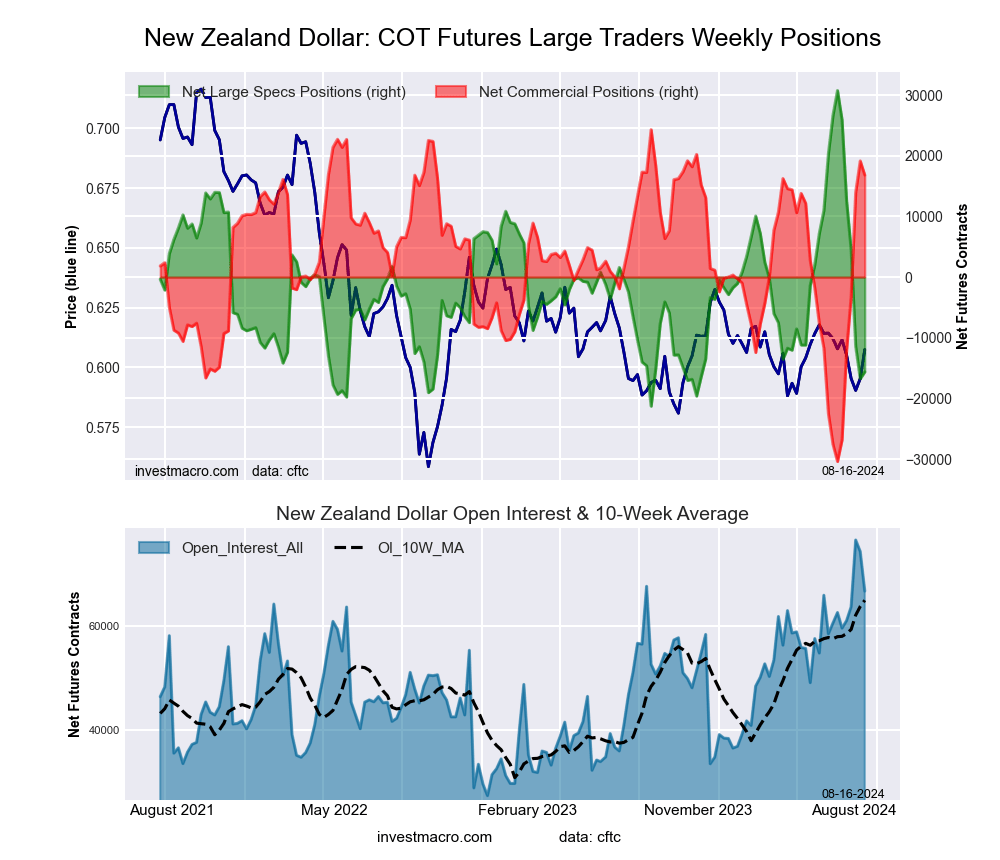 The New Zealand Dollar large speculator standing this week totaled a net position of -15,624 contracts in the data reported through Tuesday. This was a weekly advance of 1,127 contracts from the previous week which had a total of -16,751 net contracts.
This week’s current strength score (the trader positioning range over the past three years, measured from 0 to 100) shows the speculators are currently Bearish-Extreme with a score of 10.9 percent. The commercials are Bullish-Extreme with a score of 86.3 percent and the small traders (not shown in chart) are Bearish with a score of 42.0 percent.
Price Trend-Following Model: Uptrend
Our weekly trend-following model classifies the current market price position as: Uptrend. The current action for the model is considered to be: Hold – Maintain Long Position.
| NEW ZEALAND DOLLAR Statistics | SPECULATORS | COMMERCIALS | SMALL TRADERS |
| – Percent of Open Interest Longs: | 25.6 | 67.5 | 6.4 |
| – Percent of Open Interest Shorts: | 49.1 | 42.3 | 8.1 |
| – Net Position: | -15,624 | 16,811 | -1,187 |
| – Gross Longs: | 17,050 | 44,973 | 4,240 |
| – Gross Shorts: | 32,674 | 28,162 | 5,427 |
| – Long to Short Ratio: | 0.5 to 1 | 1.6 to 1 | 0.8 to 1 |
| NET POSITION TREND: | | | |
| – Strength Index Score (3 Year Range Pct): | 10.9 | 86.3 | 42.0 |
| – Strength Index Reading (3 Year Range): | Bearish-Extreme | Bullish-Extreme | Bearish |
| NET POSITION MOVEMENT INDEX: | | | |
| – 6-Week Change in Strength Index: | -89.1 | 86.3 | -11.6 |
Mexican Peso Futures:
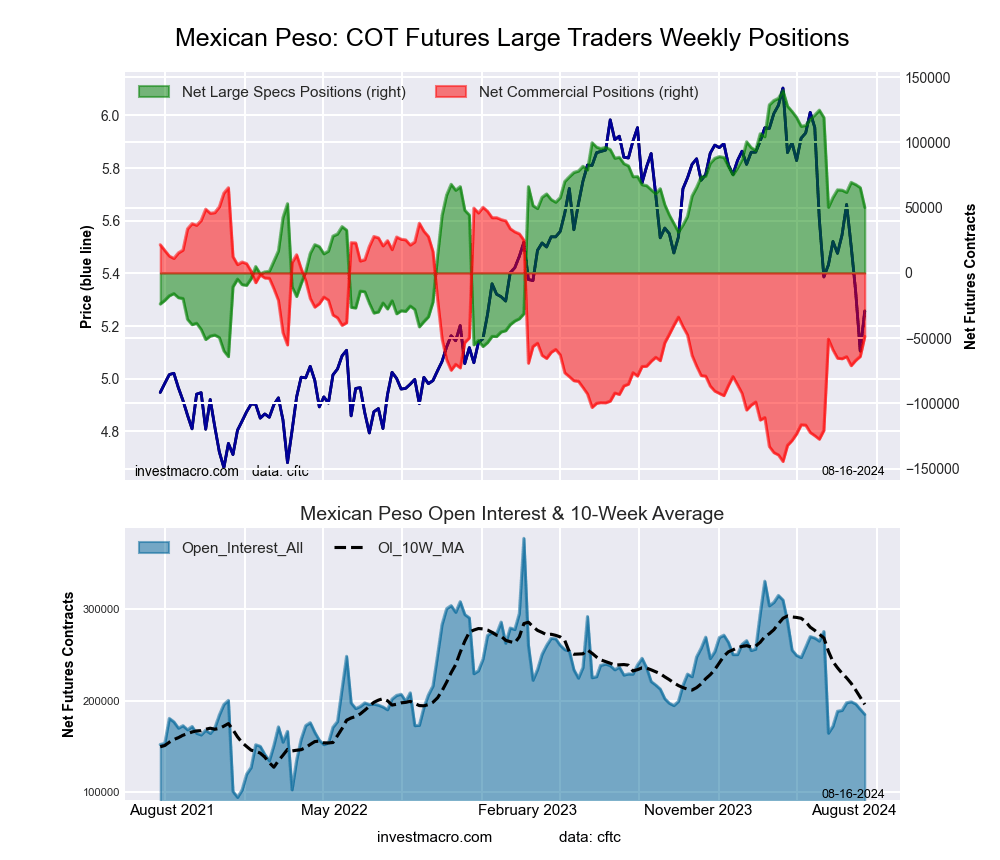 The Mexican Peso large speculator standing this week totaled a net position of 50,094 contracts in the data reported through Tuesday. This was a weekly decline of -15,242 contracts from the previous week which had a total of 65,336 net contracts.
This week’s current strength score (the trader positioning range over the past three years, measured from 0 to 100) shows the speculators are currently Bullish with a score of 56.0 percent. The commercials are Bearish with a score of 45.7 percent and the small traders (not shown in chart) are Bearish-Extreme with a score of 2.3 percent.
Price Trend-Following Model: Downtrend
Our weekly trend-following model classifies the current market price position as: Downtrend. The current action for the model is considered to be: Hold – Maintain Short Position.
| MEXICAN PESO Statistics | SPECULATORS | COMMERCIALS | SMALL TRADERS |
| – Percent of Open Interest Longs: | 44.4 | 51.7 | 2.1 |
| – Percent of Open Interest Shorts: | 17.4 | 78.0 | 2.8 |
| – Net Position: | 50,094 | -48,708 | -1,386 |
| – Gross Longs: | 82,188 | 95,620 | 3,845 |
| – Gross Shorts: | 32,094 | 144,328 | 5,231 |
| – Long to Short Ratio: | 2.6 to 1 | 0.7 to 1 | 0.7 to 1 |
| NET POSITION TREND: | | | |
| – Strength Index Score (3 Year Range Pct): | 56.0 | 45.7 | 2.3 |
| – Strength Index Reading (3 Year Range): | Bullish | Bearish | Bearish-Extreme |
| NET POSITION MOVEMENT INDEX: | | | |
| – 6-Week Change in Strength Index: | -6.6 | 7.9 | -19.8 |
Brazilian Real Futures:
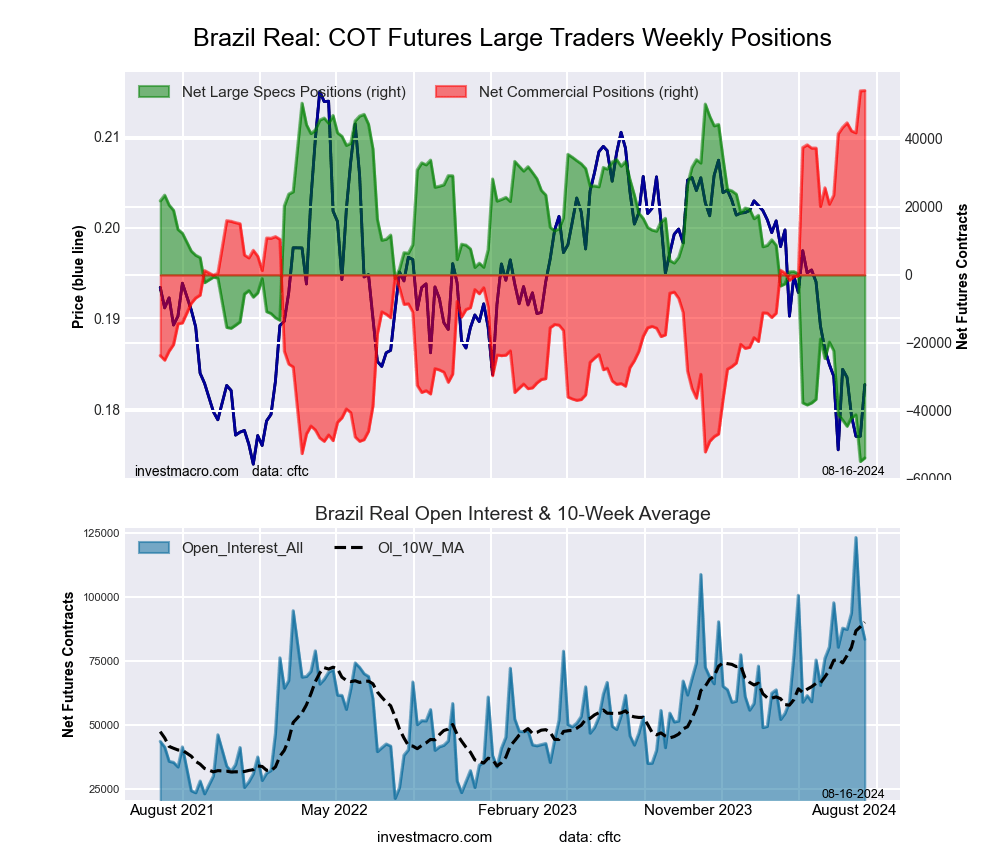 The Brazilian Real large speculator standing this week totaled a net position of -53,842 contracts in the data reported through Tuesday. This was a weekly lift of 1,041 contracts from the previous week which had a total of -54,883 net contracts.
This week’s current strength score (the trader positioning range over the past three years, measured from 0 to 100) shows the speculators are currently Bearish-Extreme with a score of 1.0 percent. The commercials are Bullish-Extreme with a score of 100.0 percent and the small traders (not shown in chart) are Bearish with a score of 30.9 percent.
Price Trend-Following Model: Downtrend
Our weekly trend-following model classifies the current market price position as: Downtrend. The current action for the model is considered to be: Hold – Maintain Short Position.
| BRAZIL REAL Statistics | SPECULATORS | COMMERCIALS | SMALL TRADERS |
| – Percent of Open Interest Longs: | 22.4 | 75.0 | 2.5 |
| – Percent of Open Interest Shorts: | 87.0 | 10.0 | 3.0 |
| – Net Position: | -53,842 | 54,218 | -376 |
| – Gross Longs: | 18,700 | 62,592 | 2,117 |
| – Gross Shorts: | 72,542 | 8,374 | 2,493 |
| – Long to Short Ratio: | 0.3 to 1 | 7.5 to 1 | 0.8 to 1 |
| NET POSITION TREND: | | | |
| – Strength Index Score (3 Year Range Pct): | 1.0 | 100.0 | 30.9 |
| – Strength Index Reading (3 Year Range): | Bearish-Extreme | Bullish-Extreme | Bearish |
| NET POSITION MOVEMENT INDEX: | | | |
| – 6-Week Change in Strength Index: | -12.1 | 11.9 | 0.3 |
Bitcoin Futures:
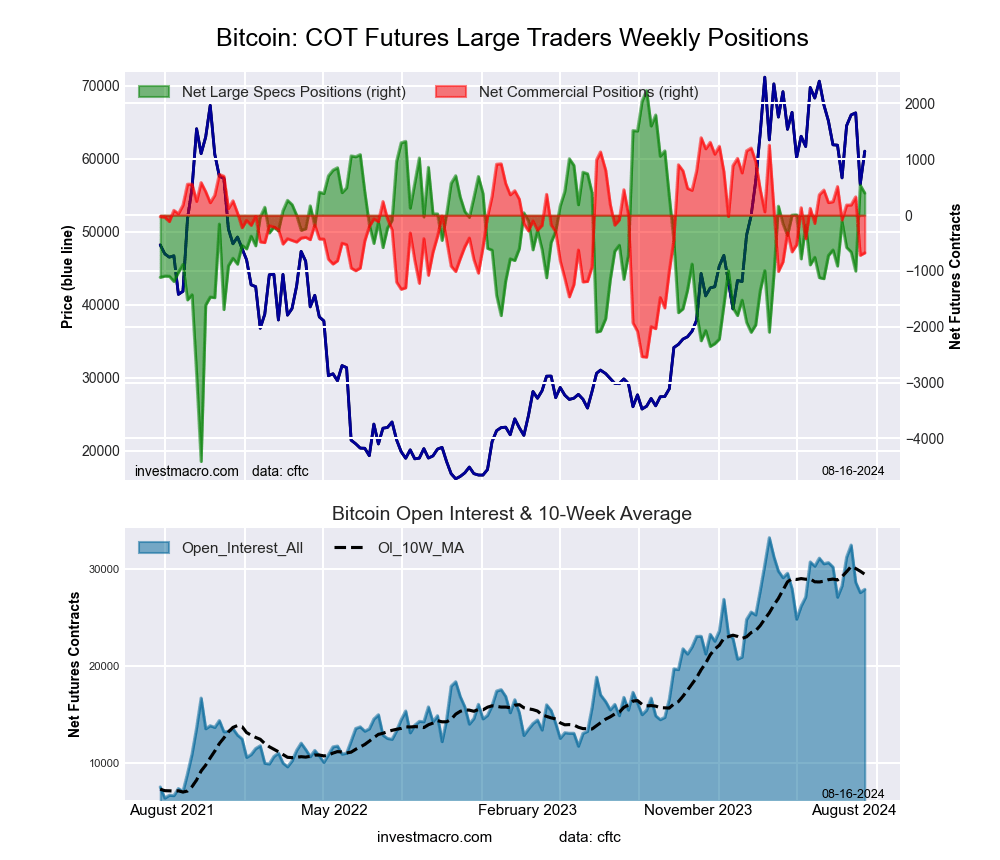 The Bitcoin large speculator standing this week totaled a net position of 395 contracts in the data reported through Tuesday. This was a weekly reduction of -143 contracts from the previous week which had a total of 538 net contracts.
This week’s current strength score (the trader positioning range over the past three years, measured from 0 to 100) shows the speculators are currently Bullish with a score of 72.4 percent. The commercials are Bearish with a score of 47.5 percent and the small traders (not shown in chart) are Bearish-Extreme with a score of 19.3 percent.
Price Trend-Following Model: Strong Downtrend
Our weekly trend-following model classifies the current market price position as: Strong Downtrend. The current action for the model is considered to be: Hold – Maintain Short Position.
| BITCOIN Statistics | SPECULATORS | COMMERCIALS | SMALL TRADERS |
| – Percent of Open Interest Longs: | 86.5 | 2.3 | 4.1 |
| – Percent of Open Interest Shorts: | 85.1 | 4.7 | 3.1 |
| – Net Position: | 395 | -676 | 281 |
| – Gross Longs: | 24,121 | 644 | 1,148 |
| – Gross Shorts: | 23,726 | 1,320 | 867 |
| – Long to Short Ratio: | 1.0 to 1 | 0.5 to 1 | 1.3 to 1 |
| NET POSITION TREND: | | | |
| – Strength Index Score (3 Year Range Pct): | 72.4 | 47.5 | 19.3 |
| – Strength Index Reading (3 Year Range): | Bullish | Bearish | Bearish-Extreme |
| NET POSITION MOVEMENT INDEX: | | | |
| – 6-Week Change in Strength Index: | 19.7 | -30.2 | -2.7 |
Article By InvestMacro – Receive our weekly COT Newsletter
*COT Report: The COT data, released weekly to the public each Friday, is updated through the most recent Tuesday (data is 3 days old) and shows a quick view of how large speculators or non-commercials (for-profit traders) were positioned in the futures markets.
The CFTC categorizes trader positions according to commercial hedgers (traders who use futures contracts for hedging as part of the business), non-commercials (large traders who speculate to realize trading profits) and nonreportable traders (usually small traders/speculators) as well as their open interest (contracts open in the market at time of reporting). See CFTC criteria here.