Offshore wind farms connected by an underwater power grid for transmission could revolutionize how the East Coast gets its electricity

By Tyler Hansen, Dartmouth College; Abraham Silverman, Johns Hopkins University; Elizabeth J. Wilson, Dartmouth College, and Erin Baker, UMass Amherst 

Offshore winds have the potential to supply coastlines with massive, consistent flows of clean electricity. One study estimates wind farms just offshore could meet 11 times the projected global electricity demand in 2040.

In the U.S., the East Coast is an ideal location to capture this power, but there’s a problem: getting electricity from ocean wind farms to the cities and towns that need it.

While everyone wants reliable electricity in their homes and businesses, few support the construction of the transmission lines necessary to get it there. This has always been a problem, both in the U.S. and internationally, but it is becoming an even bigger challenge as countries speed toward net-zero carbon energy systems that will use more electricity.

The U.S. Department of Energy and 10 states in the Northeast States Collaborative on Interregional Transmission are working on a potentially transformative solution: plans for an offshore electric power grid.

Two illustrations show a line of wind farms, the first with each one individually connected to land and the second with all connected to a transmission backbone with only two connections to land.
How an offshore transmission backbone could reduce the number of transmission lines and land crossings.
Illustrations by Billy Roberts, NREL

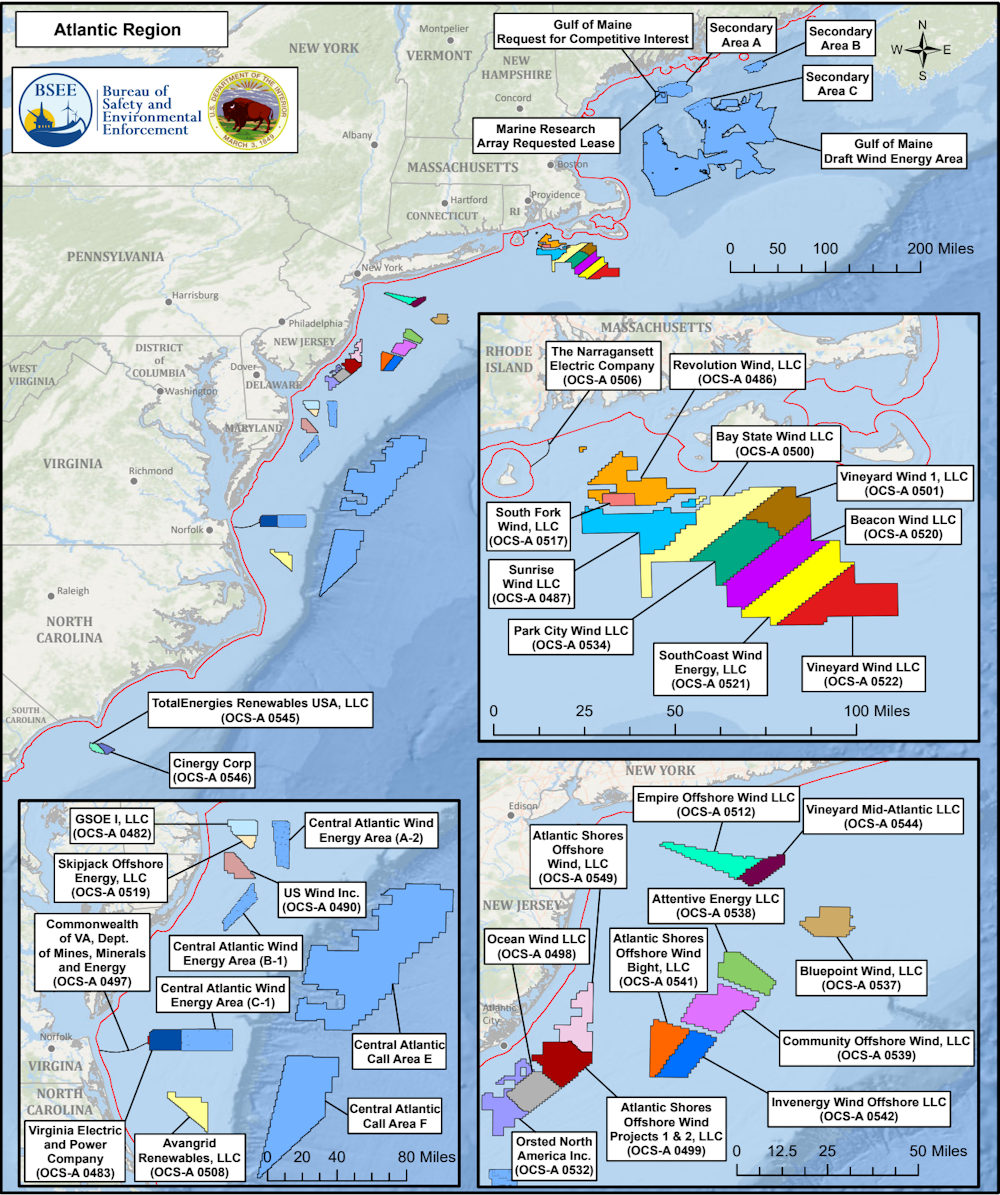
At the core of this grid would be backbone transmission lines off the East Coast, from North Carolina to Maine, where dozens of offshore wind projects are already in the pipeline.

The plans envision it supporting at least 85 gigawatts of offshore wind power by 2050 – close to the U.S. goal of 110 GW of installed wind power by mid-century, enough to power 40 million homes and up from 0.2 GW today. The Northeast States Collaborative formalized their goals in July 2024 through a multistate memorandum of understanding.

Emerging research from the Department of Energy, the research company Brattle and other groups suggests that an offshore electric power grid could mitigate key challenges to building new transmission lines on land and reduce the costs of offshore wind power.

Cutting costs would be welcome news – offshore wind project costs rose as much as 50% from 2021 to 2023. While some of the underlying causes have subsided, such as inflation and global supply chain disruptions, interest rates remain high, and the industry is still trying to find its footing in the U.S.

What is an offshore electric power grid?

Today’s offshore wind projects use a point-to-point, or radial design, where each offshore wind farm is individually connected to the onshore grid.

This method works if a region has only a few projects, but it quickly becomes more expensive due to the cabling and other infrastructure. Its lines are also disruptive to communities and marine life. And it requires more costly onshore grid upgrades.

Coordinated offshore transmission can avoid many of those costs with what the Department of Energy calls “meshed” or “backbone” designs.

Rather than individual connections to land, many offshore wind farms would be connected to a shared transmission line, which would connect to the onshore grid through strategically placed “points of interconnection.” This way, electricity produced by an offshore wind farm would be transmitted to where it is most needed, up and down the East Coast.

A map shows lease areas, from South Carolina to Massachusetts.
Several areas along the Atlantic continental shelf have been leased for wind power development.
U.S. Department of the Interior, 2024

Even better, electricity generated onshore could also be transmitted through these shared lines to move energy to where it is needed. This could improve the resilience of power grids and reduce the need for new transmission lines over land, which have been notoriously difficult to gain approval for, especially on the East Coast.

Coordinated offshore transmission was part of early U.S. discussions on offshore wind planning and development. In the late 2000s when Google and partners first proposed the Atlantic Wind Connection, an offshore transmission project, the benefits in both offshore renewables and the entire energy system were intriguing. At the time, the U.S. had just one utility-scale offshore wind project in the pipeline, and it ultimately failed.

Today, the U.S. has 53 GW of offshore wind projects being planned or developed. As energy researchers, we believe coordinated offshore transmission is important for the industry to succeed at scale.

Offshore grid could save money, reduce impacts

By enabling power from offshore wind farms and onshore electricity generators to travel to more places, coordinated transmission can enhance grid reliability and enable electricity to get to where it is most needed. This reduces the need for more expensive and often more polluting power plants.

A 2024 report from the National Renewable Energy Lab found the benefits of a coordinated design are nearly three times higher than the costs when compared with a standard point-to-point design.

Studies from Europe, the U.K. and Brattle have pointed to additional benefits, including reducing planet-warming carbon emissions, cutting the number of beach crossings by a third and reducing the miles of transmission cables needed by 35% to 60%.

Three maps show how a backbone design connects systems all along the coast and requires fewer wind farm-to-land connections.
Three transmission designs show the difference between intraregional systems with several land connections and interregional and backbone designs. These three were investigated by the National Renewable Energy Lab in the Atlantic Offshore Wind Transmission Study.
Illustrations by Billy Roberts, NREL

In the U.S., offshore transmission lines would be almost entirely in federal waters, potentially avoiding many of the conflicts associated with onshore projects, though it would still face challenges.

Challenges and next steps

Building an offshore grid will require some important changes.

First is changing government incentives. The federal investment tax credit for offshore wind, which covers at least 30% of the upfront capital cost of a project, does not currently help pay for coordinated transmission designs.

Second, planning needs to take everyone’s concerns into account from the beginning. While the overall benefits of coordinated transmission designs outweigh overall costs, who receives the benefits and who bears the costs matters. For example, more expensive power generators could earn less, and some communities feel threatened by offshore development.

Third, greater coordination will be needed among everyone involved to dispatch power to and from the regional grids. The Federal Energy Regulatory Commission’s recent Order 1920, requiring power providers to plan for future needs, may serve as a blueprint, but it does not apply to interregional projects, such as an offshore transmission backbone connecting over a dozen states across three regions.

A pier with cranes and huge wind turbine blades, seen from the water
Several New England states are seeing economic growth from the offshore wind industry. Here, blades are prepared for shipping at a pier in New London, Conn.
Elizabeth J. Wilson, CC BY-ND

The U.S. reached an important milestone in March 2024 with the completion of South Fork Wind, the country’s first utility-scale wind farm, bringing U.S. offshore wind power capacity to nearly 200 megawatts. Eight more projects are under construction or approved for construction. Once built, they would bring installed capacity to over 13 gigawatts, roughly the same as three dozen coal-fired power plants.

An offshore transmission backbone could support offshore wind development and the East Coast’s energy needs for generations to come.

This article was updated July 31, 2024, to clarify that the states formalized the memorandum of understanding.The Conversation

About the Authors:

Tyler Hansen, Research Associate in Environmental Studies, Dartmouth College; Abraham Silverman, Research Scholar, Ralph O’Connor Sustainable Energy Institute, Johns Hopkins University; Elizabeth J. Wilson, Professor of Environmental Studies, Dartmouth College, and Erin Baker, Professor of Industrial Engineering Applied to Energy Policy, UMass Amherst

This article is republished from The Conversation under a Creative Commons license. Read the original article.

What is mpox? A microbiologist explains what’s known about this smallpox cousin

By Rodney E. Rohde, Texas State University 

On Aug. 14, 2024, the World Health Organization declared mpox a public health emergency of international concern. There have been over 15,600 cases and over 530 deaths reported in the Democratic Republic of the Congo and neighboring countries in Africa. The disease had previously caused a global outbreak from 2022 to 2023.

Mpox – previously called monkeypox – isn’t a new disease. The first confirmed human case was in 1970, when the virus was isolated from a child suspected of having smallpox in the Democratic Republic of Congo (DRC). Though usually mild, mpox can still potentially cause severe illness. Health officials are concerned that more cases will arise with increased travel.

I’m a researcher who has worked in public health and medical laboratories for over three decades, especially in the realm of diseases with animal origins. What exactly is happening in the current outbreak, and what does history tell us about mpox?

A cousin of smallpox

Mpox is caused by the monkeypox virus, which belongs to a subset of the Poxviridae family of viruses called Orthopoxvirus. This subset includes the smallpox, vaccinia and cowpox viruses. While an animal reservoir for monkeypox virus is unknown, African rodents are suspected to play a part in transmission. The monkeypox virus has only been isolated twice from an animal in nature. Diagnostic testing for mpox is currently only available at Laboratory Response Network labs in the U.S. and globally.

The name “monkeypox” comes from the first documented cases of the illness in animals in 1958, when two outbreaks occurred in monkeys kept for research. However, the virus did not jump from monkeys to humans, nor are monkeys major carriers of the disease.

Electron microscope view of monkeypox virus, showing oval-shaped, mature virus particles and spherical, immature virions
The virus that causes mpox belongs to the Poxviridae family of viruses, which includes smallpox.
CDC/ Cynthia S. Goldsmith

Epidemiology

Since the first reported human case, mpox has been found in several other central and western African countries, with the majority of infections in the DRC. Cases outside of Africa have been linked to international travel or imported animals, including in the U.S. and elsewhere.

The first reported cases of mpox in the U.S. was in 2003, from an outbreak in Texas linked to a shipment of animals from Ghana. There were also travel-associated cases in July and November 2021 in Maryland. The outbreak of mpox that began May 2022 is ongoing.

Because mpox is closely related to smallpox, the smallpox vaccine can provide protection against infection from both viruses. Since smallpox was officially eradicated, however, routine smallpox vaccinations for the U.S. general population were stopped in 1972. Because of this, mpox has been appearing increasingly in unvaccinated people.

Transmission

The virus can be transmitted through contact with an infected person or animal or contaminated surfaces. Typically, the virus enters the body through broken skin, inhalation or the mucous membranes in the eyes, nose or mouth. Researchers believe that human-to-human transmission is mostly through inhalation of large respiratory droplets rather than direct contact with bodily fluids or indirect contact through clothes.

Health officials are worried that the virus may currently be spreading undetected through community transmission, possibly through a new mechanism or route. Where and how infections are occurring are still under investigation.

Signs and symptoms

After the virus enters the body, it starts to replicate and spread through the body via the bloodstream. Symptoms usually don’t appear until one to two weeks after infection.

Mpox produces smallpox-like skin lesions, but symptoms are usually milder than those of smallpox. Flu-like symptoms are common initially, ranging from fever and headache to shortness of breath. One to 10 days later, a rash can appear on the extremities, head or torso that eventually turns into blisters filled with pus. Overall, symptoms usually last two to four weeks, while skin lesions usually scab over in 14 to 21 days.

While mpox is rare and usually nonfatal, one version of the disease kills around 10% of infected people. The form of the virus currently circulating is thought to be milder, with a fatality rate of less than 1%.

Vaccines and treatments

Treatment for mpox is primarily focused on relieving symptoms. According to the Centers for Disease Control and Prevention, no treatments are available to cure mpox infection.

Because smallpox is closely related to mpox, the smallpox vaccine can protect against both diseases.

Evidence suggests that the smallpox vaccine can help prevent mpox infections and decrease the severity of the symptoms. One vaccine known as Imvamune or Imvanex is licensed in the U.S. to prevent mpox and smallpox.

Vaccination after exposure to the virus may also help decrease chances of severe illness. The CDC currently recommends smallpox vaccination only in people who have been or are likely to be exposed to mpox. Immunocompromised people are at high risk.

This is an updated version of an article originally published on May 20, 2022.The Conversation

About the Author:

Rodney E. Rohde, Regents’ Professor & Chair, Medical Laboratory Science, Texas State University

This article is republished from The Conversation under a Creative Commons license. Read the original article.

The German DAX Index has risen for 8 consecutive sessions. Malaysia’s GDP shows strong growth

By JustMarkets

On Thursday, the Dow Jones (US30) Index gained 1.61%, while the S&P 500 (US500) Index closed 1.39% higher. The NASDAQ Technology Index (US100) closed yesterday positive 2.34%. Signs of a strengthening US economy are driving stocks higher today after July retail sales posted the largest increase in a year, and weekly initial jobless claims unexpectedly fell to a 5-week low. The strong reports bolstered the projection for a soft economic landing.

The US weekly initial jobless claims unexpectedly fell by 7,000 to a 5-week low of 227,000, indicating a strengthening labor market versus expectations of a rise to 235,000. US retail sales for July rose 1.0% m/m, exceeding expectations of 0.4% m/m and the largest increase in a year and a half. Atlanta Fed President Bostic said he is “open” to an interest rate cut in September. The Fed cannot “afford to be late” in easing monetary policy amid signs of cooling in the labor market. St. Louis Fed President Musalem said that from his perspective, “the risk to both sides of the Fed’s mandate seems more balanced. Accordingly, the time is approaching when an adjustment to the moderately restrictive policy may be appropriate ahead of future meetings.” Markets rate the odds of a 25 bps rate cut at the September 17–18 FOMC meeting at 100% and a -50 bps rate cut at this meeting at 28%.

Walmart (WMT) is up more than 6% after reporting a second-quarter revenue of $169.34 billion, which is better than the consensus estimate of $168.46 billion, and it is raising its net sales prognosis. Cisco Systems (CSCO) rose more than 8%, leading gains in the Dow Jones Industrials and Nasdaq 100 stocks after the company reported fourth-quarter revenue of $13.64 billion, better than the consensus of $13.53 billion, and projection of above-average earnings.

Equity markets in Europe were mostly up on Thursday. Germany’s DAX (DE40) rose by 1.66%, France’s CAC 40 (FR40) closed 1.23% higher, Spain’s IBEX 35 (ES35) added 1.23%, and the UK’s FTSE 100 (UK100) closed up 0.80%.

Germany’s DAX (DE40) Index has risen for 8 consecutive sessions, and it has nearly reversed losses from the global equity sell-off that ended last week. Financial stocks took center stage, with Deutsche Bank and Commerzbank adding between 2.9% and 3.3%. Finally, Mercedes, Porsche, BMW, and Volkswagen continued yesterday’s gains, although Siemens and Airbus were in slightly negative territory. Meanwhile, the UK economy slowed slightly in Q2 and stalled in June, which was in line with prognoses, but business investment unexpectedly contracted.

WTI crude oil prices rose 1.5% to $78.16 a barrel on Thursday, rebounding from two days of losses as recession fears eased. There were also fears of possible Iranian retaliation against Israel following reports that Hamas is unlikely to take part in new ceasefire talks in Gaza. However, gains were halted by lingering demand concerns, with EIA data showing an unexpected rise in US crude inventories, which increased by 1.357 million barrels last week, ending a six-week decline and contrary to expectations of a 2 million barrel drop.

The US natural gas (XNG/USD) prices hit a one-month high of $2.28 per MMBtu in August as declining domestic supply coincided with expectations of strong cooling demand. The latest EIA data showed that US utilities withdrew 6 billion cubic feet of natural gas in the week ended August 9, despite a seasonal upward trend, marking the first August decline since 2006 and contrasting with market expectations of a 43 billion cubic feet increase. Lower production is expected to support prices, making them more sensitive to any supply disruptions or additional warming.

Asian markets also had the advantage of rising yesterday. Japan’s Nikkei 225 (JP225) rose by 0.78%, China’s FTSE China A50 (CHA50) added 1.10% Hong Kong’s Hang Seng (HK50) was down 0.02%, while Australia’s ASX 200 (AU200) was positive 0.19%.

The Bank of Japan (BoJ) will take a more cautious approach to raising interest rates after the recent turmoil in global markets to avoid a rapid appreciation of the yen, BMI said in a recent note. BMI strategists said the Bank of Japan will take a more cautious approach and will only raise rates by 25 bps to 0.50% this year, down from our previous estimate of 50 bps.

Malaysia’s economy grew by 5.9% y/y in Q2 2024, compared to preliminary growth of 5.8% and 4.2% growth in Q1. This was the highest GDP growth since Q4 2022 on the back of strong output across all sectors. Activity in services accelerated (5.9% vs. 4.8% in Q1), helped by wholesale and retail trade. Production in the manufacturing industry also increased (4.7% vs. 1.9%) due to non-metallic minerals, basic metals, and products thereof, as well as petroleum, chemical, rubber, and plastics industries.

S&P 500 (US500) 5,543.23 +88.02 (+1.61%)

Dow Jones (US30) 40,563.58 +555.19 (+1.39%)

DAX (DE40) 18,183.24 +297.64 (+1.66%)

FTSE 100 (UK100) 8,347.35 +66.30 (+0.80%)

USD index 103.00 +0.44 (+0.43%)

Important events for today:
  • – New Zealand Producer Price Index (q/q) at 01:45 (GMT+3);
  • – Australia RBA Gov Bullock Speaks at 02:30 (GMT+3);
  • – New Zealand RBNZ Gov Orr Speaks at 05:30 (GMT+3);
  • – UK Retail Sales (m/m) at 09:00 (GMT+3);
  • – Eurozone Trade Balance (m/m) at 12:00 (GMT+3);
  • – US Building Permits (m/m) at 15:30 (GMT+3);
  • – US Michigan Consumer Sentiment (m/m) at 17:00 (GMT+3).

By JustMarkets


This article reflects a personal opinion and should not be interpreted as an investment advice, and/or offer, and/or a persistent request for carrying out financial transactions, and/or a guarantee, and/or a forecast of future events.

AUD/USD climbs as RBA maintains firm stance on interest rates

By RoboForex Analytical Department

The Australian dollar (AUD) is witnessing a rise against the US dollar (USD) for the second consecutive day, reaching 0.6629. This upward movement is bolstered by the Reserve Bank of Australia’s (RBA) current policy stance. RBA Governor Michelle Bullock emphasized today that discussions on interest rate cuts are premature despite some easing in inflationary pressures.

Inflation, according to Governor Bullock, remains uncomfortably high, with expectations for it to settle within the target range of 2-3% only towards the end of next year. This viewpoint underpinned the RBA’s decision last week to maintain the official cash rate at 4.35%, marking the sixth consecutive hold. The RBA cites ongoing economic stability and persistent inflation risks as key reasons for their cautious approach.

This stance starkly contrasts with other major central banks, including the Reserve Bank of New Zealand (RBNZ), which have been more open to adjusting rates. However, the RBA’s consistent and factual communication strategy has minimized speculative market reactions, contributing to a more stable forex forecast for the AUD.

Technical analysis of AUD/USD

The AUD/USD pair has reached a peak at 0.6640 and is now showing signs of consolidating below this level. Should the pair break downwards from this consolidation, a decline to 0.6450 could be anticipated. Following this potential drop, a rebound to 0.6545 for a retest from below might occur before a further descent towards 0.6200. This bearish outlook is supported by the MACD indicator, which shows the signal line retreating from highs and gearing towards a downturn.

On the hourly chart, after a decline to 0.6555, the AUD/USD pair corrected upwards to 0.6628. A consolidation below this level is expected, which could lead to a new downward wave aiming for 0.6540. This bearish prediction aligns with the Stochastic oscillator readings, where the signal line is poised to move from above 80 downwards to 20, indicating potential selling pressure ahead.


Disclaimer

Any forecasts contained herein are based on the author’s particular opinion. This analysis may not be treated as trading advice. RoboForex bears no responsibility for trading results based on trading recommendations and reviews contained herein.

Week Ahead: NAS100 set for Jackson Hole shake up?

By ForexTime 

  • NAS100 ↑ 13% from August low
  • Friday speech by Fed Powell to impact Fed cut bets
  • Watch out for FOMC minutes mid-week
  • Index trading roughly 7% away from all-time high
  • Key levels – 18400, 19500, 20100

It’s that time of the year again with the annual Jackson Hole Economic Symposium around the corner…

But before we discuss the importance of this event, here is a breakdown of the data releases and events scheduled for the upcoming week:

Monday, 19th Aug

  • JP225: Japan core machine orders
  • US500: US Conference Board leading index
  • US Democrat National Convention

Tuesday, 20th Aug

  • CN50: China loan prime rates
  • CAD: Canada CPI
  • SEK: Swedish rate decision
  • EU50: Eurozone CPI
  • TWN: Taiwan export orders

Wednesday 21st Aug

  • JP225: Japan trade
  • ZAR: South Africa CPI
  • NAS100: US FOMC minutes

Thursday, 22nd Aug

  • EU50: Eurozone & Germany PMI, consumer confidence
  • TWN: Taiwan jobless rate
  • UK100: UK S&P global PMI
  • US500: US initial jobless claims, S&P Global PMI

Friday, 23rd Aug

  • CAD: Canada retail sales
  • JP225: Japan CPI
  • SG20: Singapore CPI
  • TWN: Taiwan industrial production
  • NAS100: Fed Chair Powell speech at Jackson Hole


What is the Jackson Hole Economic Symposium?

It’s an annual event organised by the Kansas City Fed in Jackson Hole, Wyoming. This year it will be held from August 22nd – August 24th. 

Attendees from central bankers, finance ministers and economists congregate to discuss pressing global economic issues.

Why is it such a big deal?

Anything discussed during the symposium could trigger market volatility, especially if it has to do with monetary policy.

A trip down memory lane…

  • In August 2022, Jerome Powell’s speech at the Jackson Hole symposium was firmly hawkish as he outlined plans to combat inflation. This triggered a selloff on the S&P500, resulting in a 4% decline for the week.
  • Last year, Powell maintained a hawkish tilt by stating that the Fed was prepared to raise rates further if needed – citing high inflation.

What to expect this year?

It’s been a wild week for US markets with recent data soothing recession fears.

Still, Fed Chair Powell is expected to signal that a September rate cut is in the bag. But with the August jobs and inflation report published before the Fed’s September meeting, the size of the cut may remain a mystery.

Traders have currently fully priced in a 25-basis point Fed cut in September, with the probability of a 50-basis point cut at 33%.

NAS100 under the spotlight

There are a handful of assets that could rocked by Powell’s speech, but FXTM’s NAS100 has caught our attention due to its sensitivity to US interest rates.

NAS100 - W1

Note: FXTM’s NAS100 tracks the underlying benchmark Nasdaq 100 index.

It has been somewhat of a rollercoaster month for the index thanks to shifting monetary policy expectations and risk appetite.

Despite the flat month-to-date gains, prices have rallied 13% from Augusts low of 17247. Bulls seem to be back in action with the index knocking on the 19500 resistances as of writing.

  • FXTM’s NAS100 index could push higher if Powell strikes a dovish tone and signals that US rates will be cut in September.
  • Should Powell sound less dovish than expected and provide no fresh insight into the Feds thinking, this could weigh on the NAS100.

Keep eye on the FOMC minutes

Before Powell’s big speech on Friday, the FOMC minutes mid-week may provide some insight into the Feds thinking for the rest of 2024. Should the minutes come across as dovish, this could provide support to the NAS100.

Technical forces

Prices are turning bullish on the daily charts with the NAS100 challenging the 19500-resistance level. The candlesticks are firmly above the 100 and 200-day SMA but the Relative Strength Indicator (RSI) is slowly approaching overbought territory.

  • A solid weekly close above 19500 may encourage an incline toward 20100 and the all-time high at 20796.
  • Should 19500 prove to be reliable resistance, this could trigger a decline to 18400, the 200-day SMA and 17247.

nas100 -d1


Forex-Time-LogoArticle by ForexTime

ForexTime Ltd (FXTM) is an award winning international online forex broker regulated by CySEC 185/12 www.forextime.com

AI supercharges data center energy use – straining the grid and slowing sustainability efforts

By Ayse Coskun, Boston University 

The artificial intelligence boom has had such a profound effect on big tech companies that their energy consumption, and with it their carbon emissions, have surged.

The spectacular success of large language models such as ChatGPT has helped fuel this growth in energy demand. At 2.9 watt-hours per ChatGPT request, AI queries require about 10 times the electricity of traditional Google queries, according to the Electric Power Research Institute, a nonprofit research firm. Emerging AI capabilities such as audio and video generation are likely to add to this energy demand.

The energy needs of AI are shifting the calculus of energy companies. They’re now exploring previously untenable options, such as restarting a nuclear reactor at the Three Mile Island power plant, site of the infamous disaster in 1979, that has been dormant since 2019.

Data centers have had continuous growth for decades, but the magnitude of growth in the still-young era of large language models has been exceptional. AI requires a lot more computational and data storage resources than the pre-AI rate of data center growth could provide.

AI and the grid

Thanks to AI, the electrical grid – in many places already near its capacity or prone to stability challenges – is experiencing more pressure than before. There is also a substantial lag between computing growth and grid growth. Data centers take one to two years to build, while adding new power to the grid requires over four years.

As a recent report from the Electric Power Research Institute lays out, just 15 states contain 80% of the data centers in the U.S.. Some states – such as Virginia, home to Data Center Alley – astonishingly have over 25% of their electricity consumed by data centers. There are similar trends of clustered data center growth in other parts of the world. For example, Ireland has become a data center nation.

AI is having a big impact on the electrical grid and, potentially, the climate.

Along with the need to add more power generation to sustain this growth, nearly all countries have decarbonization goals. This means they are striving to integrate more renewable energy sources into the grid. Renewables such as wind and solar are intermittent: The wind doesn’t always blow and the sun doesn’t always shine. The dearth of cheap, green and scalable energy storage means the grid faces an even bigger problem matching supply with demand.

Additional challenges to data center growth include increasing use of water cooling for efficiency, which strains limited fresh water sources. As a result, some communities are pushing back against new data center investments.

Better tech

There are several ways the industry is addressing this energy crisis. First, computing hardware has gotten substantially more energy efficient over the years in terms of the operations executed per watt consumed. Data centers’ power use efficiency, a metric that shows the ratio of power consumed for computing versus for cooling and other infrastructure, has been reduced to 1.5 on average, and even to an impressive 1.2 in advanced facilities. New data centers have more efficient cooling by using water cooling and external cool air when it’s available.

Unfortunately, efficiency alone is not going to solve the sustainability problem. In fact, Jevons paradox points to how efficiency may result in an increase of energy consumption in the longer run. In addition, hardware efficiency gains have slowed down substantially, as the industry has hit the limits of chip technology scaling.

To continue improving efficiency, researchers are designing specialized hardware such as accelerators, new integration technologies such as 3D chips, and new chip cooling techniques.

Similarly, researchers are increasingly studying and developing data center cooling technologies. The Electric Power Research Institute report endorses new cooling methods, such as air-assisted liquid cooling and immersion cooling. While liquid cooling has already made its way into data centers, only a few new data centers have implemented the still-in-development immersion cooling.

Flexible future

A new way of building AI data centers is flexible computing, where the key idea is to compute more when electricity is cheaper, more available and greener, and less when it’s more expensive, scarce and polluting.

Data center operators can convert their facilities to be a flexible load on the grid. Academia and industry have provided early examples of data center demand response, where data centers regulate their power depending on power grid needs. For example, they can schedule certain computing tasks for off-peak hours.

Implementing broader and larger scale flexibility in power consumption requires innovation in hardware, software and grid-data center coordination. Especially for AI, there is much room to develop new strategies to tune data centers’ computational loads and therefore energy consumption. For example, data centers can scale back accuracy to reduce workloads when training AI models.

Realizing this vision requires better modeling and forecasting. Data centers can try to better understand and predict their loads and conditions. It’s also important to predict the grid load and growth.

The Electric Power Research Institute’s load forecasting initiative involves activities to help with grid planning and operations. Comprehensive monitoring and intelligent analytics – possibly relying on AI – for both data centers and the grid are essential for accurate forecasting.

On the edge

The U.S. is at a critical juncture with the explosive growth of AI. It is immensely difficult to integrate hundreds of megawatts of electricity demand into already strained grids. It might be time to rethink how the industry builds data centers.

One possibility is to sustainably build more edge data centers – smaller, widely distributed facilities – to bring computing to local communities. Edge data centers can also reliably add computing power to dense, urban regions without further stressing the grid. While these smaller centers currently make up 10% of data centers in the U.S., analysts project the market for smaller-scale edge data centers to grow by over 20% in the next five years.

Along with converting data centers into flexible and controllable loads, innovating in the edge data center space may make AI’s energy demands much more sustainable.

This article has been updated to correct an editing error about the date Three Mile Island’s Unit 1 nuclear reactor was shut down.The Conversation

About the Author:

Ayse Coskun, Professor of Electrical and Computer Engineering, Boston University

This article is republished from The Conversation under a Creative Commons license. Read the original article.

Copper Is in a Full Bear Market

Source: Michael Ballanger (8/14/24)

Even though copper prices bottomed on Thursday, Michael Ballanger of GGM Advisory Inc. still thinks Freeport-McMoRan Inc. (FCX:NYSE) is a Buy. 

Freeport-McMoRan Inc. (FCX:NYSE)

Copper prices bottomed on Thursday, August 8, right before the Sunday-Monday crash in the Nikkei and subsequent policy reversal by BoJ Deputy Governor Uchida, so any rallies from here, given the 25% pullback off the May 20 top at $5.199/lb., are going to be seen as bear market rallies.

Nevertheless, you can make a lot of money if you time these rallies properly, with the ideal strategy being ownership of the top copper producer in the world, which is Freeport-McMoRan Inc. (FCX:NYSE).

Copper is now in a full-on bear market rally that could possibly tack on another $0.40/lb. from the current $4.03/lb. level at which it now stands, but what is critical is the MACD and MFI indicators where “buy signals” have just been triggered. MFI is coming off a deeply oversold condition, so the rebound looks to be fairly strong.

FCX is coming out of an oversold RSI reading (sub 30) that usually signals an impending turn, and both MACD and the MFI will show “buy signals” by tomorrow’s opening. First stop for FCX is the 200-dma at $43.62 followed by the 50-dma at $47.27 and 100-dma at $48.70.

As for the call options, although the November $ 40’s are more money, the breakeven for these is $45.70 for FCX, while the breakeven for the November $45 calls is $$47.36. There is certainly better leverage in the 45’s if we see a new high above $55.235, but that assumes that copper and FCX move into “bull market resumes” mode, which is entirely possible, but I prefer the more conservative “bear market rally” strategy and a retest of the 50-dma and 100-dma levels that will take the $40’s to between $7.27 and $8.70.

The other possible course of action is to go farther out along the time axis and buy the March $45’s for $4.30. That would give copper price four additional months to recover the momentum that carried it to all-time highs in May.

Also, since FCX is also a significant gold producer through ownership of the Grasberg Mine in Indonesia, it is noteworthy that gold has closed for a couple of days now above $2,500. If gold is about to embark on the next leg to $2,750-$2,800, this provides another impetus for adding to (or initiating) this trade. Ione way or another, FCX is just about to trigger a MACD crossover and “buy signal,” and that should take it up and through the 200-dma at $43.62 very quickly.

In the GGMS 2024 Trading Account

  • Add 50 contracts FCX November $40 at $4.70

New ACB for this position is now $4.15. New cash on hand in that account is US$272,227 or 27.1%. First target is 200-dma at $43.62 for the stock and $7.00 for the calls. I will reassess once those levels are achieved.

I remain a bull on copper for a short-term trade and a long-term bull on gold.


Important Disclosures:

  1. Michael Ballanger: I, or members of my immediate household or family, own securities of: Freeport-McMoRan Inc. I determined which companies would be included in this article based on my research and understanding of the sector.
  2. Statements and opinions expressed are the opinions of the author and not of Streetwise Reports, Street Smart, or their officers. The author is wholly responsible for the accuracy of the statements. Streetwise Reports was not paid by the author to publish or syndicate this article. Streetwise Reports requires contributing authors to disclose any shareholdings in, or economic relationships with, companies that they write about. Any disclosures from the author can be found  below. Streetwise Reports relies upon the authors to accurately provide this information and Streetwise Reports has no means of verifying its accuracy.
  3.  This article does not constitute investment advice and is not a solicitation for any investment. Streetwise Reports does not render general or specific investment advice and the information on Streetwise Reports should not be considered a recommendation to buy or sell any security. Each reader is encouraged to consult with his or her personal financial adviser and perform their own comprehensive investment research. By opening this page, each reader accepts and agrees to Streetwise Reports’ terms of use and full legal disclaimer. Streetwise Reports does not endorse or recommend the business, products, services or securities of any company.

For additional disclosures, please click here.

Michael Ballanger Disclosures

This letter makes no guarantee or warranty on the accuracy or completeness of the data provided. Nothing contained herein is intended or shall be deemed to be investment advice, implied or otherwise. This letter represents my views and replicates trades that I am making but nothing more than that. Always consult your registered advisor to assist you with your investments. I accept no liability for any loss arising from the use of the data contained on this letter. Options and junior mining stocks contain a high level of risk that may result in the loss of part or all invested capital and therefore are suitable for experienced and professional investors and traders only. One should be familiar with the risks involved in junior mining and options trading and we recommend consulting a financial adviser if you feel you do not understand the risks involved.

Philly schools are in disrepair − the municipal bond market is 1 big reason

By David I. Backer, West Chester University of Pennsylvania 

Graphic reading '43 cents is the share of every dollar loaned to repair Philly schools that is actually spent'
The Conversation, CC BY

Many of Philadelphia’s schools are in terrible shape. The average public school building in the city is over 70 years old, and some are over 120 years old. The state of disrepair, including a lack of air conditioning and incidents of untreated asbestos, mold, crumbling ceilings and flooded hallways, is well documented.

I am a scholar of school finance, with an emphasis on infrastructure. My colleague Camika Royal, who’s an expert on urban education and Philadelphia schools, and I wanted to figure out why the city’s school buildings are like this.

We found that one key figure explains the dire state of the city’s school buildings: Only 43 cents of every dollar loaned to the School District of Philadelphia in recent decades to maintain and repair its buildings was actually spent.

In other words, a majority of the money – the other 57 cents per dollar – meant for building and maintaining Philly schools during the nearly 30-year period we studied, from 1993 to 2021, never actually reached Philly schools.

This is not due to money going missing. Rather, it is an indicator of the overall inefficiency of how maintenance and repairs to Philly’s public school facilities are financed.

Our analysis was published in the June 2024 edition of the peer-reviewed Journal of Educational Administration and History.

Reliance on Wall Street

Pennsylvania, unlike states such as Massachusetts and Wyoming that have robust policies for financing school infrastructure, does not have a statewide program that provides sufficient revenue for school facilities.

The commonwealth’s PlanCon program, for instance, which had reimbursed districts for building costs, was defunded in the wake of the 2008 financial crisis. It hasn’t been fully restored.

While Gov. Josh Shapiro signed the Public School Facility Improvement Grant Program into law in 2024 to provide grants for school buildings statewide, the program – funded with US$100 million – is pitifully small. Philly’s school buildings alone need at least $7 billion for repairs and upgrades, according to Superintendent Tony Watlington.

To get the money it needs for its buildings and infrastructure, the School District of Philadelphia has to sell itself as an investment product on Wall Street. This is done through municipal bonds.

Municipal bonds are basically big loans for local governments’ capital projects.

Investors purchase these municipal bonds because they can make tax-free income when the school district pays them back with interest.

Financial consultants, credit raters, bond lawyers and private banks all benefit from this system as well, since they charge fees for the services helping investors front their money to school districts.

Market mayhem

The municipal bond market is subject to the erratic, competitive and unstable tendencies of Wall Street finance.

Imagine a rusty, outdated plumbing system that’s supposed to get water from a reservoir to a community. While the reservoir might have a lot of water in it, if the pipes are poorly designed and leaking, or the reservoir itself is badly maintained, much less water can get to the community than might be available. It could be that for every 100 gallons of water available, the community gets only 43 gallons.

Looking at the financial history of the school district’s relationship to the municipal bond market from 1993 to 2021, we found two main reasons for the failure of this funding model.

The first is the chaos in credit markets from 1993 to 2001.

In 1986, the Tax Reform Act regulated private banks, making it harder for them to buy and sell private activity bonds, and also taxed interest on certain bonds. This prompted many banks to pull out of that market, reducing their share of municipal debt by 15%. Credit supply went down, demand went up, and so did prices – making it more expensive for municipalities like Philadelphia to borrow.

Then, in 1987, the savings and loan crisis caused state budgets to contract nationally by 5%. This reduced Philadelphia School District revenue, making it more difficult to repay previous bonds while also necessitating further lending.

The second key reason relates to predatory investing strategies that lawmakers and the financial industry use to secure money for the district’s buildings.

After deregulating the kinds of bonds that local governments could sell in 2003, Pennsylvania took control of the Philadelphia School District’s finances. Under the leadership of former Superintendent Paul Vallas, the district used risky and predatory market instruments that ultimately led to a $330 million loss in the wake of the 2008 financial crisis.

Green New Deal for schools

An efficient policy for financing school infrastructure would yield a number closer to a dollar spent for every dollar received in loans. We conclude our paper with recommendations for policies we believe would be more efficient and just.

These include setting up a National Infrastructure Bank at the federal level that would provide appropriate loan financing for collective goods such as school infrastructure. Also, U.S. Rep. Jamaal Bowman of New York has proposed a Green New Deal for Schools that would provide more than $1 trillion in grants for social and physical infrastructure.The Conversation

About the Author:

David I. Backer, Associate Professor of Education Policy, West Chester University of Pennsylvania

This article is republished from The Conversation under a Creative Commons license. Read the original article.

Indices rise amid lower inflation in the US. Oil returned to decline due to reduced tension in the Middle East

By JustMarkets

At the end of Wednesday, the Dow Jones (US30) Index gained 0.61%, and the S&P 500 (US500) Index closed with an increase of 10.38%. The NASDAQ Technology Index (US100) closed yesterday positive 0.03%. Stocks found support on Wednesday after the US CPI report for July came in slightly weaker than expected, reinforcing the likelihood that the Fed will cut interest rates next month.

Wednesday’s US CPI report for July eased speculation that the Fed will cut rates by 50 bps next month instead of 25 bps. US CPI for July fell to 2.9% y/y from 3.0% y/y, slightly better than expectations of no change at 3.0% y/y and the lowest annualized growth in over three years. The July core CPI excluding food and energy, fell to 3.2% y/y from 3.3% y/y in June, matching expectations and the smallest annualized gain in over 3 years.

According to data compiled by Bloomberg, most of the companies that reported beat consensus on earnings, but only 43% beat revenue expectations, the lowest in five years.

Alphabet (GOOG) shares fell by 2.3% yesterday following a report that the US Department of Justice is considering options, including a possible company separation.

The Canadian dollar strengthened to 1.37 per US dollar, hitting a near one-month high, while the US dollar weakened to one-year lows after softer-than-expected inflation data. Meanwhile, Canada’s unemployment rate was unchanged at 6.4% in July, the highest in two and a half years, indicating a weakening labor market.

Equity markets in Europe were mostly up on Wednesday. Germany’s DAX (DE40) rose by 0.41%, France’s CAC 40 (FR40) closed higher by 0.79%, Spain’s IBEX 35 (ES35) added 0.27%, and the UK’s FTSE 100 (UK100) closed up 0.56%.

The FTSE 100 (UK100) Index rose 0.79% on Wednesday as UK Consumer Price Inflation for July rose less than expected, reinforcing expectations of a Bank of England rate cut. All sectors rose except for mining, which fell nearly 1% as sentiment weakened due to a larger-than-expected credit contraction in China.

WTI crude oil prices fell by 1.7%, marking a second straight day of losses following President Biden’s comments that Iran may not attack Israel if a ceasefire in Gaza is reached. A new round of ceasefire talks is due to begin Thursday in Qatar, but Hamas said the group does not intend to participate in the talks. Also, the EIA reported an unexpected rise in US crude inventories, with a 1.357 million barrel increase last week, ending a six-week decline and defeating expectations of a 2 million barrel drop.

The US natural gas prices (XNGUSD) rose more than 5% to $2.27/MMBtu on Wednesday, the highest in about a month, thanks to lower production and prognoses of hotter weather in late August. The hotter weather is expected to increase the use of air conditioners, boosting gas demand.

Asian markets traded flat yesterday. Japan’s Nikkei 225 (JP225) was up 0.58%, China’s FTSE China A50 (CHA50) was down 0.50%, Hong Kong’s Hang Seng (HK50) decreased by 0.35%, and Australia’s ASX 200 (AU200) was positive 0.31%.

The offshore yuan weakened to 7.16 per dollar, retreating from a one-week high, as traders reacted to mixed economic data from China. In the real estate sector, new home prices in 70 major cities fell 4.9 percent from a year earlier in July 2024, the sharpest decline since June 2015 and underscoring the deepening real estate crisis despite Beijing’s efforts to stabilize the sector. Industrial production also showed signs of weakness, with growth slowing to 5.1% in July from 5.3% in the previous month, the weakest since March. In addition, the unemployment rate rose to 5.2% in July after remaining at 5% for the previous three months. On a more positive note, retail sales rose, which increased at a 2.7% annualized rate in July, up from 2% in June, marking the 18th consecutive month of retail sales growth. Overall, the latest data paints a complex picture of China’s economic trajectory, heightening concerns and calling into question the strength of the country’s economic recovery.

The Australian dollar climbed above $0.66, resuming its recent rally as investors reacted to mixed reports on the country’s economy. A private survey showed that expectations for consumer inflation in Australia rose to 4.5% in August from 4.3% in July, the highest since April. Meanwhile, the country’s unemployment rate unexpectedly rose to 4.2% in July, the highest in two and a half years.

S&P 500 (US500) 5,455.21 +20.78 (+0.38%)

Dow Jones (US30) 40,008.39 +242.75 (+0.61%)

DAX (DE40) 17,885.60 +73.55 (+0.41%)

FTSE 100 (UK100) 8,281.05 +45.82 (+0.56%)

USD index 102.59 +0.03 (+0.03%)

Important events for today:
  • – Japan GDP (m/m) at 02:50 (GMT+3);
  • – Australia Unemployment Rate (m/m) at 04:30 (GMT+3);
  • – China Industrial Production (m/m) at 05:00 (GMT+3);
  • – China Unemployment Rate (m/m) at 05:00 (GMT+3);
  • – China Retail Sales (m/m) at 05:00 (GMT+3);
  • – Japan Industrial Production (m/m) at 07:30 (GMT+3);
  • – UK GDP (q/q) at 09:00 (GMT+3);
  • – UK Industrial Production (m/m) at 09:00 (GMT+3);
  • – UK Manufacturing Production (m/m) at 09:00 (GMT+3);
  • – UK Trade Balance (m/m) at 09:00 (GMT+3);
  • – Switzerland Producer Price Index (m/m) at 09:30 (GMT+3);
  • – Norwegian Norges Interest Rate Decision at 11:00 (GMT+3);
  • – Eurozone Account of Monetary Policy Meeting (m/m) at 14:30 (GMT+3);
  • – US Initial Jobless Claims (w/w) at 15:30 (GMT+3);
  • – US Retail Sales (m/m) at 15:30 (GMT+3);
  • – US Philadelphia Fed Manufacturing Index (m/m) at 15:30 (GMT+3);
  • – US NY Empire State Manufacturing Index (m/m) at 15:30 (GMT+3);
  • – US Industrial Production (m/m) at 16:15 (GMT+3);
  • – US Natural Gas Storage (w/w) at 17:30 (GMT+3);
  • – US FOMC Member Harker Speaks at 20:10 (GMT+3).

By JustMarkets


This article reflects a personal opinion and should not be interpreted as an investment advice, and/or offer, and/or a persistent request for carrying out financial transactions, and/or a guarantee, and/or a forecast of future events.

FXTM’s CHINAH: On breakout watch ahead of key events

By ForexTime 

  • Potential trading opportunities on horizon for CHINAH
  • Raft of China data, Alibaba & JD.com earnings on Thursday
  • CHINAH respecting bearish channel on D1 charts
  • Key levels of interest – 5965, 6100 & 6225

If you are seeking fresh market opportunities, then look no further…

FXTM’s CHINAH which tracks the underlying Hang Seng China Enterprise index is trading around key daily resistance ahead of tomorrow’s event-heavy trading session.

On Thursday, key economic data from China and earnings from two Chinese e-commerce giants could trigger significant price swings on the CHINAH index.

CHINAH

But before we discuss how to take advantage of this trading opportunity, here are some fun facts about the CHINAH index:

  • Gained roughly 4.5% year-to-date
  • Down 14.3% from its 2024 high at 7025  
  • Respecting bearish channel on D1 chart

The lowdown…

Chinese shares have been on the decline over the past few weeks as China growth fears weighed on sentiment. Since May, FXTM’s CHINAH has recorded two consecutive months of losses and currently down over 1% in August.

CHINAH W1

Here are 3 forces that may move the index on Thursday:

    1) China policy rate + key data

The People’s Bank of China (PBoc) is expected to maintain its one-year medium-term lending faculty (MLF) rate at 2.3%.

So much focus will be on the barrage of data release, including the industrial production, retail sales and jobless rate among other key reports. Ultimately, better-than-expected data could boost confidence over China’s economic outlook – stimulating appetite for riskier such as the CHINAH index. Should overall economic data disappoint, this may drag the stock index lower.


    2) Alibaba earnings

Alibaba accounts for almost 9% of CHINAH’s weighting – claiming the title of biggest stock within the index.

This alone suggests that its earnings release before US markets open on Thursday could translate to heightened volatility for the stock index. Markets are forecasting Alibaba’s US listed shares to move 5.7% either up or down when US markets on Thursday.

Much focus will be on any updates regarding its cloud and AI-related efforts. Should the Chinese e-commerce giant’s earnings exceed market expectations, this may push Alibaba shares higher along with the CHINAH index.


    3) JD.com earnings

It will be wise to also keep an eye on JD.com which accounts for just over 2% of CHINAH. Markets are forecasting JD.com US listed shares to move 6.4% either up or down when US markets open on Thursday, just hours after its earnings are announced.

Investors will direct their attention toward profitability and how its e-commerce business performed in Q2 amid the fierce competition among major players in China. A strong set of results may support JD.com stocks along with the CHINAH index, and vice versa.


Note: Watch out for the incoming US July CPI report released later today. This could be a huge risk event that rattles global financial markets and influences overall risk sentiment. Its impacts may be reflected on the CHINAH when China markets open on Thursday.


Technical forces…

The trend remains bearish on the daily charts as there have been consistently lower lows and lower highs. However, bulls seem to be lingering in the vicinity with prices trading near a key daily resistance at 6100.

  • A strong daily close above this level could encourage a move toward the 50-day SMA at 6255 and 6360.
  • Should 6100 prove to be reliable resistance, prices may slip to 5965 before retesting 5800.

CHINAH2


Forex-Time-LogoArticle by ForexTime

ForexTime Ltd (FXTM) is an award winning international online forex broker regulated by CySEC 185/12 www.forextime.com