By InvestMacro
Here are the latest charts and statistics for the Commitment of Traders (COT) data published by the Commodities Futures Trading Commission (CFTC).
The latest COT data is updated through Tuesday September 17th and shows a quick view of how large traders (for-profit speculators and commercial entities) were positioned in the futures markets.
Weekly Speculator Changes led by Gold, Silver & Platinum
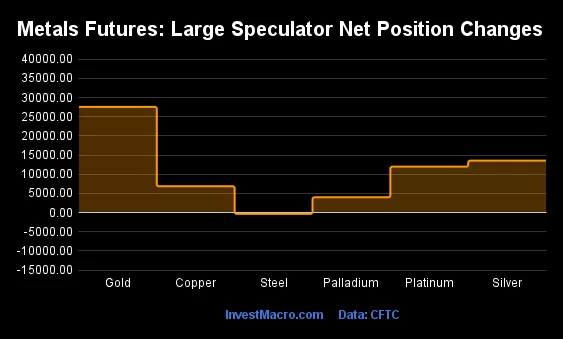
The COT metals markets speculator bets were higher this week as five out of the six metals markets we cover had higher positioning while the other one markets had lower speculator contracts.
Leading the gains for the metals was Gold (27,565 contracts) with Silver (13,556 contracts), Platinum (11,975 contracts), Copper (6,870 contracts) and with Palladium (3,988 contracts) also showing positive weeks.
The market with a decrease was Steel with a shortfall by -346 contracts on the week.
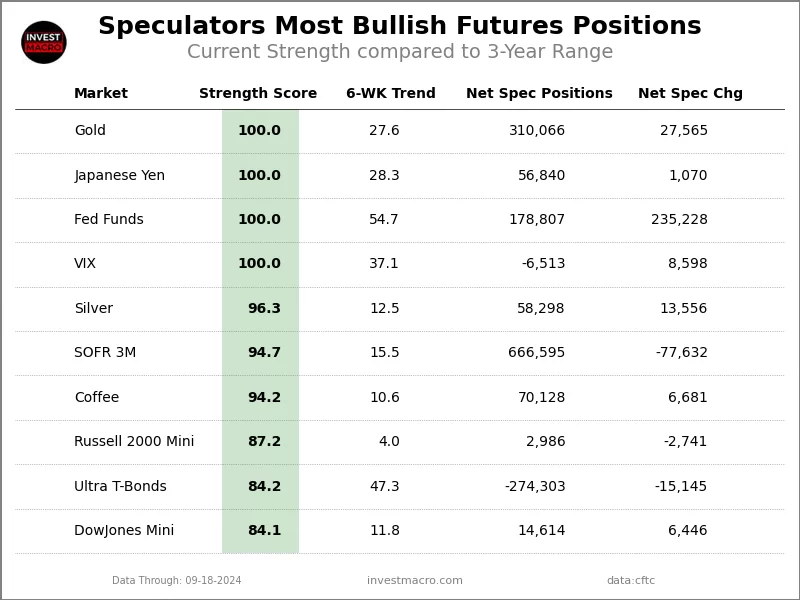
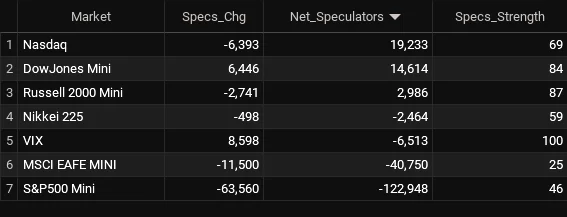
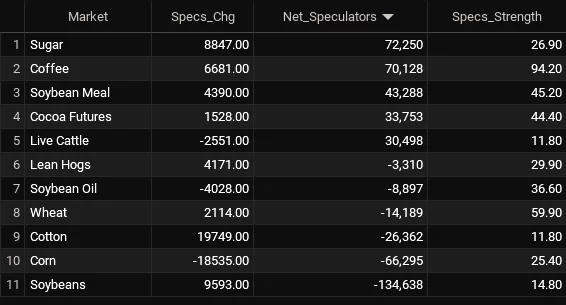
Metals Net Speculators Leaderboard
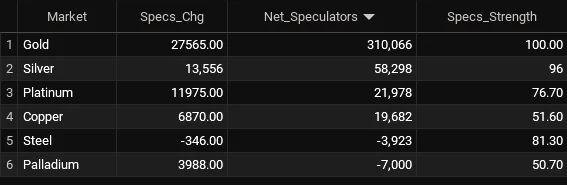
Legend: Weekly Speculators Change | Speculators Current Net Position | Speculators Strength Score compared to last 3-Years (0-100 range)
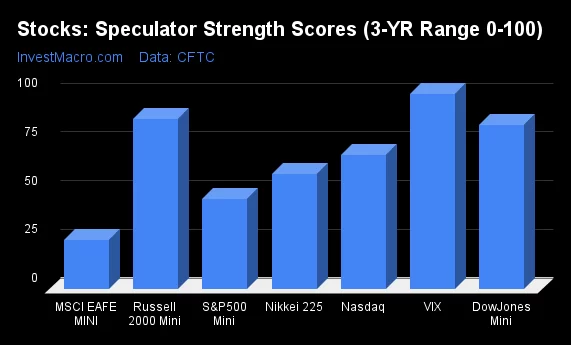
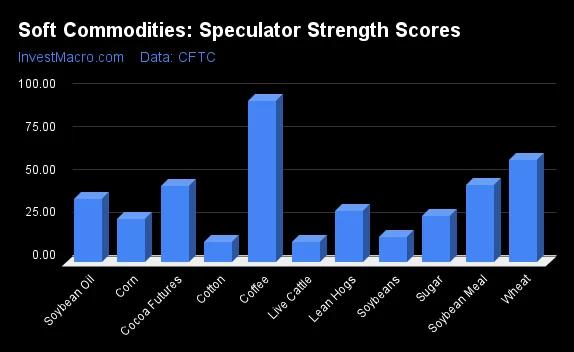
Strength Scores led by Gold & Silver
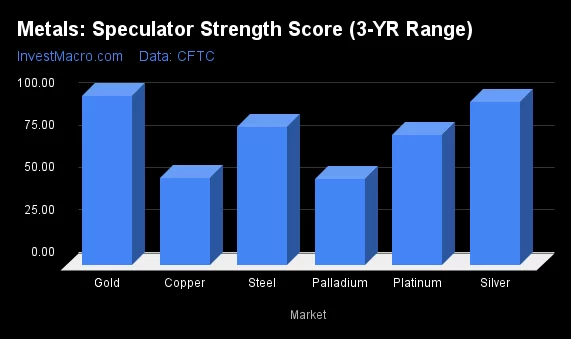
COT Strength Scores (a normalized measure of Speculator positions over a 3-Year range, from 0 to 100 where above 80 is Extreme-Bullish and below 20 is Extreme-Bearish) showed that Gold (100 percent) and Silver (96 percent) lead the metals markets this week. Steel (81 percent) comes in as the next highest in the weekly strength scores.
On the downside, Palladium (51 percent) comes in at the lowest strength level currently.
Strength Statistics:
Gold (100.0 percent) vs Gold previous week (89.3 percent)
Silver (96.3 percent) vs Silver previous week (77.9 percent)
Copper (51.6 percent) vs Copper previous week (45.2 percent)
Platinum (76.7 percent) vs Platinum previous week (44.7 percent)
Palladium (50.7 percent) vs Palladium previous week (21.4 percent)
Steel (81.3 percent) vs Palladium previous week (82.7 percent)
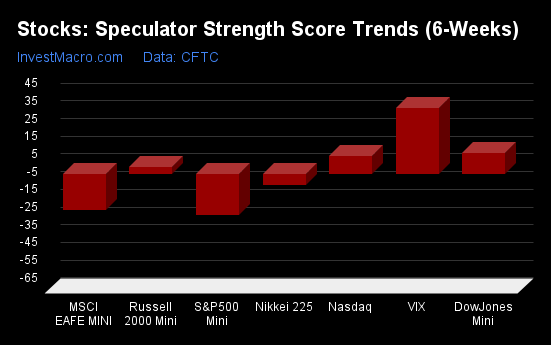
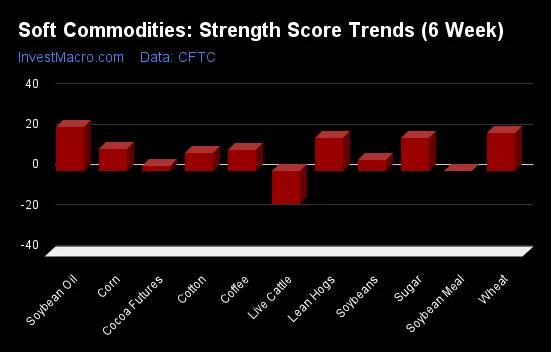
Palladium & Platinum top the 6-Week Strength Trends
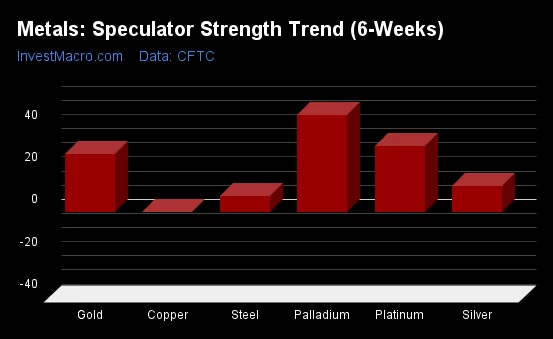
COT Strength Score Trends (or move index, calculates the 6-week changes in strength scores) showed that Palladium (46 percent) and Platinum (31 percent) lead the past six weeks trends for metals. Gold (28 percent) is the next highest positive mover in the latest trends data.
Copper (0 percent) is the lowest trend score currently.
Move Statistics:
Gold (27.6 percent) vs Gold previous week (13.9 percent)
Silver (12.5 percent) vs Silver previous week (-5.8 percent)
Copper (0.1 percent) vs Copper previous week (-10.9 percent)
Platinum (31.2 percent) vs Platinum previous week (-11.5 percent)
Palladium (45.8 percent) vs Palladium previous week (15.4 percent)
Steel (7.5 percent) vs Steel previous week (8.8 percent)
Individual Markets:
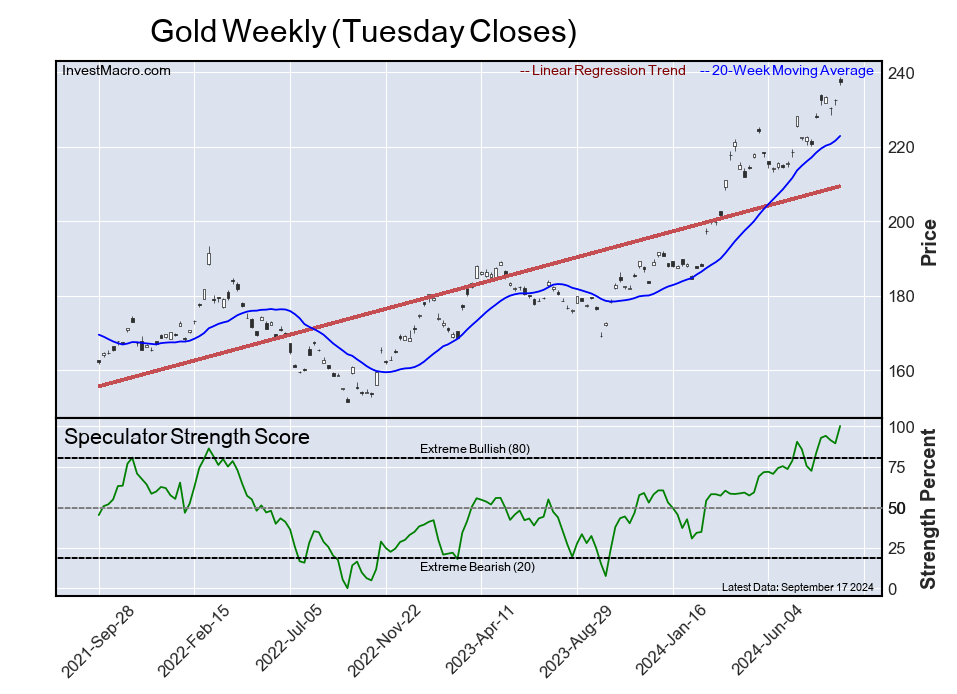
Gold Comex Futures:
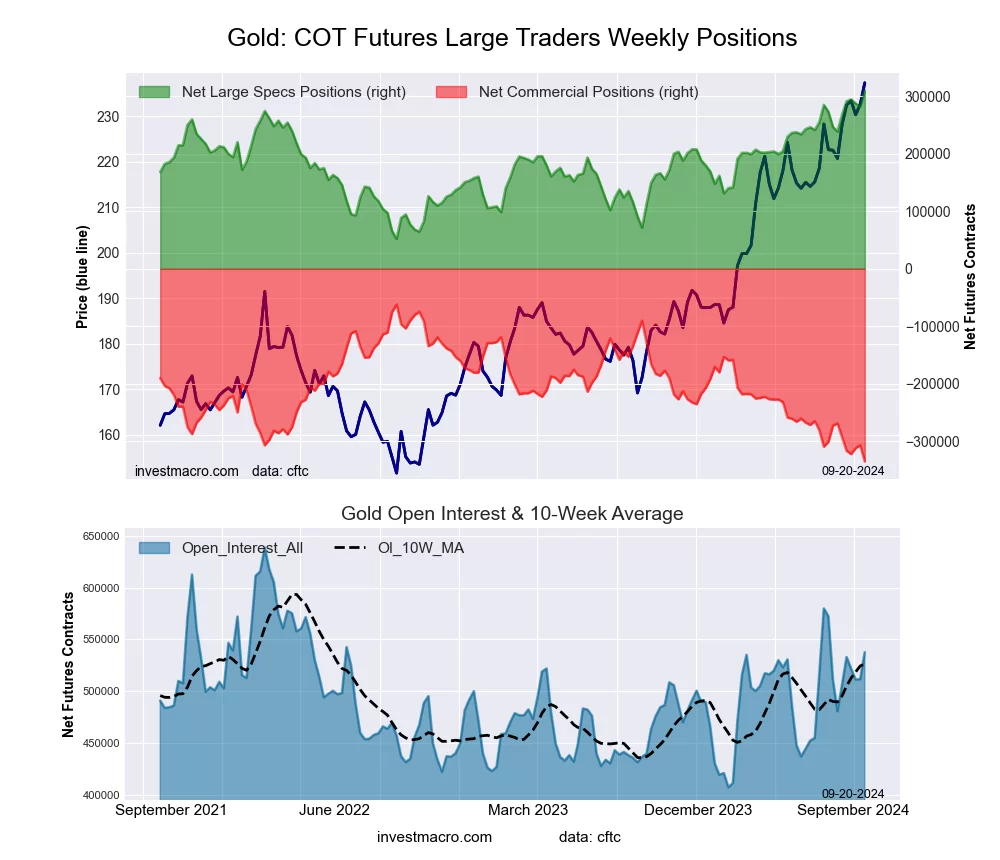 The Gold Comex Futures large speculator standing this week reached a net position of 310,066 contracts in the data reported through Tuesday. This was a weekly gain of 27,565 contracts from the previous week which had a total of 282,501 net contracts.
This week’s current strength score (the trader positioning range over the past three years, measured from 0 to 100) shows the speculators are currently Bullish-Extreme with a score of 100.0 percent. The commercials are Bearish-Extreme with a score of 0.0 percent and the small traders (not shown in chart) are Bullish with a score of 61.4 percent.
Price Trend-Following Model: Strong Uptrend
Our weekly trend-following model classifies the current market price position as: Strong Uptrend. The current action for the model is considered to be: Hold – Maintain Long Position.
| Gold Futures Statistics | SPECULATORS | COMMERCIALS | SMALL TRADERS |
| – Percent of Open Interest Longs: | 68.8 | 13.9 | 9.9 |
| – Percent of Open Interest Shorts: | 11.1 | 76.2 | 5.2 |
| – Net Position: | 310,066 | -335,127 | 25,061 |
| – Gross Longs: | 369,734 | 74,647 | 52,976 |
| – Gross Shorts: | 59,668 | 409,774 | 27,915 |
| – Long to Short Ratio: | 6.2 to 1 | 0.2 to 1 | 1.9 to 1 |
| NET POSITION TREND: | |||
| – Strength Index Score (3 Year Range Pct): | 100.0 | 0.0 | 61.4 |
| – Strength Index Reading (3 Year Range): | Bullish-Extreme | Bearish-Extreme | Bullish |
| NET POSITION MOVEMENT INDEX: | |||
| – 6-Week Change in Strength Index: | 27.6 | -24.2 | -18.8 |
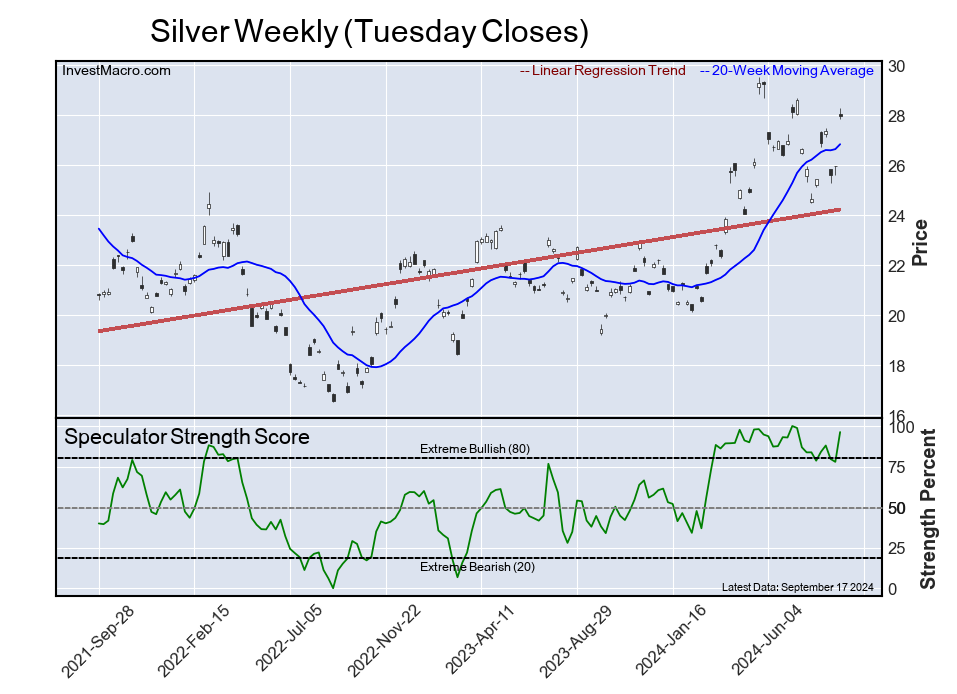
Silver Comex Futures:
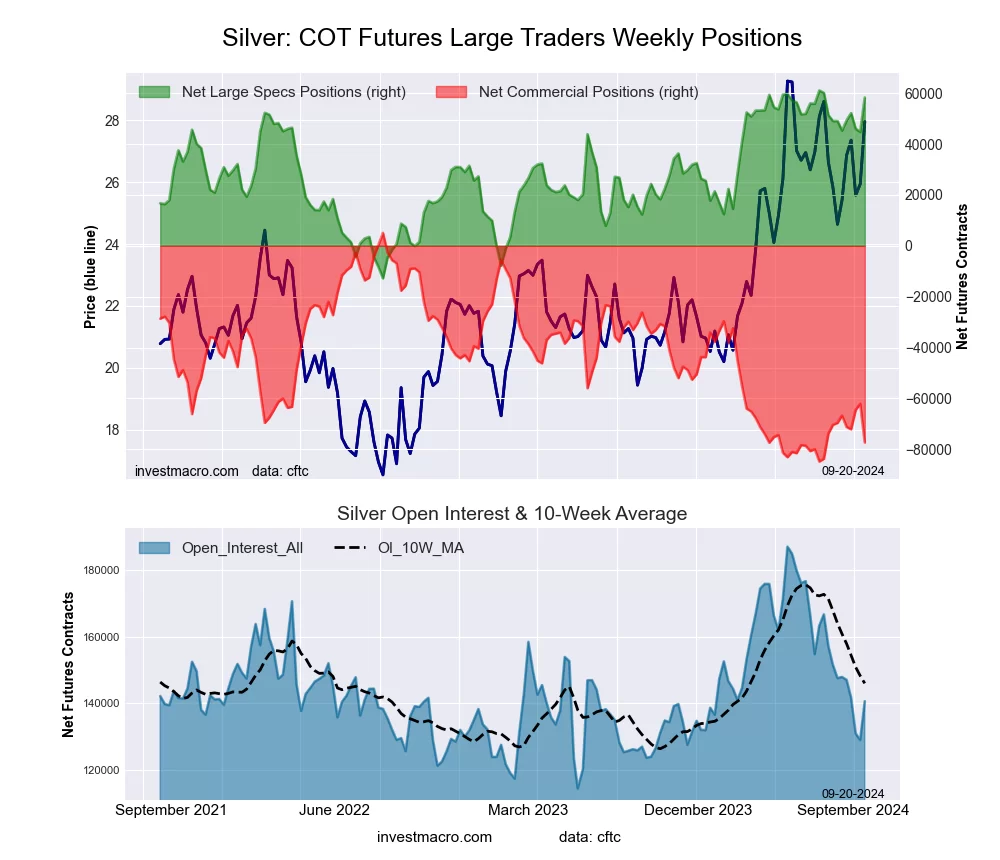 The Silver Comex Futures large speculator standing this week reached a net position of 58,298 contracts in the data reported through Tuesday. This was a weekly increase of 13,556 contracts from the previous week which had a total of 44,742 net contracts.
This week’s current strength score (the trader positioning range over the past three years, measured from 0 to 100) shows the speculators are currently Bullish-Extreme with a score of 96.3 percent. The commercials are Bearish-Extreme with a score of 8.3 percent and the small traders (not shown in chart) are Bullish with a score of 62.7 percent.
Price Trend-Following Model: Strong Uptrend
Our weekly trend-following model classifies the current market price position as: Strong Uptrend. The current action for the model is considered to be: Hold – Maintain Long Position.
| Silver Futures Statistics | SPECULATORS | COMMERCIALS | SMALL TRADERS |
| – Percent of Open Interest Longs: | 53.3 | 20.0 | 20.6 |
| – Percent of Open Interest Shorts: | 11.9 | 75.0 | 7.1 |
| – Net Position: | 58,298 | -77,306 | 19,008 |
| – Gross Longs: | 74,978 | 28,131 | 29,005 |
| – Gross Shorts: | 16,680 | 105,437 | 9,997 |
| – Long to Short Ratio: | 4.5 to 1 | 0.3 to 1 | 2.9 to 1 |
| NET POSITION TREND: | |||
| – Strength Index Score (3 Year Range Pct): | 96.3 | 8.3 | 62.7 |
| – Strength Index Reading (3 Year Range): | Bullish-Extreme | Bearish-Extreme | Bullish |
| NET POSITION MOVEMENT INDEX: | |||
| – 6-Week Change in Strength Index: | 12.5 | -8.5 | -7.5 |
Copper Grade #1 Futures:
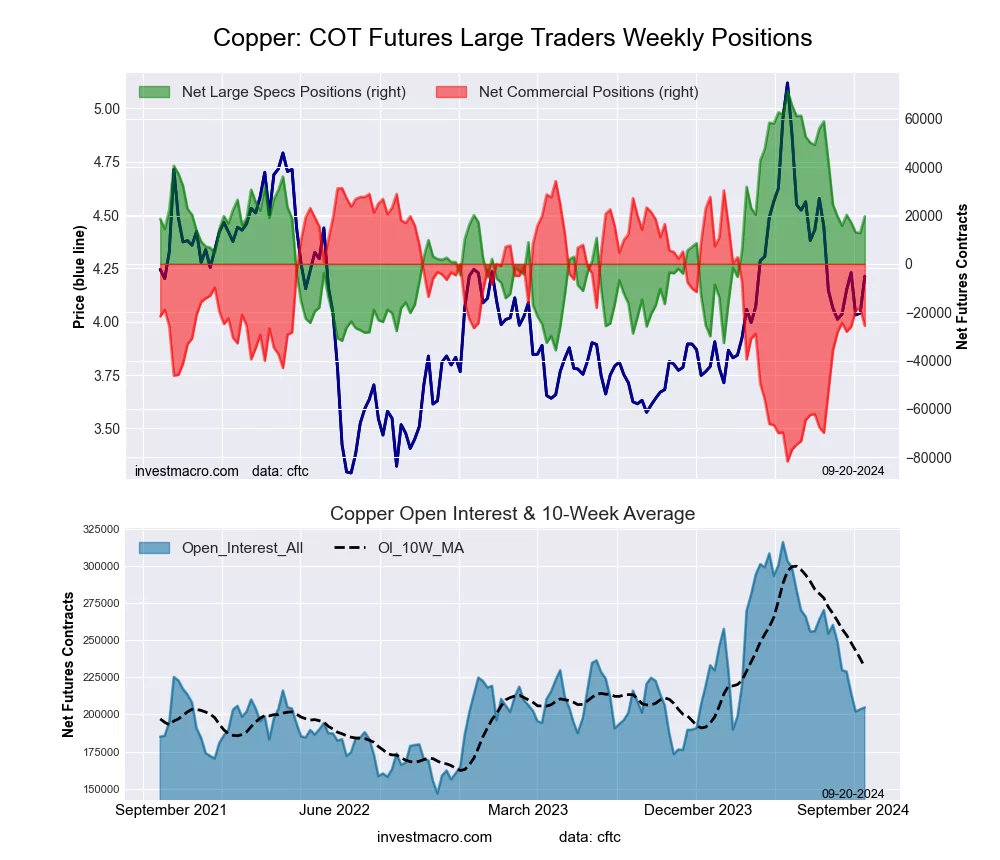 The Copper Grade #1 Futures large speculator standing this week reached a net position of 19,682 contracts in the data reported through Tuesday. This was a weekly increase of 6,870 contracts from the previous week which had a total of 12,812 net contracts.
This week’s current strength score (the trader positioning range over the past three years, measured from 0 to 100) shows the speculators are currently Bullish with a score of 51.6 percent. The commercials are Bearish with a score of 48.4 percent and the small traders (not shown in chart) are Bullish with a score of 53.6 percent.
Price Trend-Following Model: Downtrend
Our weekly trend-following model classifies the current market price position as: Downtrend. The current action for the model is considered to be: Hold – Maintain Short Position.
| Copper Futures Statistics | SPECULATORS | COMMERCIALS | SMALL TRADERS |
| – Percent of Open Interest Longs: | 38.7 | 34.4 | 8.7 |
| – Percent of Open Interest Shorts: | 29.1 | 46.9 | 5.9 |
| – Net Position: | 19,682 | -25,602 | 5,920 |
| – Gross Longs: | 79,235 | 70,413 | 17,898 |
| – Gross Shorts: | 59,553 | 96,015 | 11,978 |
| – Long to Short Ratio: | 1.3 to 1 | 0.7 to 1 | 1.5 to 1 |
| NET POSITION TREND: | |||
| – Strength Index Score (3 Year Range Pct): | 51.6 | 48.4 | 53.6 |
| – Strength Index Reading (3 Year Range): | Bullish | Bearish | Bullish |
| NET POSITION MOVEMENT INDEX: | |||
| – 6-Week Change in Strength Index: | 0.1 | 2.3 | -16.7 |
Platinum Futures:
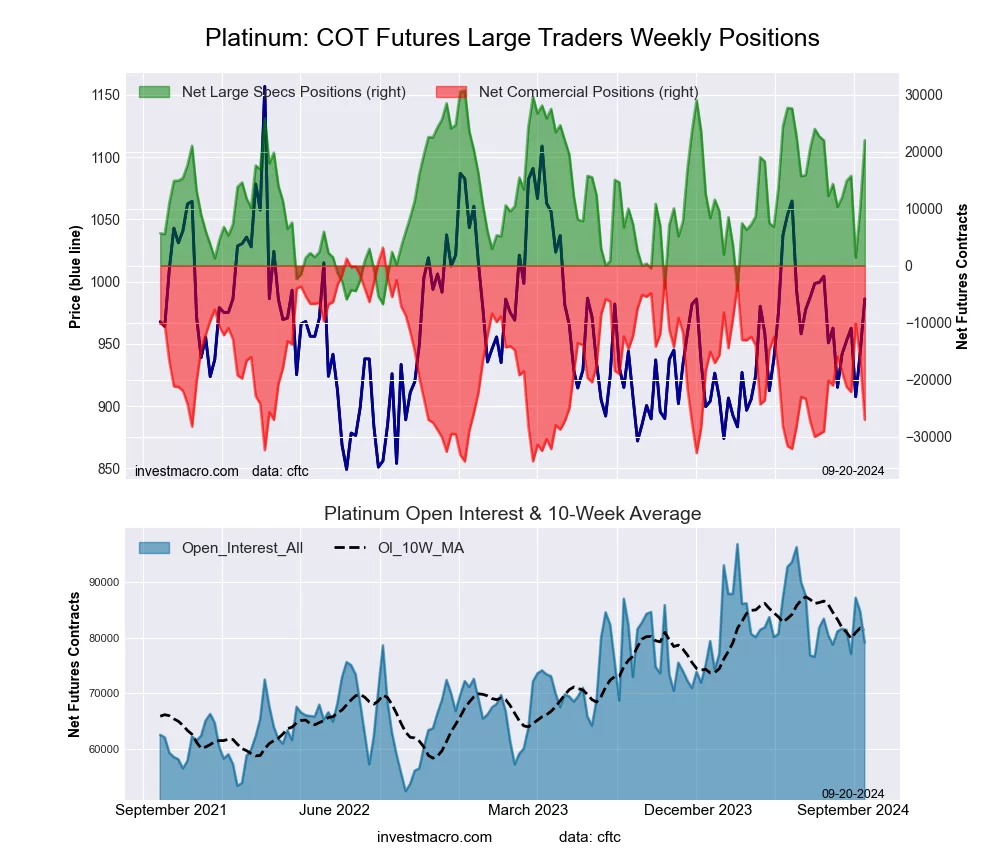 The Platinum Futures large speculator standing this week reached a net position of 21,978 contracts in the data reported through Tuesday. This was a weekly advance of 11,975 contracts from the previous week which had a total of 10,003 net contracts.
This week’s current strength score (the trader positioning range over the past three years, measured from 0 to 100) shows the speculators are currently Bullish with a score of 76.7 percent. The commercials are Bearish-Extreme with a score of 19.5 percent and the small traders (not shown in chart) are Bearish with a score of 42.1 percent.
Price Trend-Following Model: Downtrend
Our weekly trend-following model classifies the current market price position as: Downtrend. The current action for the model is considered to be: Hold – Maintain Short Position.
| Platinum Futures Statistics | SPECULATORS | COMMERCIALS | SMALL TRADERS |
| – Percent of Open Interest Longs: | 53.9 | 24.0 | 11.7 |
| – Percent of Open Interest Shorts: | 26.2 | 58.2 | 5.3 |
| – Net Position: | 21,978 | -27,031 | 5,053 |
| – Gross Longs: | 42,679 | 19,028 | 9,283 |
| – Gross Shorts: | 20,701 | 46,059 | 4,230 |
| – Long to Short Ratio: | 2.1 to 1 | 0.4 to 1 | 2.2 to 1 |
| NET POSITION TREND: | |||
| – Strength Index Score (3 Year Range Pct): | 76.7 | 19.5 | 42.1 |
| – Strength Index Reading (3 Year Range): | Bullish | Bearish-Extreme | Bearish |
| NET POSITION MOVEMENT INDEX: | |||
| – 6-Week Change in Strength Index: | 31.2 | -29.6 | -9.1 |
Palladium Futures:
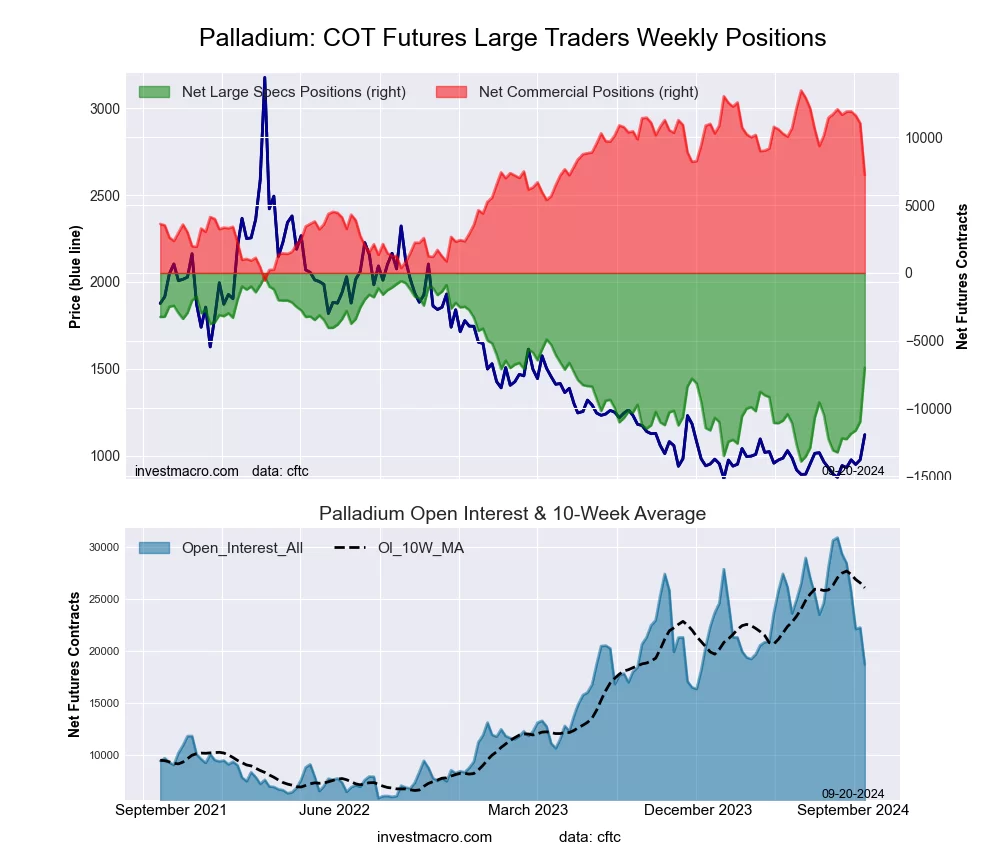 The Palladium Futures large speculator standing this week reached a net position of -7,000 contracts in the data reported through Tuesday. This was a weekly boost of 3,988 contracts from the previous week which had a total of -10,988 net contracts.
This week’s current strength score (the trader positioning range over the past three years, measured from 0 to 100) shows the speculators are currently Bullish with a score of 50.7 percent. The commercials are Bullish with a score of 55.5 percent and the small traders (not shown in chart) are Bearish with a score of 22.6 percent.
Price Trend-Following Model: Strong Uptrend
Our weekly trend-following model classifies the current market price position as: Strong Uptrend. The current action for the model is considered to be: Hold – Maintain Long Position.
| Palladium Futures Statistics | SPECULATORS | COMMERCIALS | SMALL TRADERS |
| – Percent of Open Interest Longs: | 27.3 | 58.7 | 9.9 |
| – Percent of Open Interest Shorts: | 64.7 | 20.1 | 11.1 |
| – Net Position: | -7,000 | 7,226 | -226 |
| – Gross Longs: | 5,102 | 10,983 | 1,853 |
| – Gross Shorts: | 12,102 | 3,757 | 2,079 |
| – Long to Short Ratio: | 0.4 to 1 | 2.9 to 1 | 0.9 to 1 |
| NET POSITION TREND: | |||
| – Strength Index Score (3 Year Range Pct): | 50.7 | 55.5 | 22.6 |
| – Strength Index Reading (3 Year Range): | Bullish | Bullish | Bearish |
| NET POSITION MOVEMENT INDEX: | |||
| – 6-Week Change in Strength Index: | 45.8 | -34.6 | -66.9 |
Steel Futures Futures:
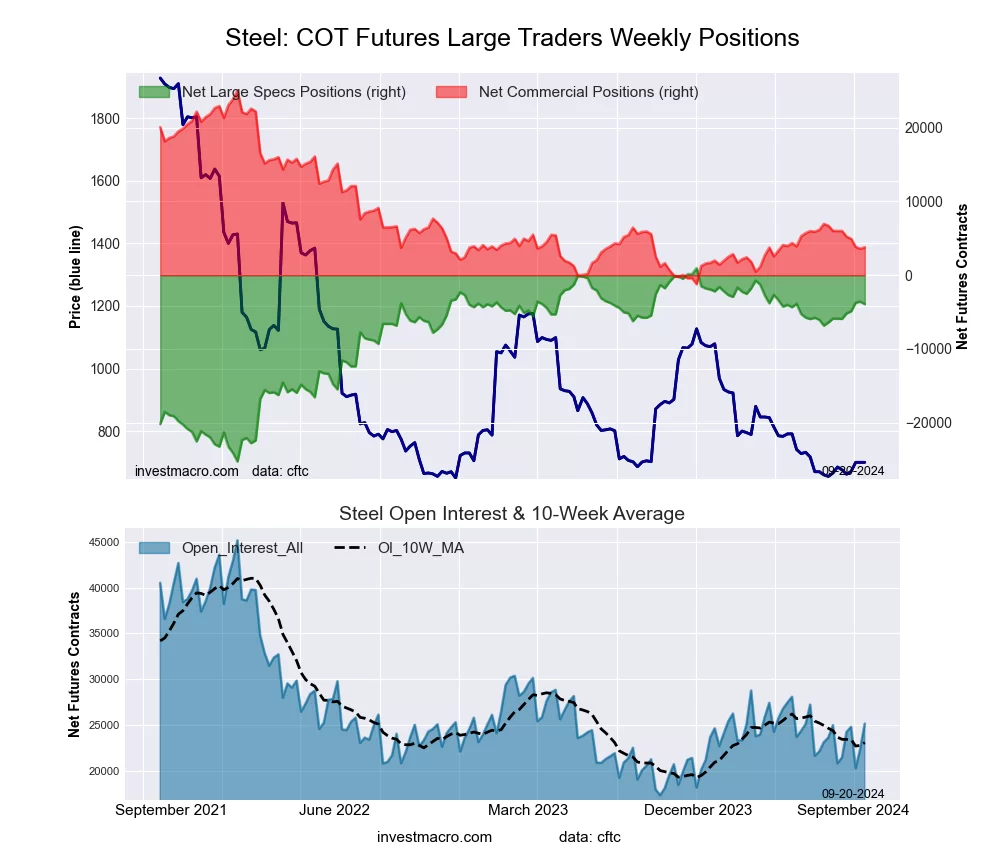 The Steel Futures large speculator standing this week reached a net position of -3,923 contracts in the data reported through Tuesday. This was a weekly decline of -346 contracts from the previous week which had a total of -3,577 net contracts.
This week’s current strength score (the trader positioning range over the past three years, measured from 0 to 100) shows the speculators are currently Bullish-Extreme with a score of 81.3 percent. The commercials are Bearish-Extreme with a score of 19.1 percent and the small traders (not shown in chart) are Bearish with a score of 46.4 percent.
Price Trend-Following Model: Downtrend
Our weekly trend-following model classifies the current market price position as: Downtrend. The current action for the model is considered to be: Hold – Maintain Short Position.
| Steel Futures Statistics | SPECULATORS | COMMERCIALS | SMALL TRADERS |
| – Percent of Open Interest Longs: | 15.1 | 72.4 | 1.5 |
| – Percent of Open Interest Shorts: | 30.7 | 57.3 | 1.0 |
| – Net Position: | -3,923 | 3,795 | 128 |
| – Gross Longs: | 3,807 | 18,213 | 376 |
| – Gross Shorts: | 7,730 | 14,418 | 248 |
| – Long to Short Ratio: | 0.5 to 1 | 1.3 to 1 | 1.5 to 1 |
| NET POSITION TREND: | |||
| – Strength Index Score (3 Year Range Pct): | 81.3 | 19.1 | 46.4 |
| – Strength Index Reading (3 Year Range): | Bullish-Extreme | Bearish-Extreme | Bearish |
| NET POSITION MOVEMENT INDEX: | |||
| – 6-Week Change in Strength Index: | 7.5 | -8.4 | 24.2 |
Article By InvestMacro – Receive our weekly COT Newsletter
*COT Report: The COT data, released weekly to the public each Friday, is updated through the most recent Tuesday (data is 3 days old) and shows a quick view of how large speculators or non-commercials (for-profit traders) were positioned in the futures markets.
The CFTC categorizes trader positions according to commercial hedgers (traders who use futures contracts for hedging as part of the business), non-commercials (large traders who speculate to realize trading profits) and nonreportable traders (usually small traders/speculators) as well as their open interest (contracts open in the market at time of reporting). See CFTC criteria here.