Gold rose to 4,600 USD per ounce on Tuesday, continuing its recovery from the previous session, and is now trading around 4,548 USD. Market sentiment was supported by hopes of a possible resumption of negotiations between the US and Iran, which has somewhat eased concerns over inflation and the energy crisis.
US President Donald Trump announced that he had postponed a planned strike on Iran following appeals from Saudi Arabia, Qatar, and the UAE. According to him, the Gulf states believe an agreement with Tehran is still possible.
Earlier, gold had been under pressure due to escalating tensions in the Middle East. Rising oil prices increased inflationary risks and reinforced expectations of further interest rate hikes by central banks globally.
Additionally, accelerating US inflation continues to weigh on the market. Investors are revising their expectations for Federal Reserve policy, with the likelihood of a rate cut this year declining significantly. Discussions are increasingly focusing on the potential for another rate increase before year-end.
Market attention now turns to the upcoming release of FOMC minutes and preliminary US PMI data. These reports could provide fresh signals regarding the state of the economy and the Fed’s next steps.
Technical Analysis
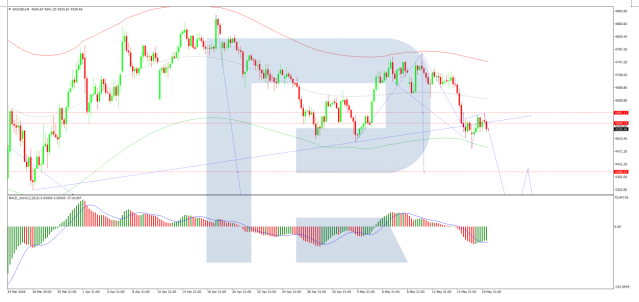
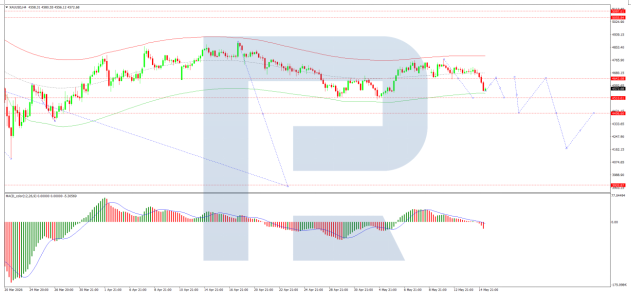
On the H4 XAU/USD chart, gold has rebounded towards 4,590 USD and is now moving lower towards 4,400 USD. A corrective bounce to 4,550 USD is possible, followed by a further decline towards 4,250 USD. The MACD indicator confirms the current downside momentum, with the signal line below the centre line and pointing firmly downwards.
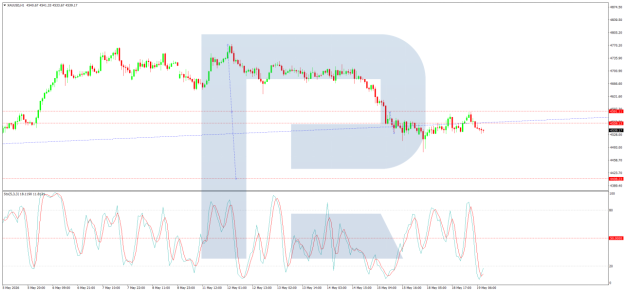
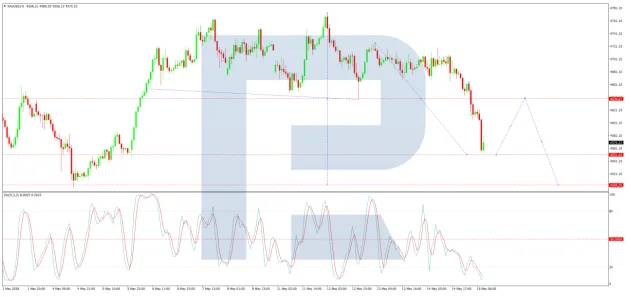
On the H1 chart, gold has broken below 4,555 USD and continues to move lower towards 4,400 USD. A corrective rebound to 4,550 USD (testing from below) may follow, before a further decline towards 4,250 USD. The Stochastic oscillator supports this scenario, with the signal line below 20 and pointing firmly downwards, indicating continued downside pressure.
Conclusion
Gold is recovering from recent losses, supported by easing geopolitical tensions and hopes for renewed US–Iran talks. However, strong US inflation and expectations of further Fed rate hikes continue to exert downward pressure. Technical indicators suggest a mixed short-term outlook, with potential corrective rebounds followed by further declines.
Disclaimer
Any forecasts contained herein are based on the author’s particular opinion. This analysis may not be treated as trading advice. RoboForex bears no responsibility for trading results based on trading recommendations and reviews contained herein.
On Friday, US stock indices fell sharply amid growing investor concerns about the consequences of the prolonged conflict with Iran. Market participants fear that further increases in energy prices will intensify inflationary pressure and force the Federal Reserve to keep interest rates high for longer. By the end of the day, the Dow Jones (US30) fell by 1.07% (weekly result -0.05%). The S&P 500 (US500) declined by 1.24% (weekly result +0.31%). The Technology Index NASDAQ (US100) closed lower by 1.54% (weekly result -0.21%). Pressure intensified due to profit‑taking in the technology sector after a prolonged rally driven by artificial intelligence.
The largest declines were seen among semiconductor and memory‑chip manufacturers: Intel shares fell by 5%, AMD dropped by 3%, and Micron Technology lost 4%. Nvidia declined about 2%. The exception was Microsoft, whose shares rose 4% after Bill Ackman announced that Pershing Square had opened a position in the company. Boeing shares continued to fall, losing another 3%, as investors reacted cautiously to Donald Trump’s statement that China intends to purchase 200 Boeing aircraft, viewing the figure as only slightly above previously expected delivery volumes.
In mid‑May, the Mexican peso weakened to around 17.3 per US dollar amid a stronger US currency and rising US Treasury yields. Pressure on the peso also came from weak domestic macroeconomic data. Mexico’s economy contracted by 0.8% in the first quarter, worse than market expectations, increasing concerns about slowing economic activity. Although the Bank of Mexico previously cut the key rate to 6.5%, the regulator indicated that the easing cycle is likely nearing its end. The central bank adopted a more cautious stance due to inflation risks driven by high oil and fuel prices, which limit room for further rate cuts. The Canadian dollar weakened slightly to around 1.37 per US dollar, extending its decline after reaching a seven‑week high at the end of April. Pressure on the Canadian currency increased amid US dollar strength following higher‑than‑expected US inflation data. Additional support for the US dollar comes from geopolitical tensions in the Middle East. At the same time, rising oil prices partially limit the Canadian dollar’s decline, as Canada’s economy and currency traditionally benefit from a stronger commodity sector and higher export revenues.
Bitcoin (BTC/USD) fell to around 76,000 dollars, reaching its lowest level in more than two weeks amid deteriorating global risk appetite due to the escalation of the US-Iran conflict. Another negative factor was a large capital outflow from US spot bitcoin ETFs: investors withdrew more than 1 billion dollars over the past week, marking the first weekly outflow of this magnitude since late January.
By the end of the day, Germany’s DAX (DE40) fell by 2.07% (weekly result -1.57%), France’s CAC 40 (FR40) closed down by 1.60% (weekly result -1.45%), Spain’s IBEX 35 (ES35) declined by 1.05% (weekly result -1.58%), and the UK’s FTSE 100 (UK100) ended the session down by 1.71% (weekly result -0.37%). On Friday, WTI oil prices rose more than 4.5%, climbing to around 106 dollars per barrel, with weekly gains reaching roughly 11% amid the continued effective closure of the Strait of Hormuz. The market remains under severe strain due to the threat of disruptions to global oil supplies, as diplomatic efforts to resolve the conflict have yielded no results. Limited tanker movement through the strait is increasing concerns about supply shortages and supporting persistently high energy prices.
Silver (XAG/USD) fell more than 8%, dropping to 76 dollars per ounce and extending its decline for the second consecutive session amid rising concerns about accelerating US inflation and potential further monetary tightening. Pressure on the market came from fresh data showing that in April, producer prices as well as import and export prices in the US rose at the fastest pace since 2022, while consumer inflation reached its highest level since 2023. Investors link the increase in price pressure to the prolonged Middle East conflict and ongoing restrictions on shipping through the Strait of Hormuz, which support high energy prices.
In Asia, Japan’s Nikkei 225 (JP225) fell by 1.99% (weekly result -2.84%), China’s FTSE China A50 closed down by 1.05% (weekly result -1.39%), Hong Kong’s Hang Seng (HK50) declined by 1.62% (weekly result -1.32%), and Australia’s ASX 200 (AU200) fell by 0.11% (weekly result -0.68%). On Monday, Chinese stock indices closed with moderate gains. The market was supported by the technology sector, which offset pressure from weak macroeconomic data. The top performers were companies linked to artificial intelligence and semiconductors. At the same time, China’s economic data increased concerns about slowing domestic activity. Retail sales growth in April slowed sharply to 0.2% year‑over‑year, the weakest result since December 2022. Industrial production also slowed to 4.1%, the lowest level since July 2023, while the unemployment rate improved slightly, falling to 5.2% from March’s 5.4%, the lowest in three months.
Hong Kong’s economy grew by 5.9% year‑over‑year in Q1 2026, confirming preliminary estimates and accelerating from a revised 4% increase in the previous quarter. This was the strongest pace of expansion since Q2 2021. The main drivers were resilient domestic demand, rising consumer spending, and increased investment activity. On a seasonally adjusted quarterly basis, GDP rose 2.9%, the fastest growth in nearly five years. Against this backdrop, authorities maintained their 2026 growth prognosis in the range of 2.5-3.5%.
S&P 500 (US500) 7,408.50 −92.74 (−1.24%)
Dow Jones (US30) 49,526.17 −537.29 (−1.07%)
DAX (DE40) 23,950.57 −505.69 (−2.07%)
FTSE 100 (UK100) 10,195.37 −177.56 (−1.71%)
USD Index 99.27 +0.45 (+0.46%)
News feed for: 2026.05.18
China Industrial Production (m/m) at 05:00 (GMT+3) – CHA50, HK50 (MED)
China Retail Sales (m/m) at 05:00 (GMT+3) – CHA50, HK50 (MED)
China Unemployment Rate (m/m) at 05:00 (GMT+3) – CHA50, HK50 (MED)
This article reflects a personal opinion and should not be interpreted as an investment advice, and/or offer, and/or a persistent request for carrying out financial transactions, and/or a guarantee, and/or a forecast of future events.
USD/JPY climbed to 158.93 on Monday, marking the yen’s sixth consecutive session of decline. The Japanese currency is under pressure from a stronger dollar amid rising expectations that the Federal Reserve may raise interest rates this year to curb inflation.
US inflation is accelerating due to the energy shock caused by the ongoing Middle East conflict. At the same time, the US and Iran have yet to reach a peace agreement or make progress on reopening the Strait of Hormuz.
The USD/JPY exchange rate is once again approaching the key level of 160, where Japanese authorities intervened in the foreign exchange market to support the yen in late April.
Markets are closely monitoring the risk of fresh intervention by Tokyo. Additional attention has been drawn to statements from Japanese officials that authorities are ready to intervene in the foreign exchange market as many times as necessary.
Support for such expectations has also come from US Treasury Secretary Scott Bessent, who previously praised Japan’s actions to stabilise the yen.
Technical Analysis
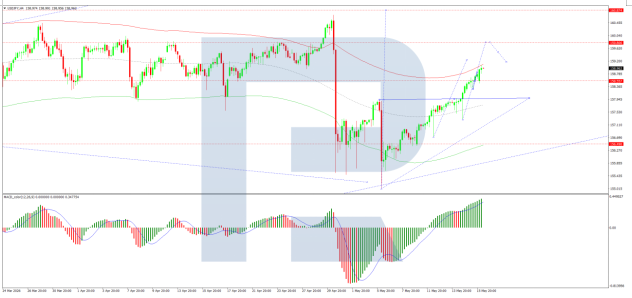
On the H4 chart, USD/JPY is trading within a consolidation range around 158.33 and is moving higher towards 159.30. A test of this level is likely, followed by a possible pullback to 158.30, with scope for a further decline towards 157.00. The MACD indicator supports this scenario, with its signal line above zero and pointing firmly upwards, indicating continued bullish momentum.
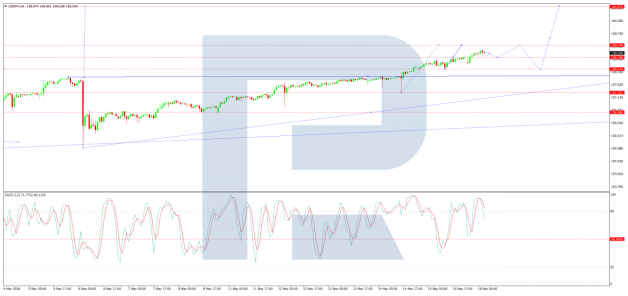
On the H1 chart, USD/JPY has reached 159.00 and is pulling back towards 158.80. A subsequent rise towards 159.30 is possible. The Stochastic oscillator confirms this scenario, with its signal line above 80 and pointing firmly downwards towards 50, indicating that short-term downside pressure may develop.
Conclusion
USD/JPY continues its six-day rally as the yen returns to intervention-warning territory. The dollar is being bolstered by expectations that the Fed may need to raise rates to combat inflation fuelled by the Middle East energy shock, while US-Iran negotiations remain stalled. With the pair approaching the psychologically critical 160 level, where Japanese authorities intervened in late April, markets are on high alert for potential official action. Tokyo has repeatedly signalled its readiness to intervene, and US Treasury Secretary Bessent has offered support for Japan’s approach. Technically, further upside towards 159.30 appears likely before any pullback, but intervention risks may cap gains near current levels.
Disclaimer
Any forecasts contained herein are based on the author’s particular opinion. This analysis may not be treated as trading advice. RoboForex bears no responsibility for trading results based on trading recommendations and reviews contained herein.
On Thursday, the US stock market closed higher. By the end of the day, the Dow Jones (US30) rose by 0.75%. The S&P 500 (US500) increased by 0.77%. The technology index Nasdaq (US100) closed up by 0.88%. The main driver of growth was once again the artificial‑intelligence sector: shares of Cisco Systems jumped 13.4% after raising its revenue and profit outlook, and Nvidia surged 4.4%, extending its monthly gain to 15% after the US allowed shipments of H200 chips to ten Chinese companies.
Additional support for markets came from optimism ahead of the US-China summit in Beijing. US Treasury Secretary Scott Bessent stated that the two sides are discussing accelerated approval of certain Chinese investment deals, as well as a possible reduction of tariffs on several non‑critical goods. Investors expect that negotiations between Donald Trump and Xi Jinping will help ease global trade tensions and support further growth in the technology sector, despite ongoing pressure from high interest rates and geopolitical risks.
On Thursday, European stock indices posted solid gains for the second consecutive day amid strong corporate earnings and improving sentiment around the US-China summit. By the end of the day, Germany’s DAX (DE40) rose by 1.32%, France’s CAC 40 (FR40) closed up by 0.93%, Spain’s IBEX 35 (ES35) gained 0.83%, and the UK’s FTSE 100 (UK100) ended the session up by 0.46%. Technology companies led the gains, as positive signals from talks between US tech‑sector leaders and the Chinese delegation strengthened expectations of further demand growth for artificial‑intelligence infrastructure. Against this backdrop, ASML shares jumped 5.5%, and Infineon rose 3%. Siemens also supported the market, with its shares rising 2.6% after strong financial results and positive forecasts.
On Thursday, WTI oil prices held near 100 dollars per barrel as market participants continued to assess the situation around the Strait of Hormuz and the results of negotiations between Donald Trump and Xi Jinping. According to reports from Iran, around 30 vessels passed through the strait in recent hours, and Tehran began allowing transit of some Chinese ships, which slightly eased concerns about a full blockade of the key oil‑supply route. Despite signs of limited progress, fundamental risks for the market remain high. The International Energy Agency reported that in the first quarter, oil and fuel shipments through the Strait of Hormuz fell by nearly 6 million barrels per day and warned that a severe global supply deficit may persist at least until October, even if the conflict ends next month.
The US natural‑gas prices rose to 2.92 dollars per MMBtu, hitting a seven‑week high as the market continued to react to reduced production and moderate storage‑injection rates. According to the EIA, 85 billion cubic feet of gas were injected into storage during the week ending May 8, matching analyst expectations, below last year’s level of 109 billion cubic feet, and only slightly above the five‑year average. Additional support came from declining production volumes: several producers, including EQT, reduced activity amid persistently low spot prices, resulting in daily output at its lowest level in 15 weeks.
In Asia on Friday, Japan’s Nikkei 225 (JP225) fell by 0.98%, China’s FTSE China A50 closed down by 1.34%, Hong Kong’s Hang Seng (HK50) rose by 0.01%, and Australia’s ASX 200 (AU200) increased by 0.12%.
The Australian dollar (AUD) fell to 0.72 US dollars, retreating from its recent four‑year high and showing a weekly decline of about 0.6% amid broad US dollar strength. The US dollar is supported by persistently high energy prices and ongoing disruptions to shipping through the Strait of Hormuz. In Australia, the Reserve Bank (RBA) has already raised rates three times since the beginning of the year in response to inflationary pressure caused by the global energy crisis linked to the Middle East conflict. Markets now estimate the probability of another rate hike by August at around 80%.
On Friday, the New Zealand dollar (NZD) fell to 0.586 US dollars and is heading toward a weekly decline amid weak manufacturing‑sector data. The manufacturing PMI fell to 50.5 in April from 52.8 a month earlier, reaching a seven‑month low. Despite the Reserve Bank of New Zealand’s (RBNZ) cautious stance following the economy’s recent exit from recession, markets continue to price in the likelihood of further tightening amid rising inflation risks. The probability of a rate hike at the end of the month is estimated at around 40%, while a July increase is already almost fully priced in.
S&P 500 (US500) 7,501.24 +56.99 (+0.77%)
Dow Jones (US30) 50,063.46 +370.26 (+0.75%)
DAX (DE40) 24,456.26 +319.45 (+1.32%)
FTSE 100 (UK100) 10,372.93 +47.58 (+0.46%)
USD Index = 98.90 +0.38 (+0.38%)
News feed for: 2026.05.15
Japan Producer Price Index (m/m) at 02:50 (GMT+3) – JPY (MED)
US Industrial Production (m/m) at 16:15 (GMT+3) – USD (MED)
This article reflects a personal opinion and should not be interpreted as an investment advice, and/or offer, and/or a persistent request for carrying out financial transactions, and/or a guarantee, and/or a forecast of future events.
Gold continued its decline on Friday, falling to 4,619 USD per ounce. The week is set to close with losses of around 1%, as mounting US inflation puts pressure on the market. Rising prices reinforce expectations that the Federal Reserve may maintain elevated rates for longer or even resume rate hikes.
Data released this week showed that US manufacturing inflation rose at its fastest pace since 2022 in April, while consumer prices recorded the most significant increase since 2023.
The primary driver of inflationary pressure remains the ongoing conflict in the Middle East and disruptions to supplies through the Strait of Hormuz, which continue to influence global energy markets.
In this context, the market has largely ruled out a Fed rate cut for 2026. Some investors are even pricing in the possibility of a further rate hike by December.
Investor attention was also drawn to the meeting between US President Donald Trump and Chinese President Xi Jinping, during which ensuring open navigation through the Strait of Hormuz to support global energy trade was a key topic.
Separately, the market is keeping an eye on India, where authorities have further tightened regulations on gold imports as part of measures to support the rupee.
Technical Analysis
On the H4 XAU/USD chart, gold has broken below 4,639 USD and is moving lower towards 4,550 USD. A corrective rebound to 4,630 USD (testing from below) is possible, followed by a further decline towards 4,500 USD. The MACD indicator confirms the current bearish momentum, with its signal line below the centre line and pointing firmly downwards.
On the H1 chart, gold has broken below the 4,639 USD level and continues to move lower towards 4,555 USD. A rebound towards 4,639 USD may follow before a further decline towards 4,550 USD. The Stochastic oscillator supports this scenario, with its signal line below 20 and pointing firmly downwards, indicating continued downside pressure.
Conclusion
Gold remains under pressure as US inflation data strengthens the case for sustained or higher interest rates. Short-term technical indicators suggest further downside potential, although temporary corrections may occur. Geopolitical developments and policy decisions in major economies will continue to dictate market sentiment.
Disclaimer
Any forecasts contained herein are based on the author’s particular opinion. This analysis may not be treated as trading advice. RoboForex bears no responsibility for trading results based on trading recommendations and reviews contained herein.
The nonprofit ARC Prize Foundation on May 1, 2026, released the results of a new benchmark: a test of an AI system’s ability to solve a game. The results were striking – humans scored 100%, while the most advanced AI systems scored under 1%.
At first glance, this may be surprising to users of AI who are impressed by its polished essays, codebases and multistep projects generated in seconds. How can these brilliant AI systems struggle with these simple Tetris-shape puzzles?
That confusion points to a risk: AI is becoming integrated into everyday life faster than people can make sense of it.
We are cognitive psychologistswho study how to teach difficult concepts. To recognize the limits and risks of today’s AI agent systems, it’s important for people to grasp that the systems can both accomplish superhuman feats and make mistakes few humans would. To that end, we propose a new way to think about AIs: as button-pushing explorers.
Mental models for AI
We teach college students, a group rapidly incorporating AI tools into their daily routines. That gives us regular opportunities to ask what they think is going on with AI. The answers vary widely. One student said that someone at OpenAI or Anthropic is reading and approving every response the system generates. Another, more succinctly, said, “It’s magic.”
These responses illustrate two tempting ways of making sense of AI. At one extreme, AI is treated as an inscrutable black box – a powerful but ultimately mysterious force. At another, people explain it using the same assumptions they use to understand other humans: that its outputs reflect reasoning or judgment.
The worry is that these misinterpretations don’t go away as users gain more experience interacting with AI, and they might get reinforced. When AI performs well, its output can feel like evidence of understanding or confirmation that it really is something like magic. That apparent success makes it harder to question what the system is actually doing. Biases can seem logical or inevitable; harmful behavior can look like a deliberate choice or even fate, as if it could not have gone any other way.
Cognitive scientist Anil Seth explains why AIs don’t have – and won’t have – consciousness.
Saying that AI models are shaped by patterns in data, training processes and system design is true, but that’s too abstract to tell people when to trust the systems’ outputs or when they might fail. To help people avoid misplaced trust in AI, AI literacy efforts will need to include some mechanistic understanding of what produces their behavior – explanations that are perhaps not perfectly accurate but useful. Statistician George Boxonce wrote, “All models are wrong, but some are useful.”
Researchers have come up with several mental models for large language models. One is “stochastic parrot,” which shows that the models use statistical methods – stochastic refers to probabilities – to mimic responses with no understanding of meaning. Another is “bag of words,” which emphasizes that the models are collections of words – for example, all English words found on the internet – with a mechanism for giving you the best set of words based on your prompt.
These ways of thinking about large language models were never meant to be complete accounts of the systems. But the metaphors serve an important cognitive purpose: They push back against the idea that fluent language is necessarily caused by humanlike understanding.
But as the AI systems people use are increasingly powerful agents capable of stringing together actions on their own, it’s important for people to have a different kind of mental model: one that explains how they act. One place to find such a model is in earlier research on AI systems that learned to play Atari 2600 games. These systems didn’t understand the games the way humans do, but they still managed to rack up a lot of points.
The simple loop: Act, observe, adjust
Imagine a neural network, a relatively simple kind of AI model, placed into a video game it has never seen before. It does not “understand” the game like a human would. It has no idea whether it’s shooting space invaders or navigating an ancient pyramid. It doesn’t know the goals or rules.
Instead, it learns to play through a simple loop: Take an action – move left, jump, shoot – observe what changes, and then adjust. If an action leads to a good outcome, such as gaining points, it adjusts to become more likely to take similar actions in similar situations. If it leads to a bad outcome, such as losing a life, it adjusts in the opposite direction.
Even this simple mechanism can produce surprisingly capable behavior. Over time, by repeating this loop, the neural networks learned to play a wide range of Atari games – but not all games.
There is one game that famously stumped these early neural networks: Montezuma’s Revenge. To make progress, a player must carry out a long sequence of actions – climbing ladders, avoiding obstacles, retrieving keys – before receiving any reward at all. Unlike simpler games, most actions offer very little immediate feedback. The game required something like goal-directed, long-term planning.
Early neural networks would try a few actions, receive no reward and fail to make further progress through Montezuma’s underground pyramid. From the system’s perspective, all actions looked equally useless. But researchers made a breakthrough by changing the feedback signal. Instead of rewarding only success, they also rewarded the system for doing something new. The rewards were for visiting parts of the game it had not seen before or trying actions it had not previously taken. This tweak encouraged exploration.
In 2016, Google DeepMind rewarded its AI model for exploration – try something, see what happens, adjust – while playing the Atari 2600 game Montezuma’s Revenge, which dramatically improved the AI’s performance on the game that’s notoriously difficult for AIs.
With that change, performance improved dramatically. The neural network began navigating obstacles, taking multiple steps toward goals and adapting when things went wrong. From the outside, this kind of behavior can look like planning or problem-solving. But what looks like planning was not caused by sophisticated planning abilities. The underlying mechanism is still the same simple loop: act, observe, adjust.
This kind of system isn’t a stochastic parrot or a bag of words. It’s closer to a button-pushing explorer: something that doesn’t understand the world in a human sense but moves forward by pushing buttons, seeing what happens and adjusting what it does next.
From video games to modern AI agents
Today’s AI systems can do far more than play games like Montezuma’s Revenge. They can coordinate tools, write and run code, and carry out multistep projects. The range of possible actions is much larger, and the environments in which they operate are increasingly complex.
But these agents are still fundamentally button-pushing explorers. The behavior can be sophisticated, but the process that produces it is not. Humans can often infer how a new environment works after just a few observations. Systems that rely on these feedback loops cannot. They need to try many actions and see what happens before they can make progress.
This helps explain both the strengths of these AI systems and some of their most concerning failures. What these agents learn depends on what is being rewarded. And in real-world systems, those reward signals are often imperfect.
These systems aren’t trying to be evil or greedy. They are adjusting to the signals they are given. From the button-pushing explorer perspective, these failures are downright predictable.
Effective AI literacy means holding two ideas at once: These systems can do surprisingly complex things, and they are not doing them the way humans do. If AI is seen as humanlike or magical, its outputs feel authoritative. But if it is understood, even imperfectly, as a button-pushing explorer shaped by feedback, people are likely to ask better questions: Why is it doing this? What shaped this behavior? What might it be missing?
That’s the difference between being impressed by AI and being able to reason about it.
On Wednesday, the US stock indices mostly rose, with the S&P 500 and Nasdaq 100 updating historical highs amid the ongoing rally in the technology sector. By the end of the day, the Dow Jones (US30) fell by 0.14%. The S&P 500 (US500) rose by 0.58%. The Technology Index Nasdaq (US100) closed higher by 1.04%. The main driver of growth once again was shares of processor and memory‑chip manufacturers, which remain key beneficiaries of the global boom surrounding artificial intelligence and investments in AI infrastructure.
Shares of Nvidia, Tesla, and Apple strengthened significantly, supporting the rise of the so‑called “Magnificent Seven.” Additional optimism came from US President Donald Trump’s visit to China, joined by the heads of major American technology companies. Markets expect that the upcoming summit between Trump and Chinese President Xi Jinping may lead to new trade agreements, especially in the strategically important semiconductor sector, which could ease tensions in the technological standoff between the US and China.
European indices closed in the green yesterday. By the end of the day, Germany’s DAX (DE40) rose by 0.76%, France’s CAC 40 (FR40) closed up by 0.35%, Spain’s IBEX 35 (ES35) gained 0.46%, and the UK’s FTSE 100 (UK100) ended the session up by 0.58%. The market was supported by strong corporate earnings and investor optimism ahead of US President Donald Trump’s visit to China, which helped offset persistent concerns about the conflict with Iran and high energy prices.
On Wednesday, WTI oil prices held near 102 dollars per barrel, trimming part of their intraday losses after a rapid increase of more than 7% over the previous three sessions, as tensions in the Middle East and the rapid decline in global inventories continued to support the market. According to the IEA, global oil stocks fell by about 4 million barrels per day in March and April, while Saudi Arabia reported to OPEC that its production had dropped to the lowest level since 1990. The agency warned that the market may remain in a state of severe supply shortage at least until October, even if the conflict between the US and Iran ends in the coming months. Additional support for prices came from US data showing a 4.3‑million‑barrel decline in crude inventories last week – almost twice as strong as market expectations.
The US natural gas prices rose to 2.87 dollars per MMBtu, once again approaching their highest levels in more than six weeks amid ongoing production cuts and improved demand expectations. The market is supported by declining US gas output, as several energy companies, including EQT, have reduced production due to a prolonged period of low spot prices, aiming to ease oversupply pressure.
In Asia on Friday, Japan’s Nikkei 225 (JP225) rose by 0.84%, China’s FTSE China A50 closed up by 0.66%, Hong Kong’s Hang Seng (HK50) gained 0.15%, and Australia’s ASX 200 (AU200) fell by 0.46%. In Australia, investor sentiment was pressured by warnings in the federal budget for 2026, where authorities pointed to serious risks associated with the ongoing fuel crisis and high energy prices. The market fears that the proposed support measures may be insufficient to fully protect the economy from the effects of the external inflation shock.
Investors expect a reduction in geopolitical tensions and hope for possible stabilization of bilateral relations ahead of the Donald Trump–Xi Jinping summit in Beijing. Additional support for the market came from the overall rise in Asian exchanges, where technology companies once again led the gains.
S&P 500 (US500) 7,444.25 +43.29 (+0.58%)
Dow Jones (US30) 49,693.20 −67.36 (−0.14%)
DAX (DE40) 24,136.81 +181.88 (+0.76%)
FTSE 100 (UK100) 10,325.35 +60.03 (+0.58%)
USD Index 98.48 +0.18 (+0.19%)
News feed for: 2026.05.14
UK GDP (m/m) at 09:00 (GMT+3) – GBP (MED)
UK Industrial Production (m/m) at 09:00 (GMT+3) – GBP (LOW)
UK Trade Balance (m/m) at 09:00 (GMT+3) – GBP (LOW)
US Retail Sales (m/m) at 15:30 (GMT+3) – USD (MED)
US Initial Jobless Claims (w/w) at 15:30 (GMT+3) – USD (MED)
US Natural Gas Storage (w/w) at 17:30 (GMT+3) – XNG (HIGH)
This article reflects a personal opinion and should not be interpreted as an investment advice, and/or offer, and/or a persistent request for carrying out financial transactions, and/or a guarantee, and/or a forecast of future events.
GBP/USD held at 1.3528 on Thursday following an overnight decline. The pound remains under pressure, close to its lowest levels since late April, amid media reports of a potential leadership contest within the ruling party. According to The Times, British Health Minister Wes Streeting is preparing to launch a campaign against Prime Minister Keir Starmer.
Despite pressure from parts of the government and more than 80 Labour Party MPs, Starmer has reiterated that he does not intend to resign following the party’s weak performance in the local elections. The cabinet composition remains largely stable, despite a few resignations from junior ministers.
External factors continue to weigh on the pound. Talks between the US and Iran remain inconclusive, while restrictions in the Strait of Hormuz keep oil prices elevated. Against this backdrop, the market continues to price in nearly three Bank of England rate hikes by the end of the year.
Investors are also awaiting the release of new UK macroeconomic data, including first-quarter GDP figures.
Technical Analysis
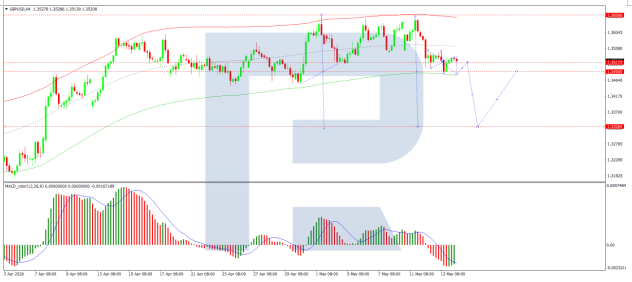
On the H4 chart, GBP/USD is trading within a broad consolidation range above 1.3515, currently extending up to 1.3530. A move lower towards 1.3480 is possible. After this, the pair may consolidate before attempting a move higher towards 1.3650 or a further decline towards 1.3340. The MACD indicator supports this scenario, with its signal line below zero and pointing firmly downwards.
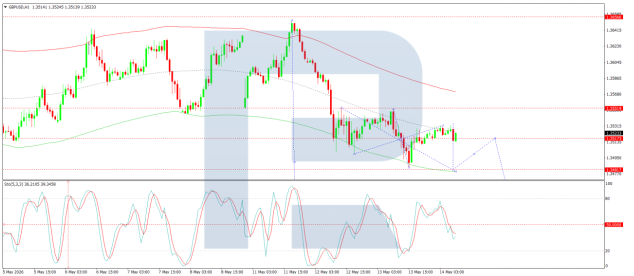
On the H1 chart, GBP/USD is trading within a compact consolidation range around 1.3515, currently extending down to 1.3483. A rebound towards 1.3530 (testing from below) is possible, followed by a potential move lower towards 1.3480. The Stochastic oscillator confirms this scenario, with its signal line below 50 and pointing firmly downwards towards 20.
Conclusion
GBP/USD remains under dual pressure from domestic political uncertainty and global economic risks. Further weakness in the pound is possible if leadership concerns and geopolitical tensions persist, while UK GDP data may act as a short-term catalyst for volatility.
Disclaimer
Any forecasts contained herein are based on the author’s particular opinion. This analysis may not be treated as trading advice. RoboForex bears no responsibility for trading results based on trading recommendations and reviews contained herein.
Rebuilding domestic mineral supply chains will depend not only on resource availability and funding, but also on whether the U.S. can rebuild the technical expertise and industrial systems required to process those materials on a large scale.
MP Materials’ Mountain Pass mine and processing facility in California was for years the only U.S. rare earth elements mine. Tmy350/Wikimedia Commons, CC BY-SA
How America lost its lead
The United States was a global leader in rare earth minerals from 1965 through the mid-1980s. It produced about 15,000 metric tons a year, about three times the amount produced by the rest of the world.
The Mountain Pass mine in California supplied the majority of the world’s rare earth elements used in electronics and the defense industry. American metallurgists, chemical engineers and processing facilities had significant expertise in its production and processing.
However, environmental damage, including wastewater pipeline leaks that released radioactive wastewater into the Mojave Desert during the 1980s and 1990s, and tightening regulations increased operating costs in the United States. During that period, much of the world’s manufacturing base for rare earth elements shifted to China, where labor costs were lower and environmental regulations were less stringent.
As production grew abroad, U.S. production of rare earth elements fell sharply – to near zero by the early 2000s, according to the U.S. Geological Survey.
These facilities require years of permitting, highly specialized equipment and a workforce trained in metallurgy, chemical engineering and industrial systems operation. The time from investment decision to production can stretch across a decade.
The U.S. currently has two domestic rare earth mining locations. One is in southeast Georgia, which extracts rare earth elements as a byproduct of heavy mineral sand mining. The other is Mountain Pass, which produces bastnaesite, a rare earth carbonate mineral. The mines produced about 51,000 metric tons of rare earth mineral concentrates in 2025, while the U.S. imported about 21,000 metric tons of rare earth compounds, most of them from China, according to 2025 U.S. Geological Survey data.
The U.S. has also lost expertise. Mining and mineral engineering education programs now produce only a few hundred graduates per year, well below the levels of past decades. The number of accredited programs has declined since the 1980s. Many faculty members are nearing retirement.
Industry projections estimate that the mining workforce will need to grow significantly in the coming years to meet rising demand. Specialized skills in areas such as rare earth separation, metallurgical testing and environmental systems design require years of training and practical experience. And while mining can produce high-paying jobs, the industry also has a reputation for environmental damage and hazardous conditions.
Environmental compliance is part of the skill set
Processing critical minerals is a dirty industry. That fact has made it more difficult for processing and refining companies to operate in the U.S.
For example, separating rare earth elements typically involves chemical processing with acids and solvents. When waste streams are poorly managed, these processes can produce toxic wastewater and air pollution and contribute to soil erosion. In parts of China where rare earth production expanded rapidly in the 1990s and 2000s, contamination from mining and processing has polluted rivers and damaged nearby farmland, and the wastewater can seep into soil and groundwater.
In the U.S., modern facilities must meet strict federal and state standards for air quality, water discharge and waste management that raise the cost of processing. These regulations were developed in response to environmental disasters, like the Cuyahoga River fire of 1969, when industrial oil and waste on the river burned, and hazardous waste crises like the Love Canal disaster that led to landmark environmental laws.
Operating a refinery or separation facility in compliance with regulatory standards today requires expertise in pollution control, waste treatment and sustainable process design. That requires a workforce skilled in materials science and engineering and with knowledge of environmental systems. Without environmental expertise, operational risks, regulatory challenges and project delays can increase, affecting long-term viability.
How to build a US supply chain
Rebuilding U.S. supply chains will require more than expanding extraction.
Canada’s critical minerals strategy offers an example. It connects mining projects to battery and electric vehicle manufacturing by funding processing facilities, developing regional supply chain hubs and investing in workforce training programs tied to those industries.
Australia has combined critical minerals policies with incentives and public financing to encourage domestic mineral processing, while also expanding university and vocational training in mining, metallurgy and mineral processing.
The United States has many of the key ingredients needed to rebuild its processing capacity, including research universities and workers with transferable industrial skills. Land-grant and technical universities could expand programs that integrate mining, materials science, environmental restoration and recycling. In regions such as Appalachia, where coal’s decline has left workers with skills but few job opportunities, retraining programs for new mineral recovery jobs could help people transition to a new industry.
A few federal programs support parts of this transition, including research hubs that develop new extraction and processing technologies, apprenticeship initiatives and university-industry partnerships. However, these efforts are spread across multiple agencies, with limited coordination to align priorities and investment.
The real bottleneck
America’s critical minerals strategy is often discussed in terms of geology and geopolitics – where resources are located and who has access to them.
But supply chains depend on people and systems. That’s America’s real bottleneck in creating a domestic supply chain.
A successful domestic supply chain will require workers who know how to separate neodymium from praseodymium, operate solvent extraction circuits and maintain hydrometallurgical plants within regulatory standards. These are highly specialized skills that take years to develop.
The United States has significant mineral resources and growing policy support. Now, it needs to pay attention to the workforce and industrial capacity needed to transform those resources into usable materials.
This gap developed over decades. Addressing it will likely require sustained investment alongside broader mineral policy changes such as permitting reforms and investment in domestic processing facilities.
Chances are, you think you do. It’s ubiquitous and iconic. How could you not know it?
But when tested, it turns out very few people can remember all the features of the logo. One study of 85 people found that only about half could pick the correct logo out of a lineup of similar ones. And only one person could correctly draw it.
This isn’t an isolated example. A classic study from 1979 found that people similarly couldn’t draw a penny accurately or pick out a correctly drawn penny from incorrect ones.
People aren’t just bad at remembering things they see all the time, but also in actually knowing how they work. In a 2006 study, many people made significant errors when drawing a bicycle, like putting the chain around the front wheel as well as the back wheel. More than just a forgotten detail, putting the chain around both wheels shows a deeper misunderstanding of how a bicycle works. A bicycle with a chain around both wheels wouldn’t be able to turn.
It turns out people’s knowledge of how the world works is often fragmented and sketchy at best. They systematically overestimate their understanding of everyday devices and natural phenomena. People will tend to give themselves high ratings on how well they understand something, such as how bicycles or zippers work. But when they’re asked to actually explain the mechanics of these objects, their ratings of their understanding typically drop.
Just like how your knowledge of the world around you is imperfect, your knowledge about your own knowledge – also called metaknowledge – is often flawed. My field of cognitive science has been uncovering various gaps in human metaknowledge for decades.
If people are systematically overconfident about how well they understand things, why don’t they notice when they don’t understand something? And what can people do to better recognize the limits of their own knowledge?
Researchers have identified several factors behind people’s overconfidence in their knowledge.
One is that people confuse environmental support with understanding: The information is out in the world but not actually in your head. With a bicycle or a zipper, all of the parts are visible to you, and you may confuse this transparency for an internal understanding of how they work. But until you go to use that knowledge by attempting to explain how they work, you may not recognize that you don’t understand how those parts interact.
A second factor is confusing different levels of analysis. People can often describe how something works at a very high level. You know that the engine of a car makes the car go, and the brakes slow and stop the vehicle. But confidence in your high-level understanding of the car may bias you to think you also have a good grasp of the finer details, like how the engine pistons and brake pads work.
Additionally, people can be blind to the ways their knowledge shapes their own perception. In one study, researchers had participants tap out the tune to a popular song. On average, the tappers thought listeners would be able to identify the song about 50% of the time. But when listeners had to identify the tapped song, they actually could identify it only 2.5% of the time. The tappers didn’t realize how much their knowledge was making identifying the song seem easy to them.
This disconnect has consequences beyond whether someone else can understand your Morse code version of a song. When teaching people, whether in formal classroom settings or through casual mentorship, you can sometimes have an expert blind spot: the inability to recognize the difficulties beginners face when learning something you have expertise in.
Building expertise often involves internalizing knowledge to the point where it becomes invisible to you. You draw on knowledge you don’t realize you have, making it hard to relate to learners who lack this knowledge – and, of course, hard for learners to relate to your teaching. You might have experienced this when you’ve gotten partway through explaining something, only to realize you’ve been using jargon you forgot isn’t common knowledge and lost your listener.
How to address metaknowledge failures
Your metaknowledge can fail in two directions: You can think you know more than you do, and you can be blind to how much you’re relying on knowledge you do have. Each calls for a different response to correct it.
When you’re overconfident in your knowledge, the remedy is using that knowledge. You’ll quickly realize how much you actually understand and dial down your confidence. Challenging yourself to actually try to walk through how something works is a great exercise in intellectual humility – that is, recognizing that you may be wrong – and can keep you from getting out over your skis.
Building a greater appreciation for what you know is more difficult. You can’t simply unlearn what you’ve internalized. But what this challenge shows is that, to some extent, knowing a subject and knowing how to teach it are two separate skills. Some experts are great teachers, but not simply by virtue of being experts. Recognizing that you have to approach teaching with humility, and that your expertise doesn’t automatically make you a skilled teacher, can go a long way toward making you a better teacher and mentor.
These aren’t easy and quick fixes to failures of metaknowledge. Both require ongoing intellectual humility and a willingness to distrust your own confidence. But acknowledging the fallibility of your own metaknowledge is a good place to start.


 MP Materials’ Mountain Pass mine and processing facility in California was for years the only U.S. rare earth elements mine.


.svg)
.jpg)