
By RoboForex Analytical Department
The USDJPY pair is currently stabilising around 141.44 on Wednesday, following a brief strengthening of the US dollar which impacted the yen negatively the previous day. Despite this, the overarching downward trend for the pair persists.
Tuesday witnessed strong US retail sales data, bolstering the dollar’s strength temporarily and leading to a correction in the JPY. However, as the week progresses, attention is also turning towards the Bank of Japan (BoJ), which is holding its policy meeting alongside the Federal Reserve’s gathering.
The baseline expectation is that the BoJ will maintain its interest rate unchanged. Nevertheless, signals might emerge from the meeting indicating a readiness to tighten monetary policy later in the year. With two more meetings scheduled before year-end, in October and December, investor anticipation is growing for a potential rate hike in December, although expectations for October remain very low.
Today’s focus is heavily on the Fed, which is widely anticipated to cut rates by 50 basis points, marking the first rate reduction in four years. This significant move could impact global currency dynamics, including the USDJPY pair.
Recent statistics from Japan showed only a minimal rise in imports over the past five months and subdued growth in exports for August, adding to the complex economic landscape.
Free Reports:
 Download Our Metatrader 4 Indicators – Put Our Free MetaTrader 4 Custom Indicators on your charts when you join our Weekly Newsletter
 Get our Weekly Commitment of Traders Reports - See where the biggest traders (Hedge Funds and Commercial Hedgers) are positioned in the futures markets on a weekly basis.
Overall sentiment towards the yen remains positive, bolstered by the BoJ’s cautious approach to gradually tightening monetary conditions.
Technical analysis of USDJPY
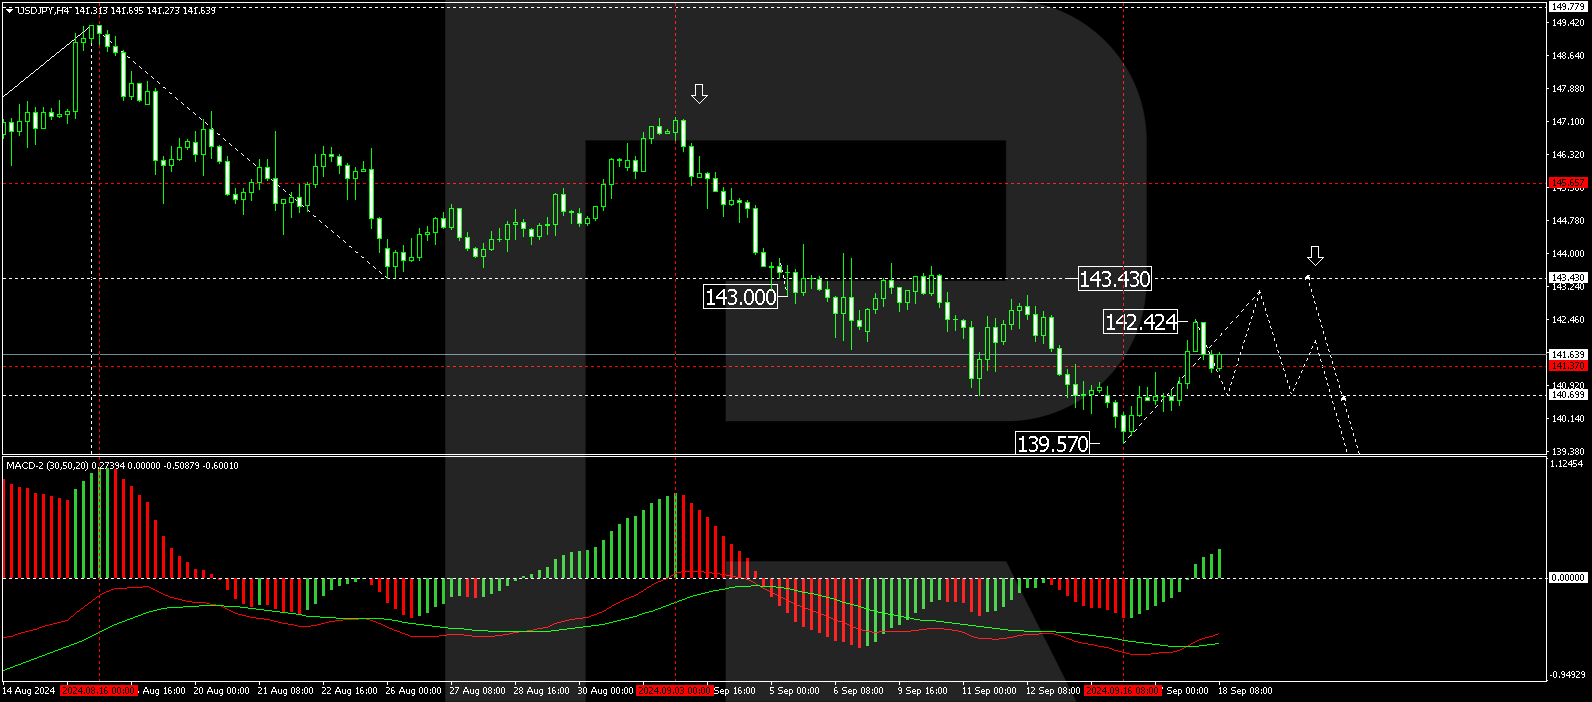
The USDJPY market has previously formed a consolidation range just below the level of 141.26, and with an upward breach of this range, the target at 142.42 was achieved. A corrective move to 141.22 has been established, and a further rise to 143.20 is anticipated. Upon reaching this peak, the potential for a new decline towards 137.77 will be considered. The MACD indicator supports this view, with the signal line below zero but pointing upwards, suggesting upward momentum in the short term.
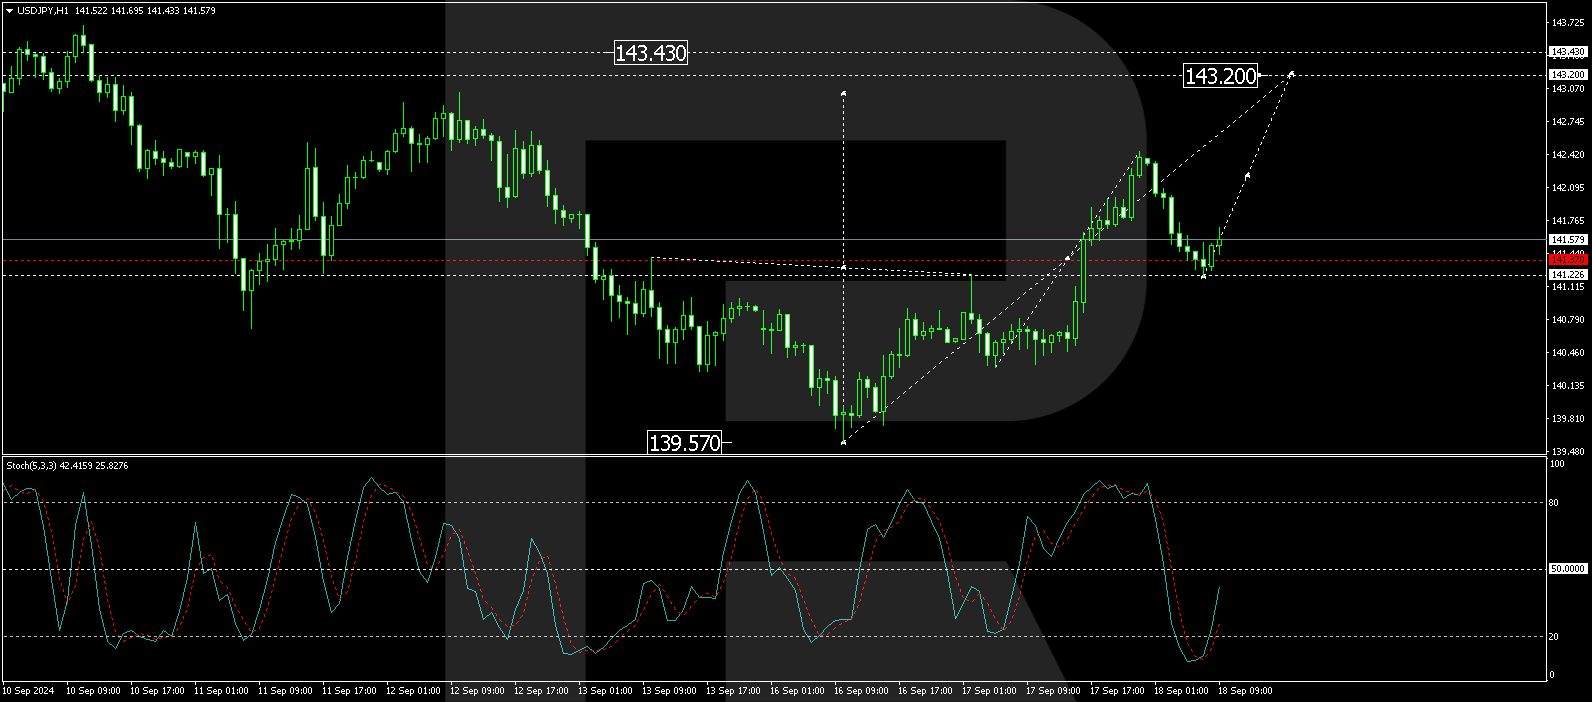
On the H1 chart, following the completion of the corrective wave to 141.22, the market is expected to continue its upward trajectory towards 143.20. After achieving this level, a new decline to 141.20 is anticipated, with a breach below this level potentially signalling a continuation of the downward trend towards 137.77. The Stochastic oscillator, with its signal line above 20 and directed upwards, corroborates the likelihood of further upward movement before a potential reversal.
Disclaimer
Any forecasts contained herein are based on the author’s particular opinion. This analysis may not be treated as trading advice. RoboForex bears no responsibility for trading results based on trading recommendations and reviews contained herein.

- The Tech‑heavy NASDAQ Index jumped by more than 3.3%. The offshore yuan is trading at its highest level since 2023 Jul 31, 2026
- USD/JPY After Volatility: Multiple Events in One Day Jul 31, 2026
- The US indices sell off amid renewed US-Iran clashes. Oil jumps by 7% Jul 30, 2026
- USD/JPY Temporary in Equilibrium: Multiple Factors in Focus Jul 30, 2026
- GBP/USD at Month’s Lows: The Outlook Remains Weak Jul 29, 2026
- Crude oil falls below $80 per barrel. Australia sees inflation slowdown Jul 29, 2026
- The US Tech sector hit by sell‑off. Oil prices decline on renewed negotiations Jul 28, 2026
- Gold Declines, Focus on Fed and Falling Oil Prices Jul 28, 2026
- This week will be one of the most crowded for central‑bank meetings Jul 27, 2026
- EUR/USD Ahead of a Key Week: Holding Near Lows Jul 27, 2026
