
By RoboForex Analytical Department
Gold prices remained stable at around $2580 per troy ounce on Tuesday, hovering close to their record highs. This resilience in the gold market is largely driven by the weakening US dollar and heightened expectations for a substantial interest rate cut by the Federal Reserve.
Current projections from the CME FedWatch tool indicate a 67% likelihood of a 50 basis point cut in today’s Fed meeting, a significant increase from the 40% chance noted yesterday. Additionally, there’s a 33% probability of a more modest 25 basis point reduction. These expectations have significantly influenced market sentiment, prompting investors to flock to gold as a protective asset.
Recent geopolitical events, such as the attempted assassination of US presidential candidate Donald Trump, have also underscored the metal’s appeal as a safe haven, leading to a spike in demand during times of perceived instability.
The potential easing of US monetary policy, expected to be confirmed in Wednesday’s Fed announcement, further bolsters gold’s attractiveness. With its lack of coupon income, gold becomes more appealing during periods when yields on US government bonds are falling, and the Dollar Index (DXY) is weakening.
Technical analysis of Gold (XAU/USD)
Free Reports:
 Sign Up for Our Stock Market Newsletter – Get updated on News, Charts & Rankings of Public Companies when you join our Stocks Newsletter
 Get our Weekly Commitment of Traders Reports - See where the biggest traders (Hedge Funds and Commercial Hedgers) are positioned in the futures markets on a weekly basis.
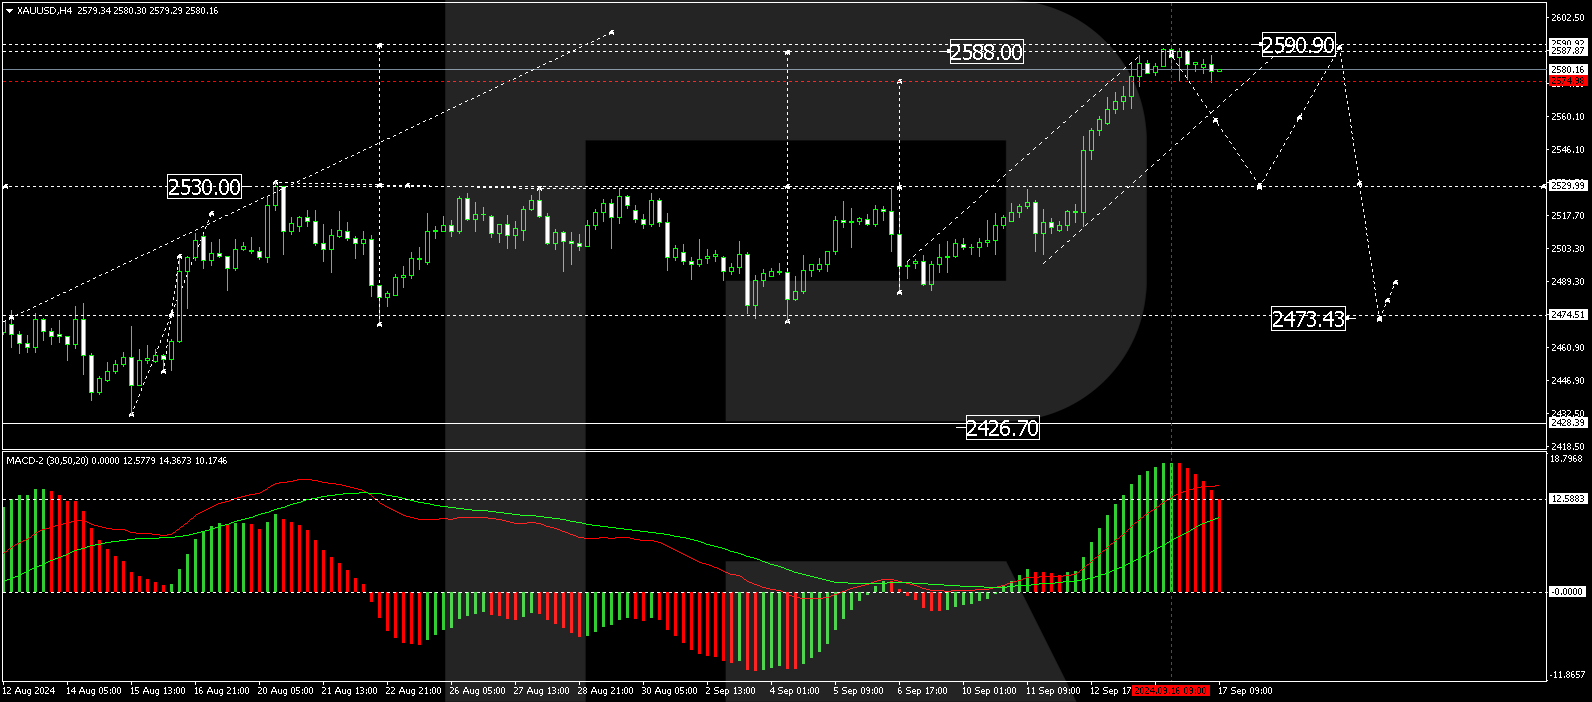
Gold broke through the consolidation range at 2530.00 and executed a growth wave up to 2586.00. The market has now reached the expansion potential of this range and is forming a new consolidation zone at these highs. The primary expectation is for a downward move to 2555.50, potentially extending into a corrective phase towards 2530.00. The MACD indicator supports this scenario, showing signal lines above zero but starting a downward trajectory, indicating the potential for a forthcoming decline.
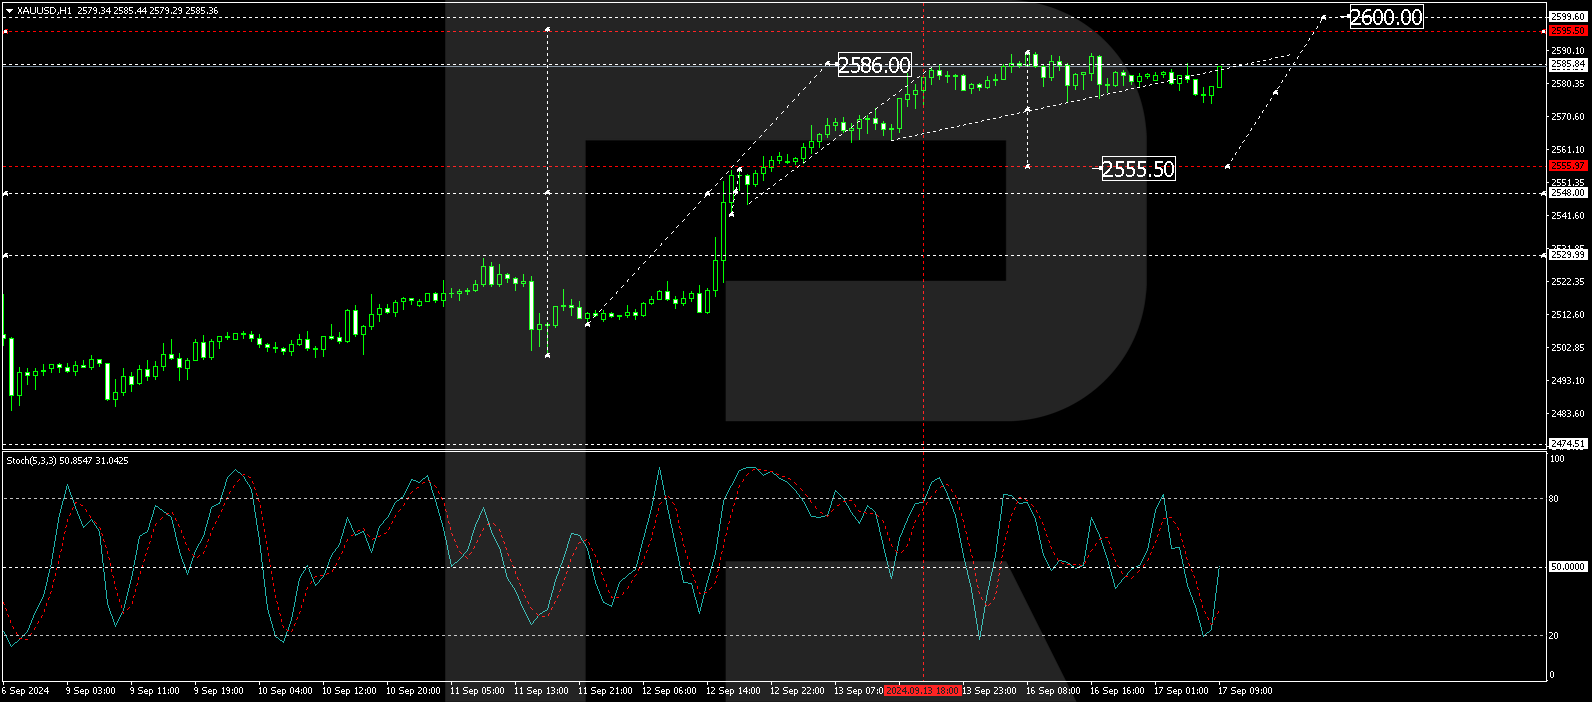
On the H1 chart, gold reached up to 2588.88 and is currently consolidating just below this peak. A break below this consolidation could lead to a move down to 2555.50. Conversely, a break above could briefly push prices towards 2600.00 before a potential reversal to 2530.00. The Stochastic oscillator, with its signal line below 50 and pointing sharply downward towards 20, corroborates this expected downward movement.
Disclaimer
Any forecasts contained herein are based on the author’s particular opinion. This analysis may not be treated as trading advice. RoboForex bears no responsibility for trading results based on trading recommendations and reviews contained herein.

- The Tech‑heavy NASDAQ Index jumped by more than 3.3%. The offshore yuan is trading at its highest level since 2023 Jul 31, 2026
- USD/JPY After Volatility: Multiple Events in One Day Jul 31, 2026
- The US indices sell off amid renewed US-Iran clashes. Oil jumps by 7% Jul 30, 2026
- USD/JPY Temporary in Equilibrium: Multiple Factors in Focus Jul 30, 2026
- GBP/USD at Month’s Lows: The Outlook Remains Weak Jul 29, 2026
- Crude oil falls below $80 per barrel. Australia sees inflation slowdown Jul 29, 2026
- The US Tech sector hit by sell‑off. Oil prices decline on renewed negotiations Jul 28, 2026
- Gold Declines, Focus on Fed and Falling Oil Prices Jul 28, 2026
- This week will be one of the most crowded for central‑bank meetings Jul 27, 2026
- EUR/USD Ahead of a Key Week: Holding Near Lows Jul 27, 2026