By RoboForex Analytical Department
The NZD/USD pair dropped to 0.5988 this Friday, marking a potential close lower for the fourth consecutive week. The strength of the US dollar continues to dominate the currency pair, fuelled by expectations of a moderate interest rate cut by the Federal Reserve and persistent demand for the USD amid geopolitical tensions in the Middle East and the lead-up to the US presidential election.
Reserve Bank of New Zealand Governor Adrian Orr recently reaffirmed the central bank’s capability to maintain low and stable inflation, noting that the bank is vigilant and ready to act should market conditions necessitate intervention. These comments have solidified market expectations of a potential RBNZ rate cut in November, with a 50-basis-point reduction widely anticipated. Some speculate that a more aggressive cut of 75 basis points could be on the table if conditions worsen.
Recent data indicating a drop in consumer confidence in New Zealand after three months of gains has added to the bearish sentiment surrounding the NZD.
NZD/USD technical analysis
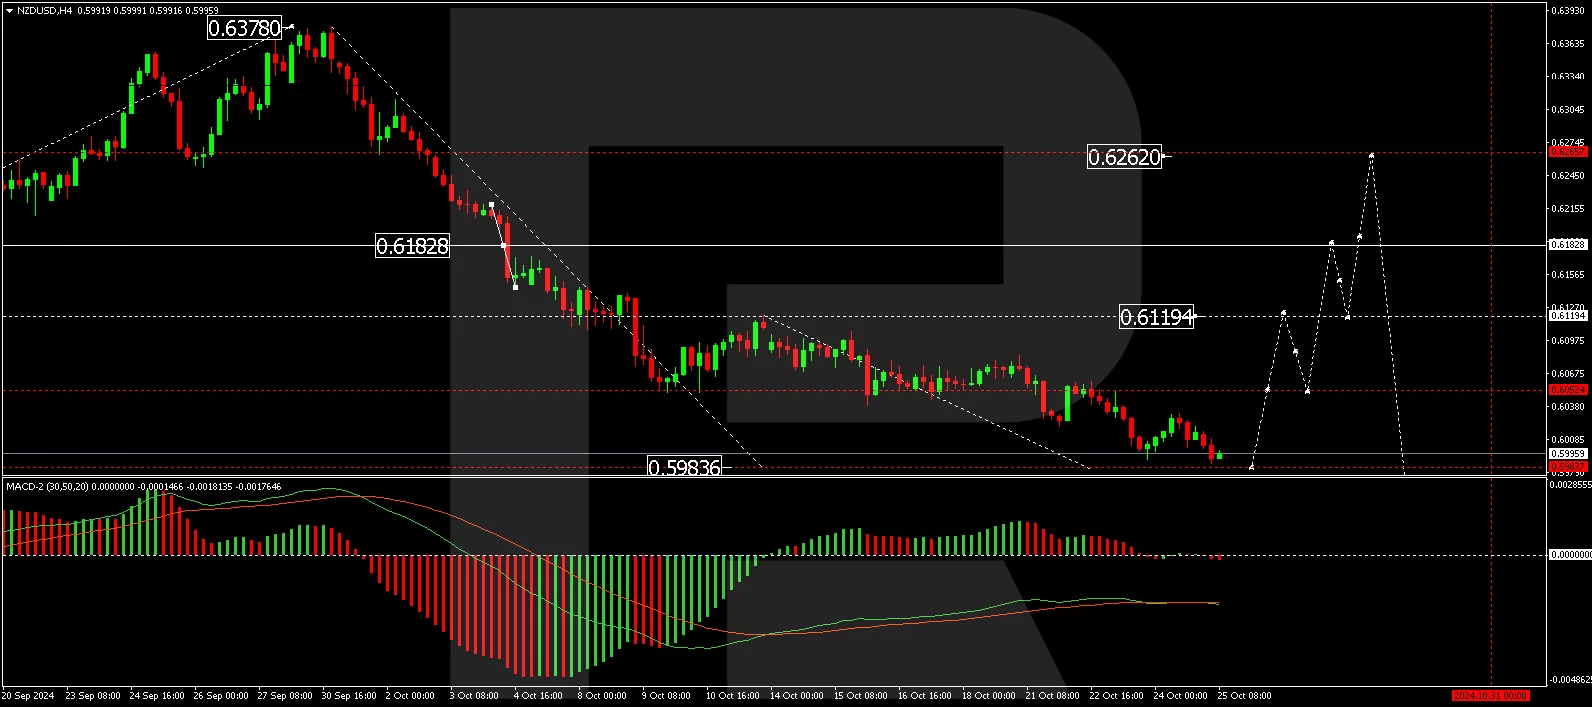
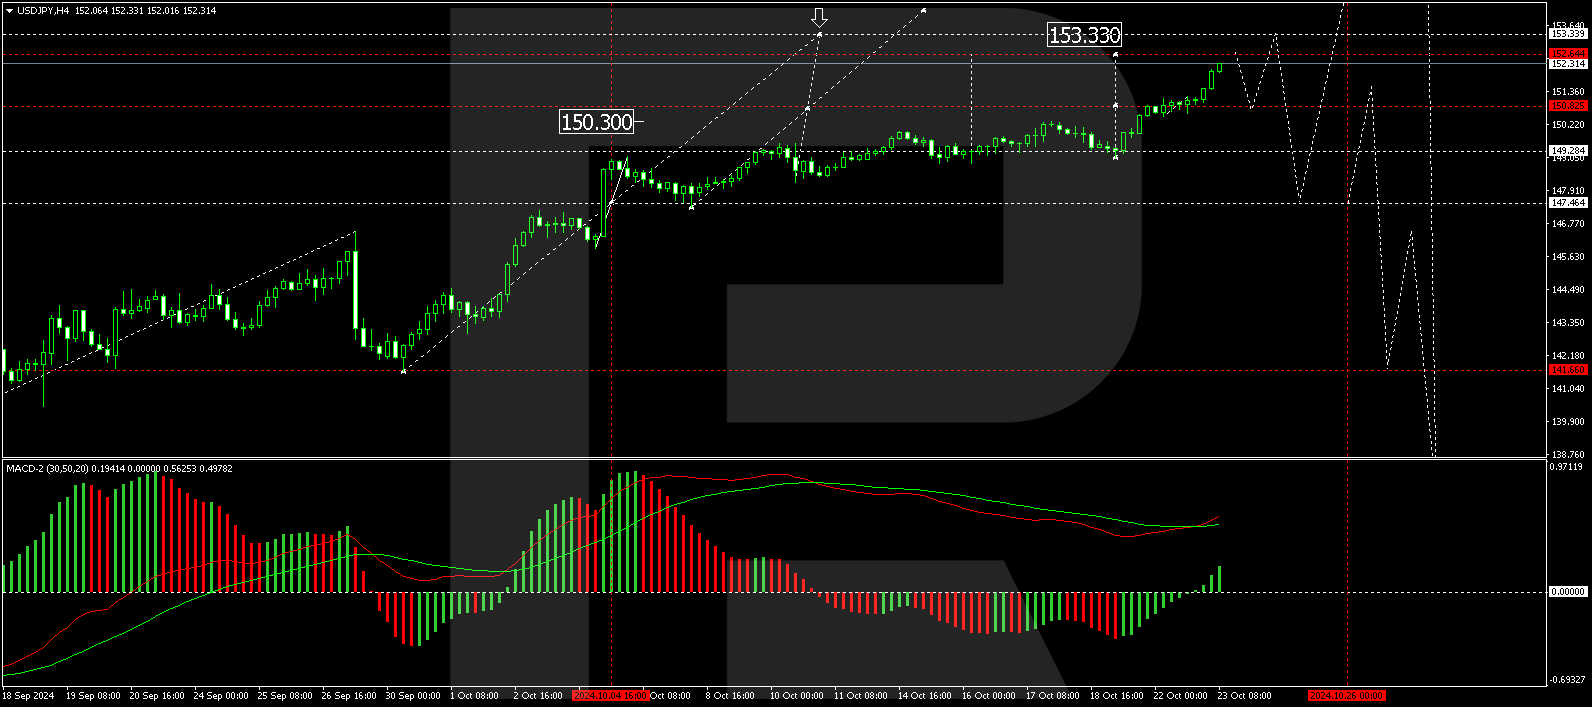
The NZD/USD pair is extending its downward trajectory towards 0.5983. Following the achievement of this level, a corrective move towards 0.6182 could be in the offing, with an intermediate target at 0.6119. This potential rebound is supported by the MACD indicator, whose signal line remains below zero but is trending upwards, suggesting a possible easing of downward pressure.
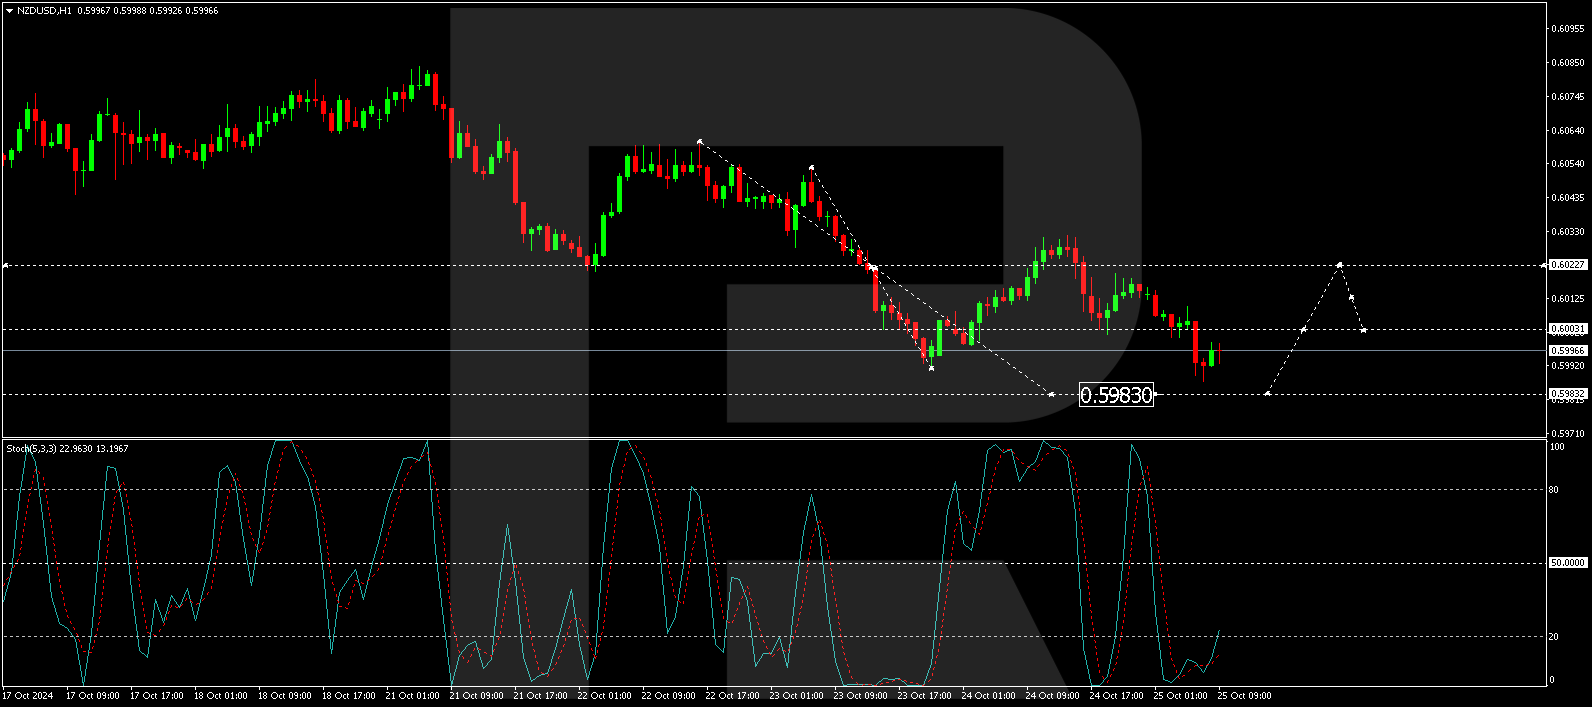
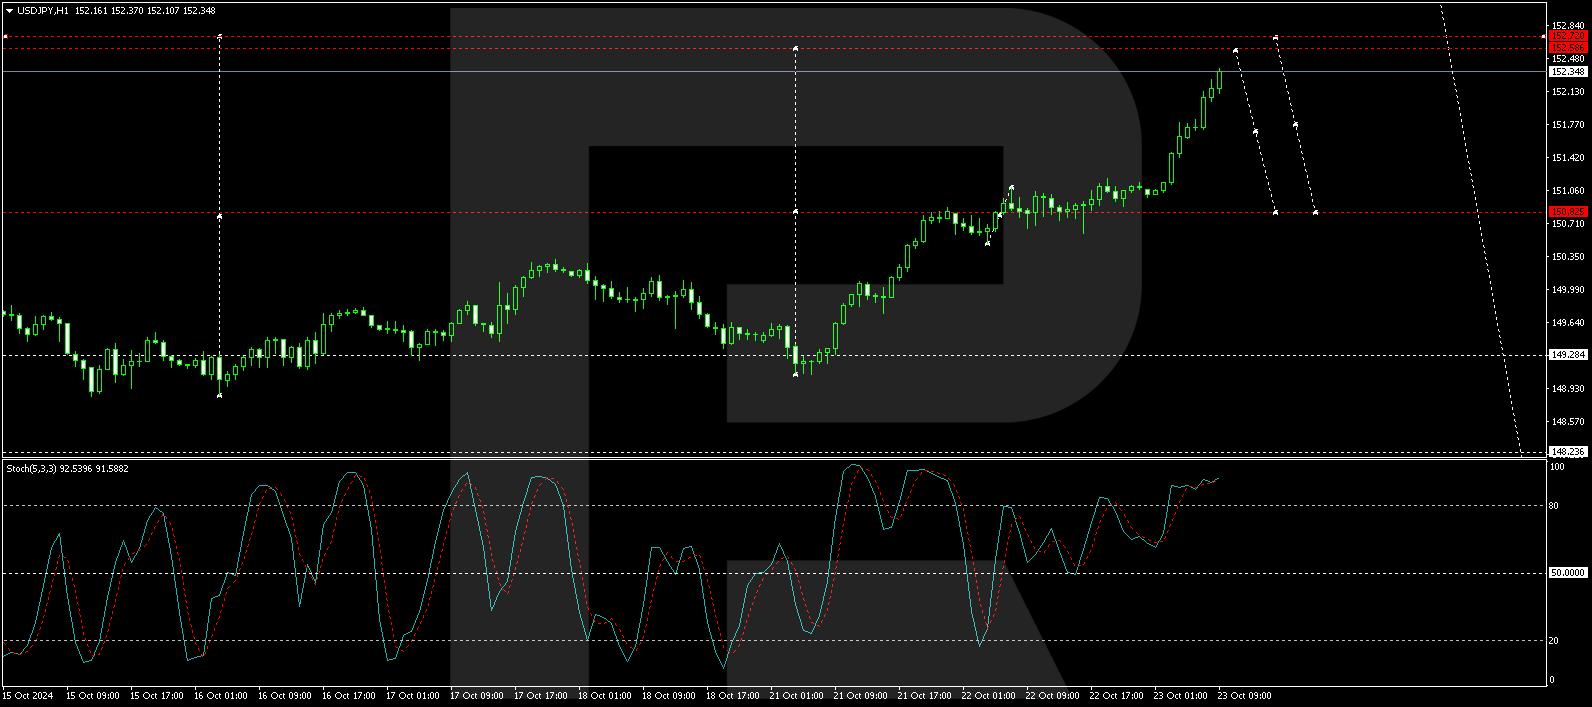
On the hourly chart, NZD/USD has established a consolidation pattern around the 0.6000 level and has since dipped to a local low of 0.5987. A brief recovery to 0.6000 may occur as a test from below before another possible descent to 0.5983. Should this level be reached, it would likely mark the exhaustion of the current downward wave. The Stochastic oscillator reinforces this outlook, with its signal line positioned below 20 but curving upwards, indicating the potential for a short-term upward correction.
Disclaimer
Any forecasts contained herein are based on the author’s particular opinion. This analysis may not be treated as trading advice. RoboForex bears no responsibility for trading results based on trading recommendations and reviews contained herein.


 Daron Acemoglu, Simon Johnson and James A. Robinson.