
By RoboForex Analytical Department
Gold prices soared to a new all-time high, with the troy ounce surpassing 2614 USD. This surge is primarily driven by expectations of additional interest rate cuts and ongoing geopolitical tensions, which enhance gold’s appeal as a safe-haven asset.
Following the US Federal Reserve’s decision last week to reduce its interest rate by 50 basis points – the first such cut in four years – the market expects an equivalent reduction by the year’s end. This week, attention is focused on upcoming US macroeconomic releases, including the Core PCE report and personal income and expenditures data. These indicators will provide insights into the potential direction of future Fed rate adjustments.
Gold becomes increasingly attractive as an investment during periods of lower lending costs, which typically lead to reduced yields on government bonds and a lower Dollar Index (DXY). Unlike other assets, gold does not generate coupon income, making it more appealing when other yields decline.
Additionally, the escalation of hostilities between Israel and Gaza has further boosted demand for gold. In times of heightened global uncertainty and conflict, gold traditionally performs well as a defensive investment.
Despite some strengthening of the US dollar, this has not significantly impacted the upward trajectory of gold prices.
Free Reports:
 Sign Up for Our Stock Market Newsletter – Get updated on News, Charts & Rankings of Public Companies when you join our Stocks Newsletter
 Get our Weekly Commitment of Traders Reports - See where the biggest traders (Hedge Funds and Commercial Hedgers) are positioned in the futures markets on a weekly basis.
Technical analysis of gold (XAU/USD)
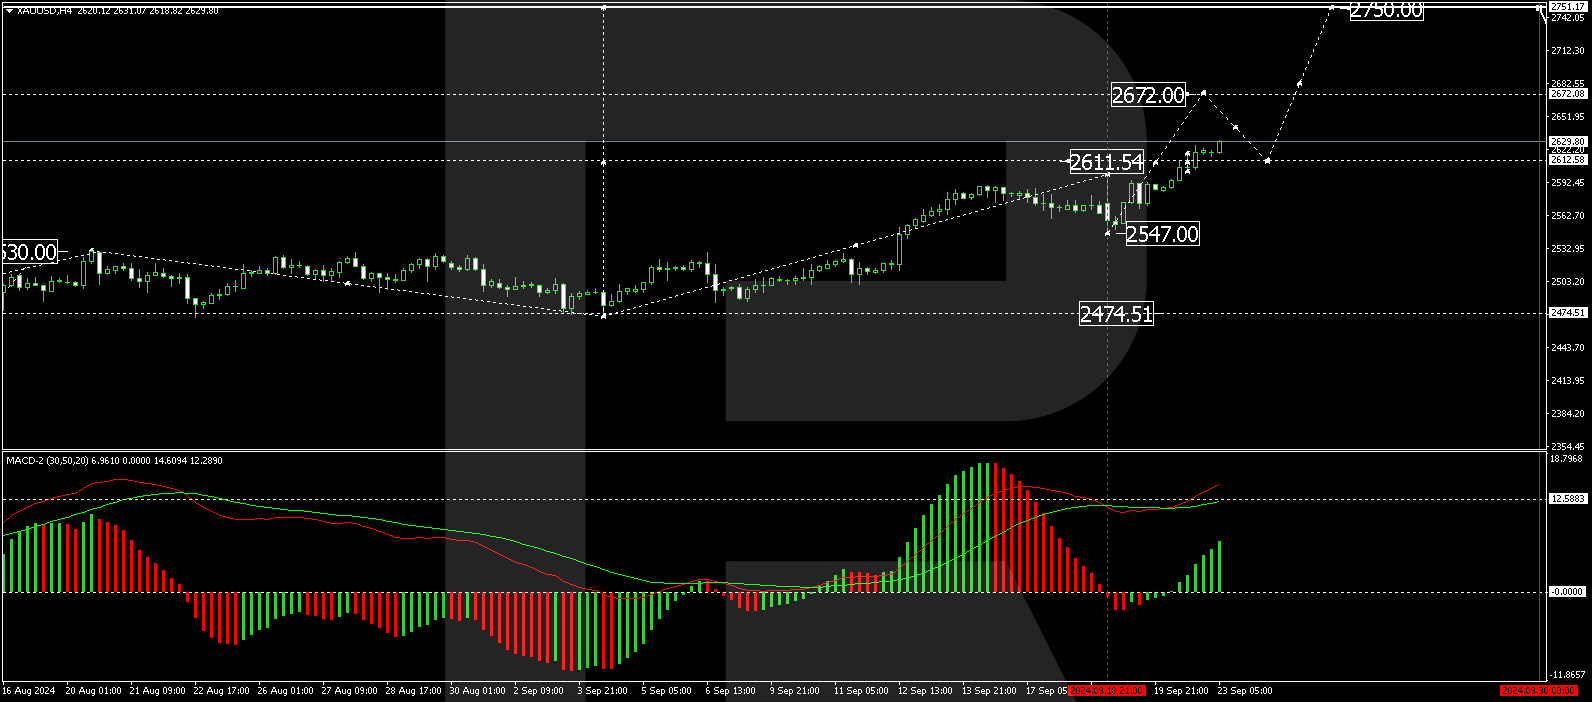
Gold has broken through the resistance at 2611.00 USD and is now targeting 2672.00 USD. Upon reaching this level, a corrective movement back to 2611.00 USD may occur, followed by another growth phase targeting 2750.00 USD. The MACD indicator supports this bullish outlook, with the signal line well above zero and ascending sharply.
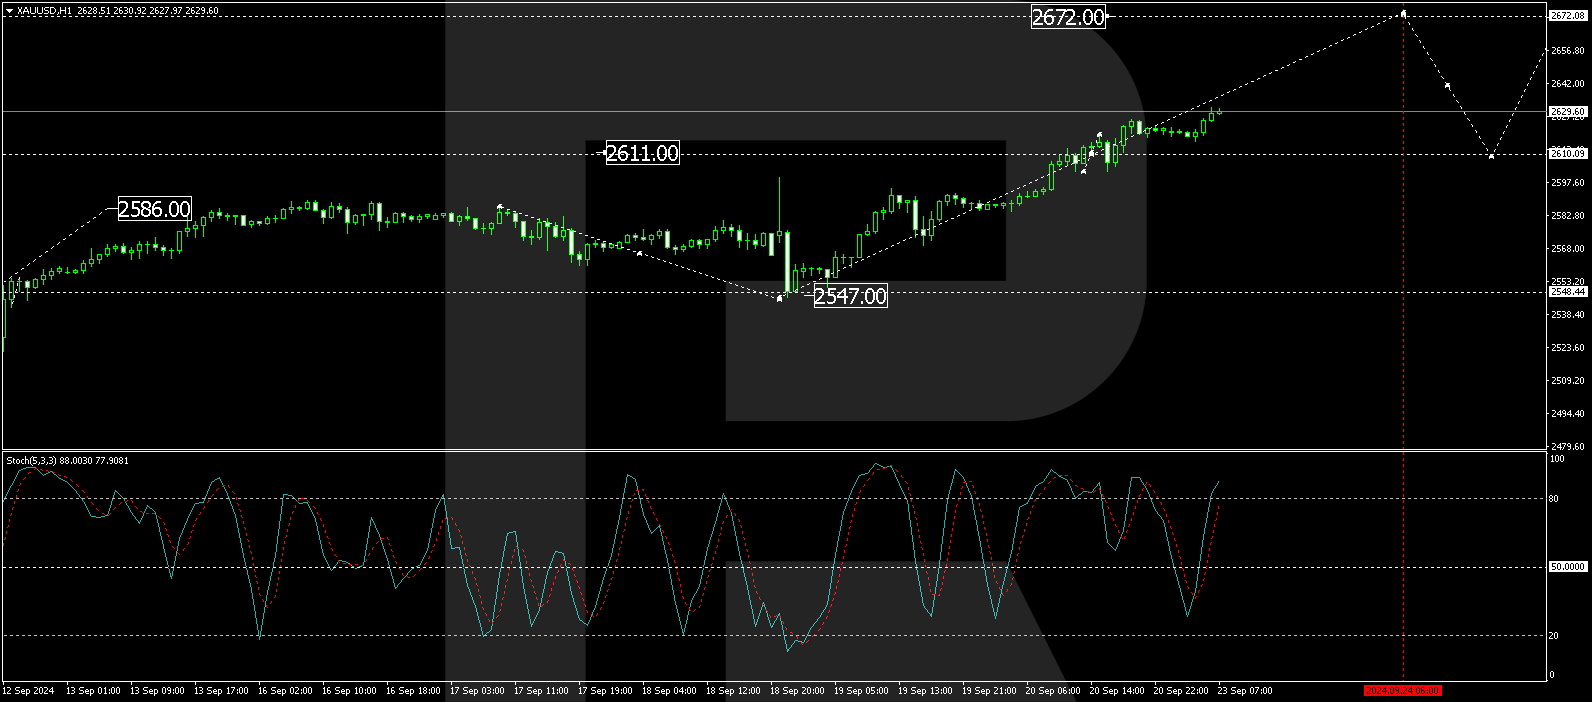
The H1 chart shows that gold has reached 2611.00 USD and is now consolidating around this level. The consolidation range is defined between 2603.00 USD and 2625.25 USD. A breakout above 2625.25 USD would likely lead to a continuation of the upward momentum towards 2672.00 USD, confirming the ongoing bullish trend. This scenario is corroborated by the Stochastic oscillator, with its signal line progressing towards 80, indicating sustained upward momentum.
Disclaimer
Any forecasts contained herein are based on the author’s particular opinion. This analysis may not be treated as trading advice. RoboForex bears no responsibility for trading results based on trading recommendations and reviews contained herein.

- The US and European stock indices are rising again amid renewed investor interest in the AI industry. Jul 10, 2026
- USD/JPY Falls as Yen Recovers Weekly Losses Jul 10, 2026
- Crude oil prices surged sharply by 7% in reaction to the rapid escalation of the conflict in the Middle East Jul 9, 2026
- Middle East Tensions Weigh on Gold Jul 9, 2026
- Pound Awaits Tighter Policy from Bank of England Jul 8, 2026
- The United States carried out airstrikes on Iran after Iran’s attacked tankers in the Strait of Hormuz. The RBNZ raised the interest rate to 2.5% Jul 8, 2026
- RoboForex Brings Full-Scale Trading to Telegram Jul 7, 2026
- Your Bourse Integrates TradingView Charts and Trading Platform Library with Trade Server Jul 7, 2026
- Yen Still Under Pressure: Markets Await Action from Authorities Jul 7, 2026
- Germany’s DAX Index has updated its all‑time high. OPEC+ countries have agreed to increase production Jul 7, 2026