By InvestMacro
Here are the latest charts and statistics for the Commitment of Traders (COT) data published by the Commodities Futures Trading Commission (CFTC).
The latest COT data is updated through Tuesday November 5th and shows a quick view of how large market participants (for-profit speculators and commercial traders) were positioned in the futures markets. All currency positions are in direct relation to the US dollar where, for example, a bet for the euro is a bet that the euro will rise versus the dollar while a bet against the euro will be a bet that the euro will decline versus the dollar.
Weekly Speculator Changes led by Euro & Swiss Franc
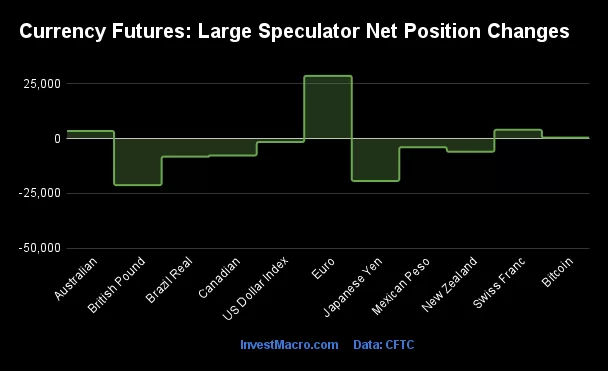
The COT currency market speculator bets were lower this week as four out of the eleven currency markets we cover had higher positioning while the other seven markets had lower speculator contracts.
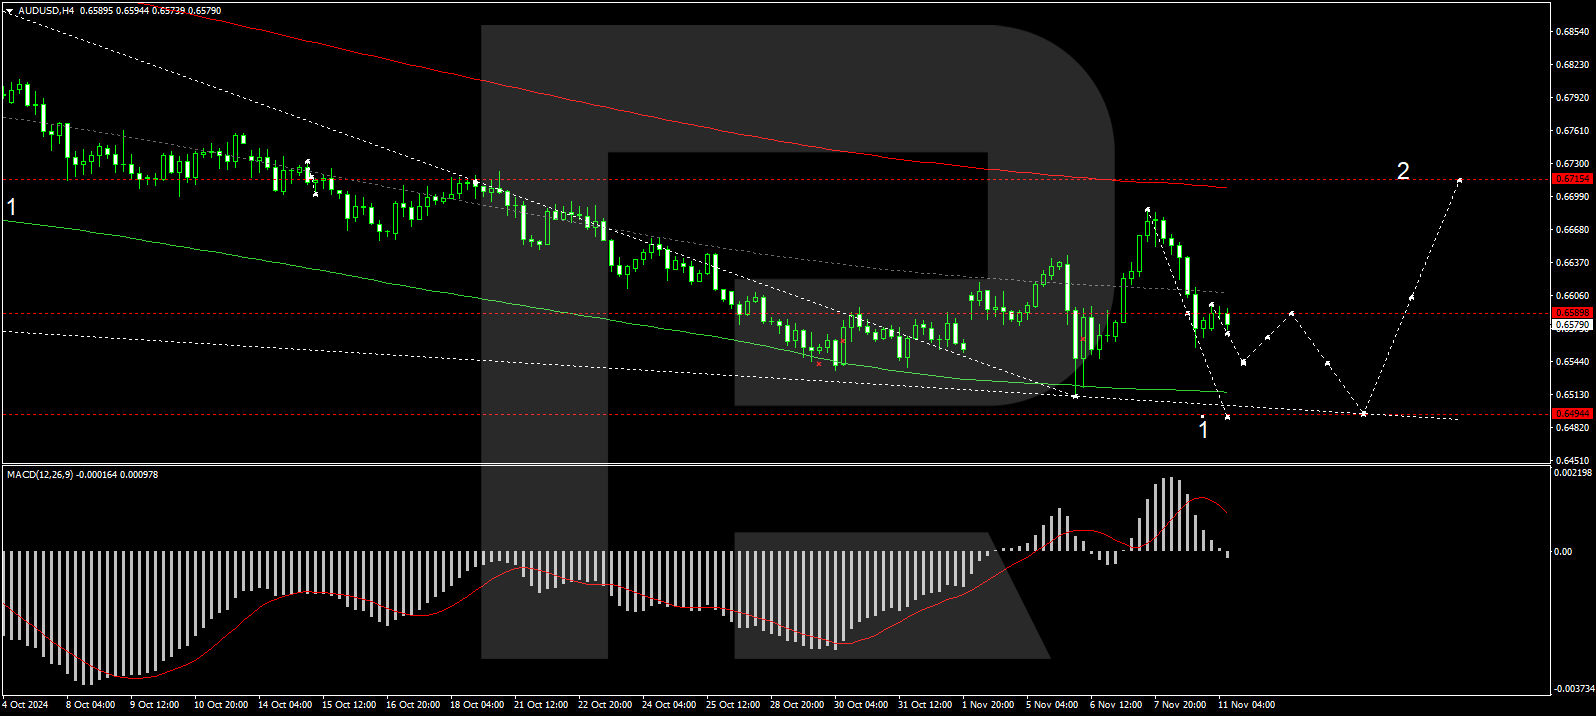
Leading the gains for the currency markets was the EuroFX (28,651 contracts) with the Swiss Franc (4,017 contracts), Australian Dollar (3,460 contracts) and Bitcoin (412 contracts) also having positive weeks.
The currencies seeing declines in speculator bets on the week were the British Pound (-21,272 contracts), the Japanese Yen (-19,350 contracts), the Brazilian Real (-8,256 contracts), the Canadian Dollar (-7,730 contracts), the New Zealand Dollar (-6,032 contracts), the Mexican Peso (-3,950 contracts) and with the US Dollar Index (-1,589 contracts) also seeing decreased bets on the week.
Currency Speculators boosted Euro bets, cut GBP & Yen bets on Election Day
Highlighting the COT currency’s data for the week was the sharp changes in positioning on the US Presidential election.
The Euro currency positions jumped by over +28,000 net contracts on the election day of Tuesday November 5th. The Euro positions had been falling sharply recently as speculators cut their bets for five straight weeks and for seven out of the previous eight weeks prior to Tuesday. This was an 8-week drop by -150,322 contracts for the Euro and had dropped the overall standing to -50,304 contracts on October 29th before this week’s turnaround.
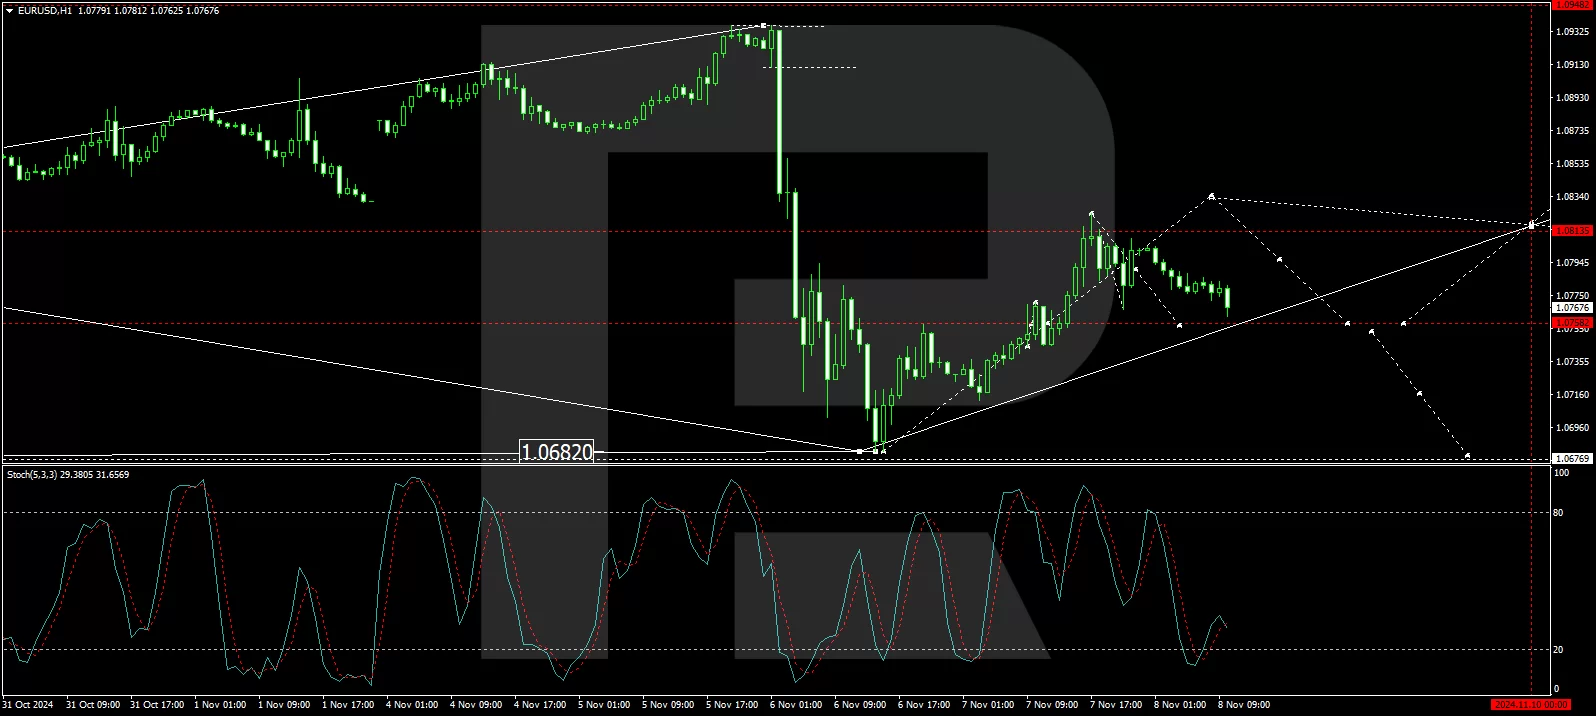
Despite this week’s boost in bets, the Euro exchange rate had a tough week and fell by over 1 percent against the US Dollar. The Euro has declined in five out of the past six weeks and has now slid from trading at 1.12 in late September to a 1.0729 close this week.
The British pound speculator bets this week dropped by over -21,000 contracts and decreased for the fifth consecutive week. The GBP speculator positions have fallen by a total of -48,681 contracts over these last five weeks and this weakness has brought the overall speculator standing down to a 19-week low, dating back to June 25th. The overall speculator position does remain bullish at a total of 45,084 contracts and has been in a continuous bullish level since May 21st, 2024.
The GBP exchange also has been on the weaker side lately and has now fallen from near 1.3400 in late September to this week’s closing price of approximately 1.2912.
The Japanese yen bets saw a big slide this week and the yen bets have been lower in each of the past six weeks. The total decline of spec bets in the past six weeks has reached -110,178 contracts and has taken the overall speculator standing down from a total of +66,011 contracts on September 17th to this week’s level of -44,167 contracts.
The yen exchange versus the USD has declined for six out of the past eight weeks with the US Dollar (USDJPY currency pair) going from around the 140.75 exchange rate in late September to this week’s close at approximately 152.60.
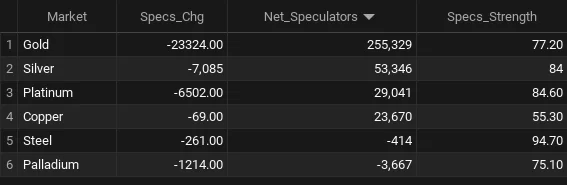
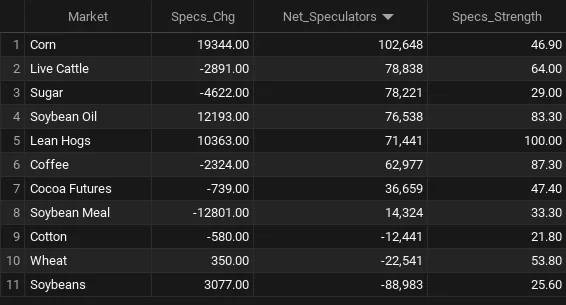
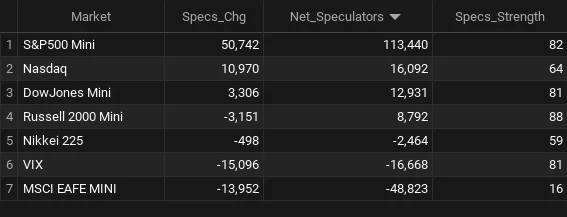
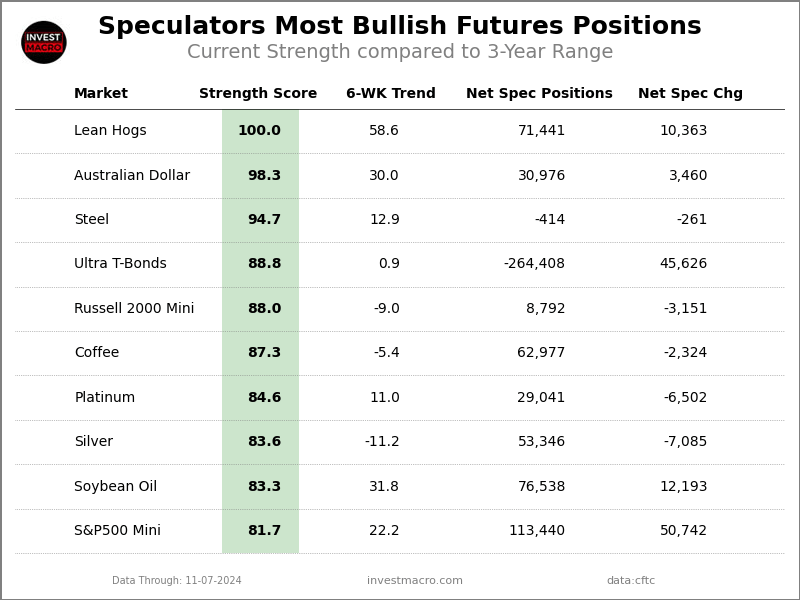
Currencies Net Speculators Leaderboard
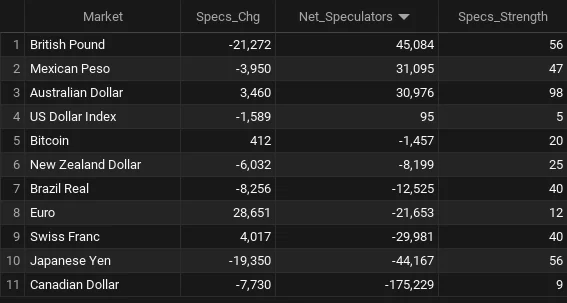
Legend: Weekly Speculators Change | Speculators Current Net Position | Speculators Strength Score compared to last 3-Years (0-100 range)
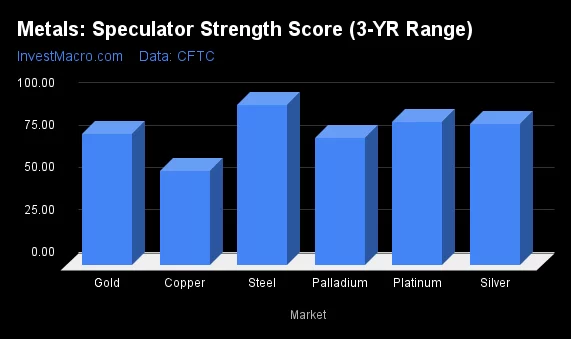
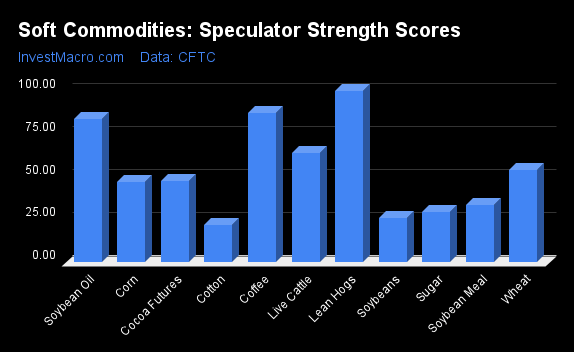
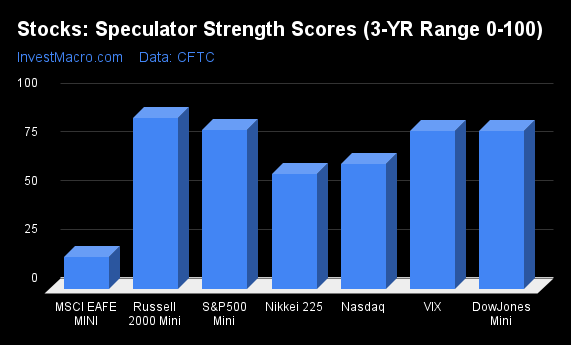
Strength Scores led by Australian Dollar
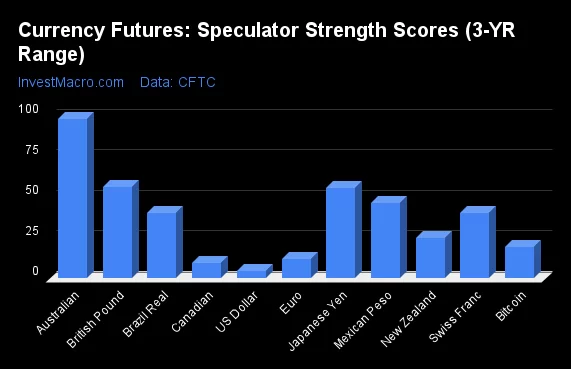
COT Strength Scores (a normalized measure of Speculator positions over a 3-Year range, from 0 to 100 where above 80 is Extreme-Bullish and below 20 is Extreme-Bearish) showed that the Australian Dollar (98 percent) leads the currency markets this week. The British Pound (56 percent) and the Japanese Yen (56 percent) come in as the next highest in the weekly strength scores.
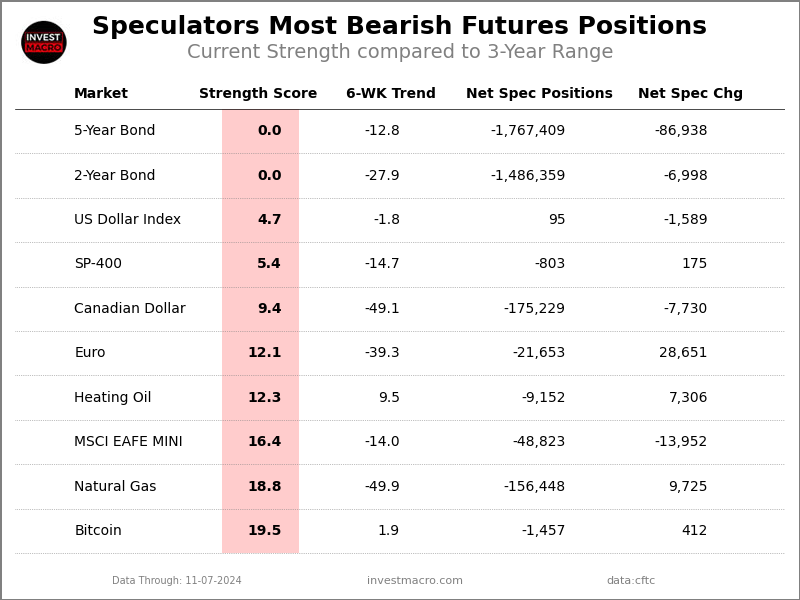
On the downside, the US Dollar Index (5 percent), the Canadian Dollar (9 percent), the EuroFX (12 percent) and Bitcoin (19.5 percent) come in at the lowest strength levels currently and are in Extreme-Bearish territory (below 20 percent).
3-Year Strength Statistics:
US Dollar Index (4.7 percent) vs US Dollar Index previous week (8.0 percent)
EuroFX (12.1 percent) vs EuroFX previous week (0.0 percent)
British Pound Sterling (56.4 percent) vs British Pound Sterling previous week (65.9 percent)
Japanese Yen (56.0 percent) vs Japanese Yen previous week (63.7 percent)
Swiss Franc (40.1 percent) vs Swiss Franc previous week (32.0 percent)
Canadian Dollar (9.4 percent) vs Canadian Dollar previous week (12.9 percent)
Australian Dollar (98.3 percent) vs Australian Dollar previous week (95.8 percent)
New Zealand Dollar (25.1 percent) vs New Zealand Dollar previous week (36.7 percent)
Mexican Peso (46.7 percent) vs Mexican Peso previous week (48.7 percent)
Brazilian Real (40.2 percent) vs Brazilian Real previous week (48.0 percent)
Bitcoin (19.5 percent) vs Bitcoin previous week (10.5 percent)
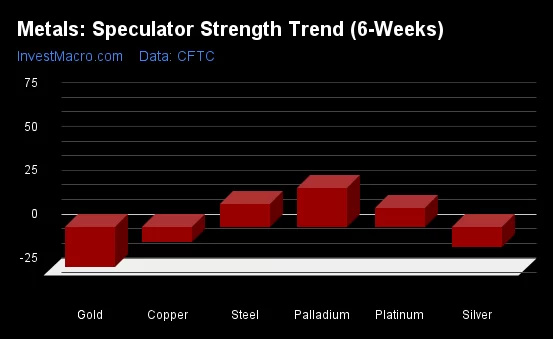
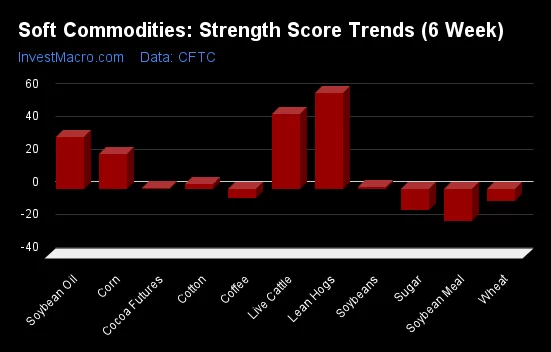
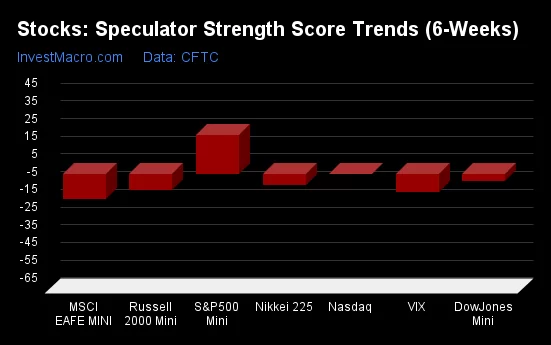
Australian Dollar & Brazilian Real top the 6-Week Strength Trends
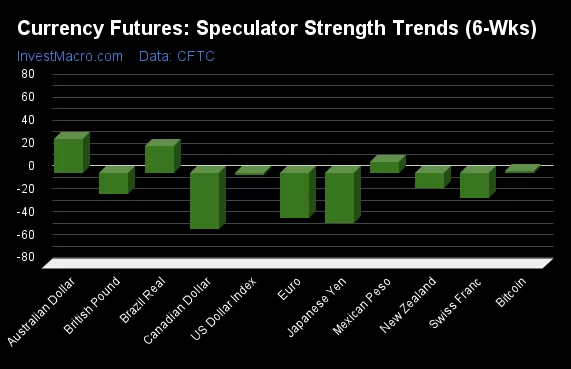
COT Strength Score Trends (or move index, calculates the 6-week changes in strength scores) showed that the Australian Dollar (30 percent) and the Brazilian Real (23 percent) lead the past six weeks trends for the currencies. The Mexican Peso (9 percent) and Bitcoin (2 percent) are the next highest positive movers in the 3-Year trends data.
The Canadian Dollar (-49 percent) leads the downside trend scores currently with the Japanese Yen (-44 percent), EuroFX (-39 percent) and the Swiss Franc (-22 percent) following next with lower trend scores.
3-Year Strength Trends:
US Dollar Index (-1.8 percent) vs US Dollar Index previous week (-0.2 percent)
EuroFX (-39.3 percent) vs EuroFX previous week (-50.5 percent)
British Pound Sterling (-18.8 percent) vs British Pound Sterling previous week (1.5 percent)
Japanese Yen (-44.0 percent) vs Japanese Yen previous week (-32.6 percent)
Swiss Franc (-21.7 percent) vs Swiss Franc previous week (-34.2 percent)
Canadian Dollar (-49.1 percent) vs Canadian Dollar previous week (-42.3 percent)
Australian Dollar (30.0 percent) vs Australian Dollar previous week (48.0 percent)
New Zealand Dollar (-13.0 percent) vs New Zealand Dollar previous week (-0.5 percent)
Mexican Peso (9.2 percent) vs Mexican Peso previous week (13.4 percent)
Brazilian Real (23.5 percent) vs Brazilian Real previous week (26.6 percent)
Bitcoin (1.9 percent) vs Bitcoin previous week (-19.6 percent)
Individual COT Forex Markets:
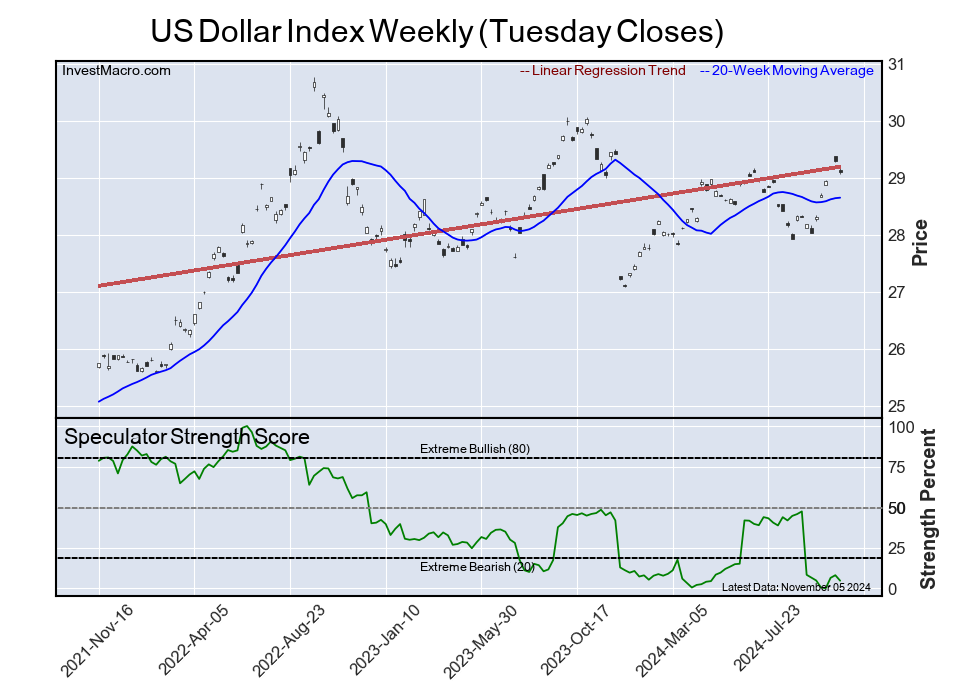
US Dollar Index Futures:
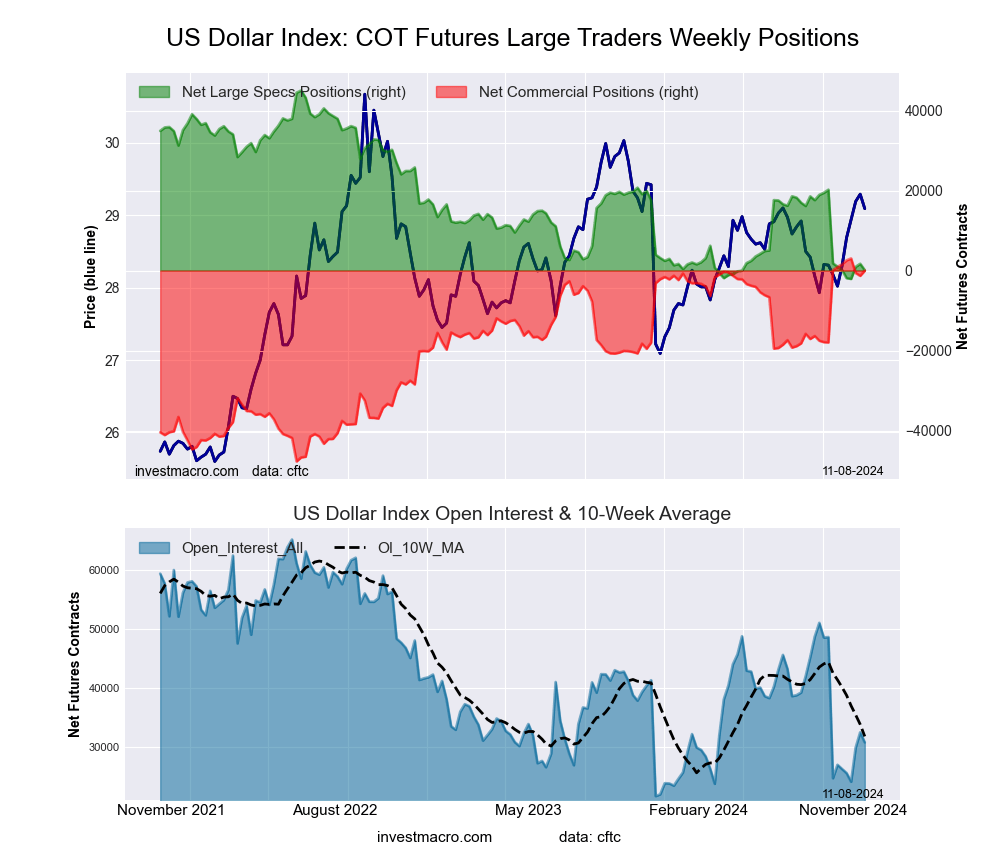 The US Dollar Index large speculator standing this week came in at a net position of 95 contracts in the data reported through Tuesday. This was a weekly lowering of -1,589 contracts from the previous week which had a total of 1,684 net contracts.
This week’s current strength score (the trader positioning range over the past three years, measured from 0 to 100) shows the speculators are currently Bearish-Extreme with a score of 4.7 percent. The commercials are Bullish-Extreme with a score of 94.0 percent and the small traders (not shown in chart) are Bearish with a score of 22.9 percent.
Price Trend-Following Model: Strong Uptrend
Our weekly trend-following model classifies the current market price position as: Strong Uptrend.
| US DOLLAR INDEX Statistics | SPECULATORS | COMMERCIALS | SMALL TRADERS |
| – Percent of Open Interest Longs: | 66.0 | 19.5 | 9.9 |
| – Percent of Open Interest Shorts: | 65.7 | 19.6 | 10.1 |
| – Net Position: | 95 | -46 | -49 |
| – Gross Longs: | 20,332 | 6,004 | 3,049 |
| – Gross Shorts: | 20,237 | 6,050 | 3,098 |
| – Long to Short Ratio: | 1.0 to 1 | 1.0 to 1 | 1.0 to 1 |
| NET POSITION TREND: | | | |
| – Strength Index Score (3 Year Range Pct): | 4.7 | 94.0 | 22.9 |
| – Strength Index Reading (3 Year Range): | Bearish-Extreme | Bullish-Extreme | Bearish |
| NET POSITION MOVEMENT INDEX: | | | |
| – 6-Week Change in Strength Index: | -1.8 | -1.9 | 19.0 |
Euro Currency Futures:
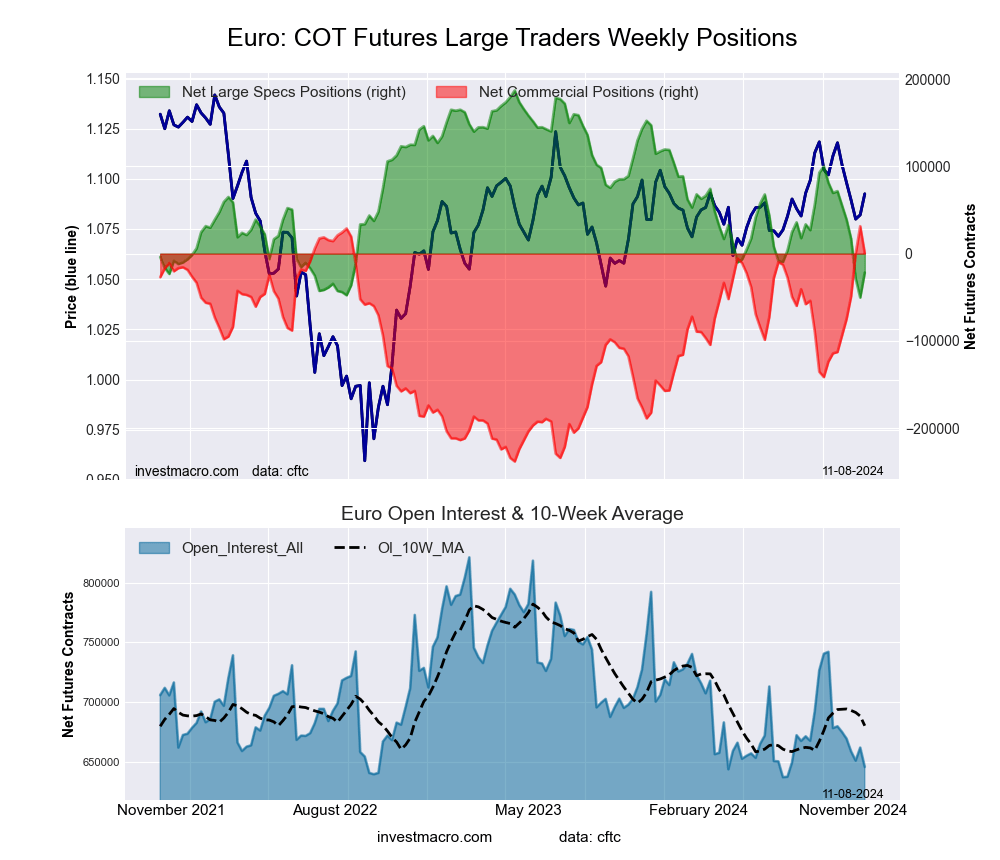 The Euro Currency large speculator standing this week came in at a net position of -21,653 contracts in the data reported through Tuesday. This was a weekly gain of 28,651 contracts from the previous week which had a total of -50,304 net contracts.
This week’s current strength score (the trader positioning range over the past three years, measured from 0 to 100) shows the speculators are currently Bearish-Extreme with a score of 12.1 percent. The commercials are Bullish-Extreme with a score of 88.6 percent and the small traders (not shown in chart) are Bearish-Extreme with a score of 17.9 percent.
Price Trend-Following Model: Weak Uptrend
Our weekly trend-following model classifies the current market price position as: Weak Uptrend.
| EURO Currency Statistics | SPECULATORS | COMMERCIALS | SMALL TRADERS |
| – Percent of Open Interest Longs: | 24.8 | 59.1 | 11.8 |
| – Percent of Open Interest Shorts: | 28.1 | 59.0 | 8.5 |
| – Net Position: | -21,653 | 617 | 21,036 |
| – Gross Longs: | 159,900 | 381,704 | 75,889 |
| – Gross Shorts: | 181,553 | 381,087 | 54,853 |
| – Long to Short Ratio: | 0.9 to 1 | 1.0 to 1 | 1.4 to 1 |
| NET POSITION TREND: | | | |
| – Strength Index Score (3 Year Range Pct): | 12.1 | 88.6 | 17.9 |
| – Strength Index Reading (3 Year Range): | Bearish-Extreme | Bullish-Extreme | Bearish-Extreme |
| NET POSITION MOVEMENT INDEX: | | | |
| – 6-Week Change in Strength Index: | -39.3 | 42.1 | -45.8 |
British Pound Sterling Futures:
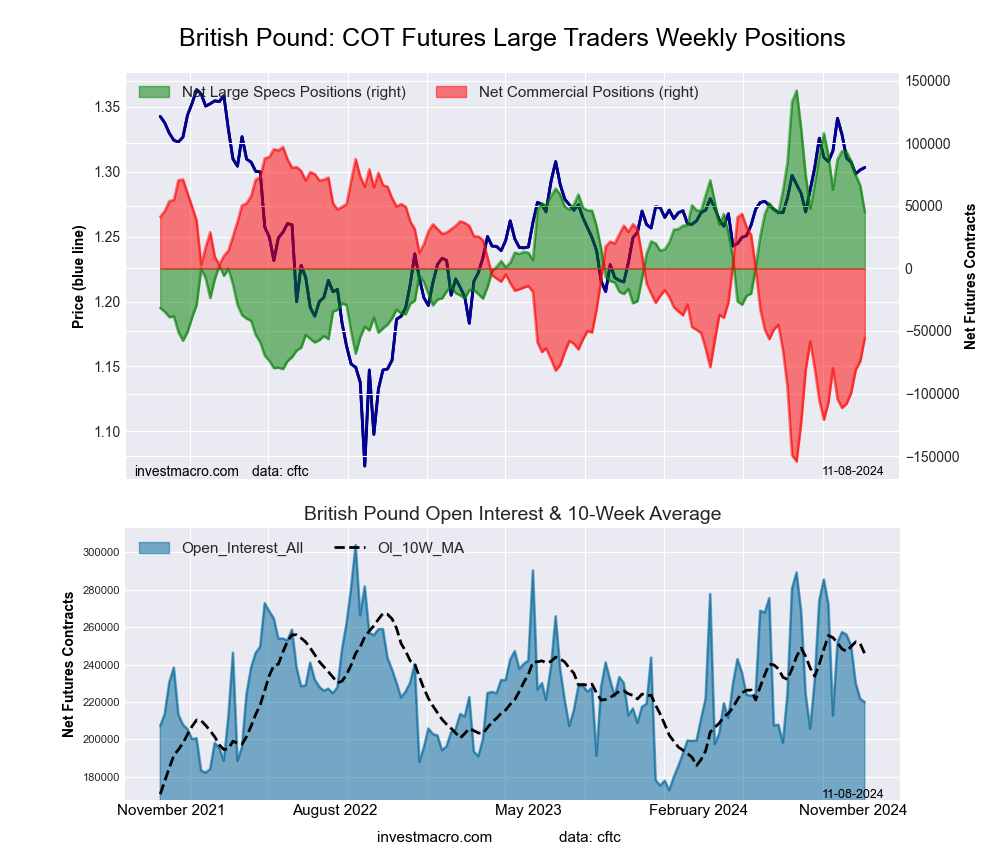 The British Pound Sterling large speculator standing this week came in at a net position of 45,084 contracts in the data reported through Tuesday. This was a weekly fall of -21,272 contracts from the previous week which had a total of 66,356 net contracts.
This week’s current strength score (the trader positioning range over the past three years, measured from 0 to 100) shows the speculators are currently Bullish with a score of 56.4 percent. The commercials are Bearish with a score of 39.3 percent and the small traders (not shown in chart) are Bullish-Extreme with a score of 84.2 percent.
Price Trend-Following Model: Weak Uptrend
Our weekly trend-following model classifies the current market price position as: Weak Uptrend.
| BRITISH POUND Statistics | SPECULATORS | COMMERCIALS | SMALL TRADERS |
| – Percent of Open Interest Longs: | 54.9 | 25.7 | 16.2 |
| – Percent of Open Interest Shorts: | 34.4 | 51.0 | 11.4 |
| – Net Position: | 45,084 | -55,560 | 10,476 |
| – Gross Longs: | 120,737 | 56,459 | 35,517 |
| – Gross Shorts: | 75,653 | 112,019 | 25,041 |
| – Long to Short Ratio: | 1.6 to 1 | 0.5 to 1 | 1.4 to 1 |
| NET POSITION TREND: | | | |
| – Strength Index Score (3 Year Range Pct): | 56.4 | 39.3 | 84.2 |
| – Strength Index Reading (3 Year Range): | Bullish | Bearish | Bullish-Extreme |
| NET POSITION MOVEMENT INDEX: | | | |
| – 6-Week Change in Strength Index: | -18.8 | 19.4 | -14.5 |
Japanese Yen Futures:
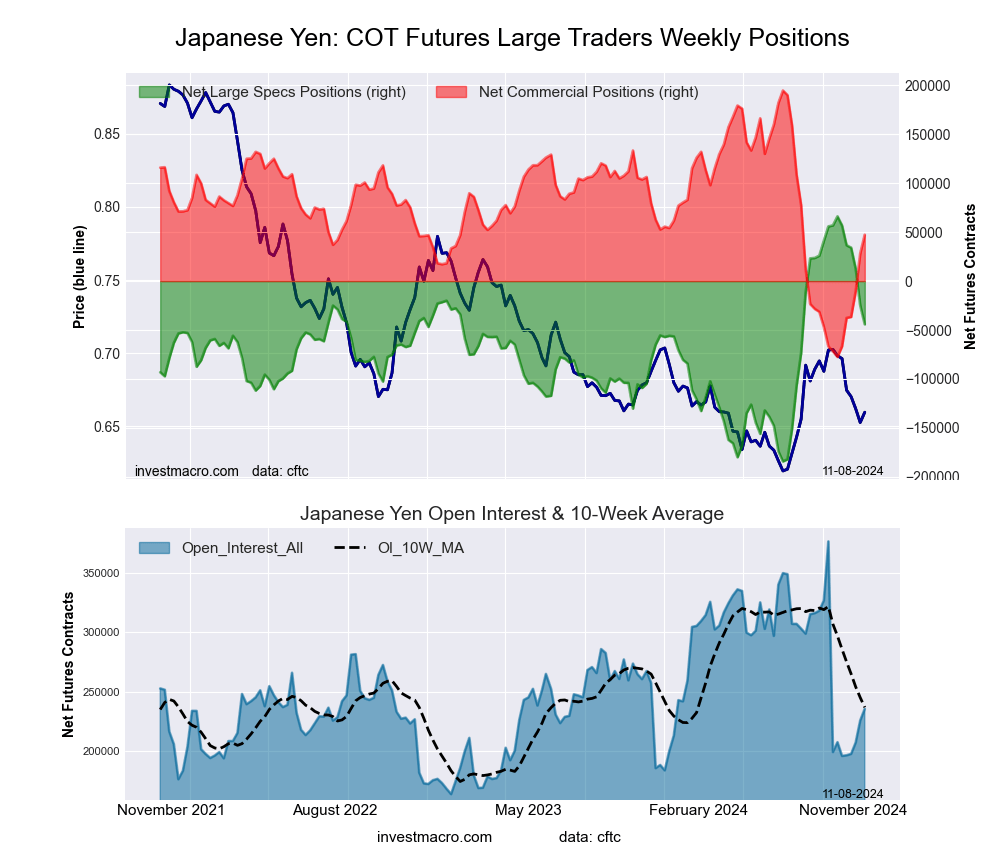 The Japanese Yen large speculator standing this week came in at a net position of -44,167 contracts in the data reported through Tuesday. This was a weekly lowering of -19,350 contracts from the previous week which had a total of -24,817 net contracts.
This week’s current strength score (the trader positioning range over the past three years, measured from 0 to 100) shows the speculators are currently Bullish with a score of 56.0 percent. The commercials are Bearish with a score of 45.9 percent and the small traders (not shown in chart) are Bullish with a score of 56.1 percent.
Price Trend-Following Model: Weak Uptrend
Our weekly trend-following model classifies the current market price position as: Weak Uptrend.
| JAPANESE YEN Statistics | SPECULATORS | COMMERCIALS | SMALL TRADERS |
| – Percent of Open Interest Longs: | 25.6 | 57.7 | 15.2 |
| – Percent of Open Interest Shorts: | 44.3 | 37.6 | 16.6 |
| – Net Position: | -44,167 | 47,295 | -3,128 |
| – Gross Longs: | 60,334 | 135,946 | 35,953 |
| – Gross Shorts: | 104,501 | 88,651 | 39,081 |
| – Long to Short Ratio: | 0.6 to 1 | 1.5 to 1 | 0.9 to 1 |
| NET POSITION TREND: | | | |
| – Strength Index Score (3 Year Range Pct): | 56.0 | 45.9 | 56.1 |
| – Strength Index Reading (3 Year Range): | Bullish | Bearish | Bullish |
| NET POSITION MOVEMENT INDEX: | | | |
| – 6-Week Change in Strength Index: | -44.0 | 45.9 | -35.4 |
Swiss Franc Futures:
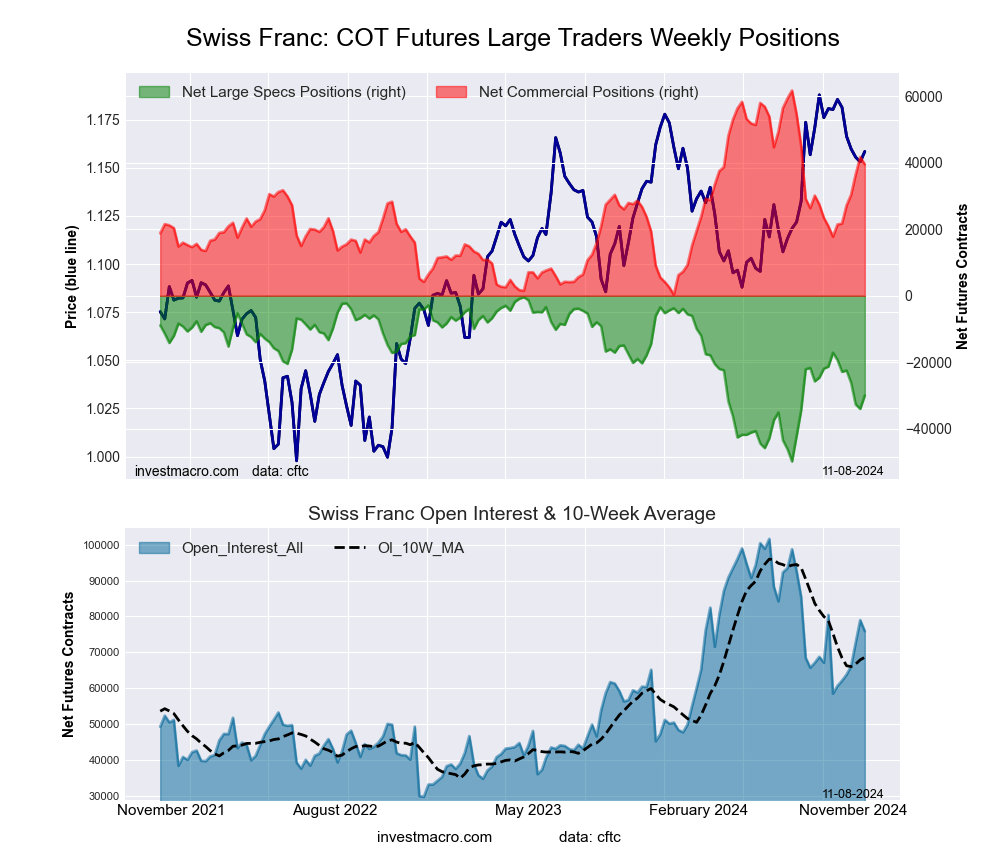 The Swiss Franc large speculator standing this week came in at a net position of -29,981 contracts in the data reported through Tuesday. This was a weekly gain of 4,017 contracts from the previous week which had a total of -33,998 net contracts.
This week’s current strength score (the trader positioning range over the past three years, measured from 0 to 100) shows the speculators are currently Bearish with a score of 40.1 percent. The commercials are Bullish with a score of 63.9 percent and the small traders (not shown in chart) are Bearish with a score of 33.1 percent.
Price Trend-Following Model: Weak Uptrend
Our weekly trend-following model classifies the current market price position as: Weak Uptrend.
| SWISS FRANC Statistics | SPECULATORS | COMMERCIALS | SMALL TRADERS |
| – Percent of Open Interest Longs: | 10.7 | 76.5 | 12.7 |
| – Percent of Open Interest Shorts: | 50.2 | 24.4 | 25.3 |
| – Net Position: | -29,981 | 39,519 | -9,538 |
| – Gross Longs: | 8,107 | 58,057 | 9,674 |
| – Gross Shorts: | 38,088 | 18,538 | 19,212 |
| – Long to Short Ratio: | 0.2 to 1 | 3.1 to 1 | 0.5 to 1 |
| NET POSITION TREND: | | | |
| – Strength Index Score (3 Year Range Pct): | 40.1 | 63.9 | 33.1 |
| – Strength Index Reading (3 Year Range): | Bearish | Bullish | Bearish |
| NET POSITION MOVEMENT INDEX: | | | |
| – 6-Week Change in Strength Index: | -21.7 | 29.5 | -34.2 |
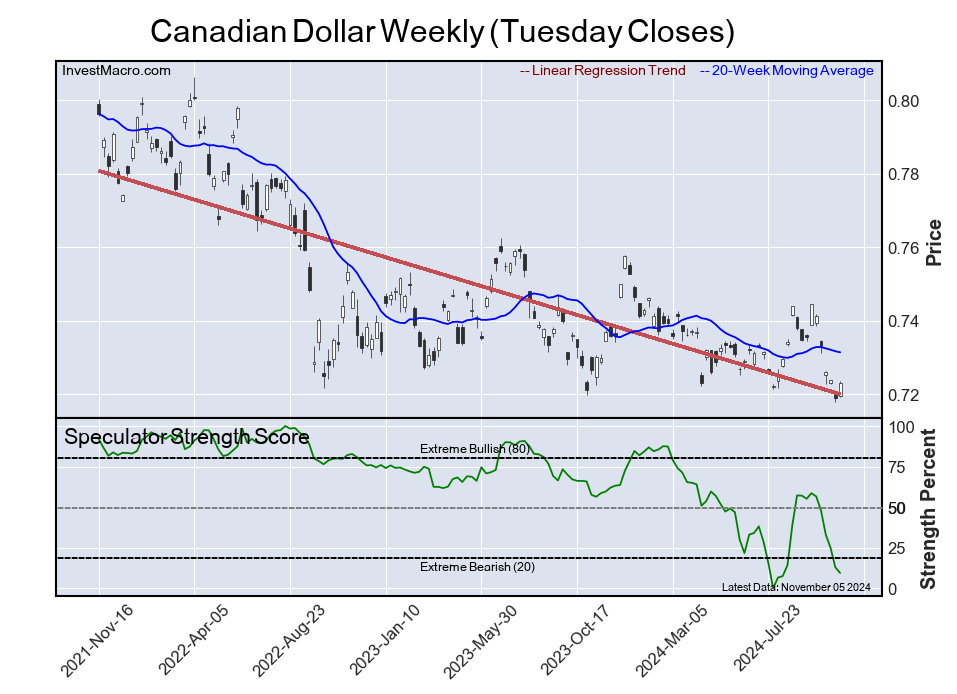
Canadian Dollar Futures:
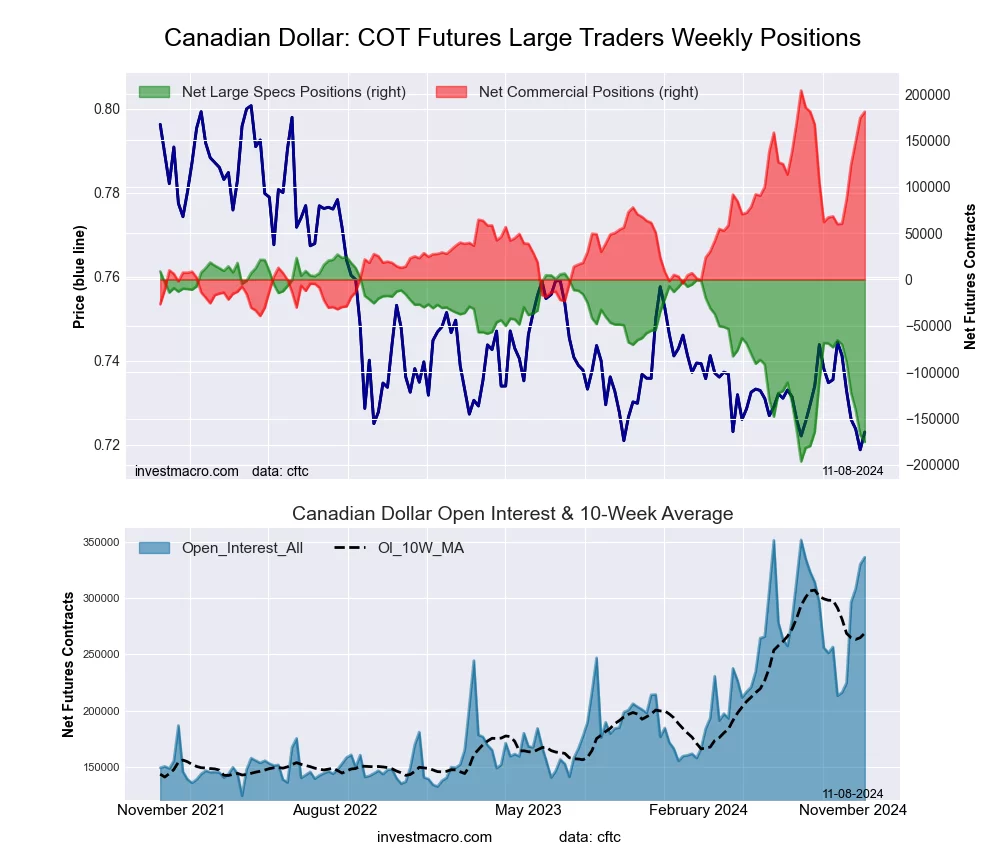 The Canadian Dollar large speculator standing this week came in at a net position of -175,229 contracts in the data reported through Tuesday. This was a weekly decrease of -7,730 contracts from the previous week which had a total of -167,499 net contracts.
This week’s current strength score (the trader positioning range over the past three years, measured from 0 to 100) shows the speculators are currently Bearish-Extreme with a score of 9.4 percent. The commercials are Bullish-Extreme with a score of 90.6 percent and the small traders (not shown in chart) are Bearish-Extreme with a score of 14.0 percent.
Price Trend-Following Model: Strong Downtrend
Our weekly trend-following model classifies the current market price position as: Strong Downtrend.
| CANADIAN DOLLAR Statistics | SPECULATORS | COMMERCIALS | SMALL TRADERS |
| – Percent of Open Interest Longs: | 8.0 | 81.1 | 8.4 |
| – Percent of Open Interest Shorts: | 60.0 | 27.3 | 10.1 |
| – Net Position: | -175,229 | 180,918 | -5,689 |
| – Gross Longs: | 26,816 | 272,938 | 28,368 |
| – Gross Shorts: | 202,045 | 92,020 | 34,057 |
| – Long to Short Ratio: | 0.1 to 1 | 3.0 to 1 | 0.8 to 1 |
| NET POSITION TREND: | | | |
| – Strength Index Score (3 Year Range Pct): | 9.4 | 90.6 | 14.0 |
| – Strength Index Reading (3 Year Range): | Bearish-Extreme | Bullish-Extreme | Bearish-Extreme |
| NET POSITION MOVEMENT INDEX: | | | |
| – 6-Week Change in Strength Index: | -49.1 | 49.8 | -34.0 |
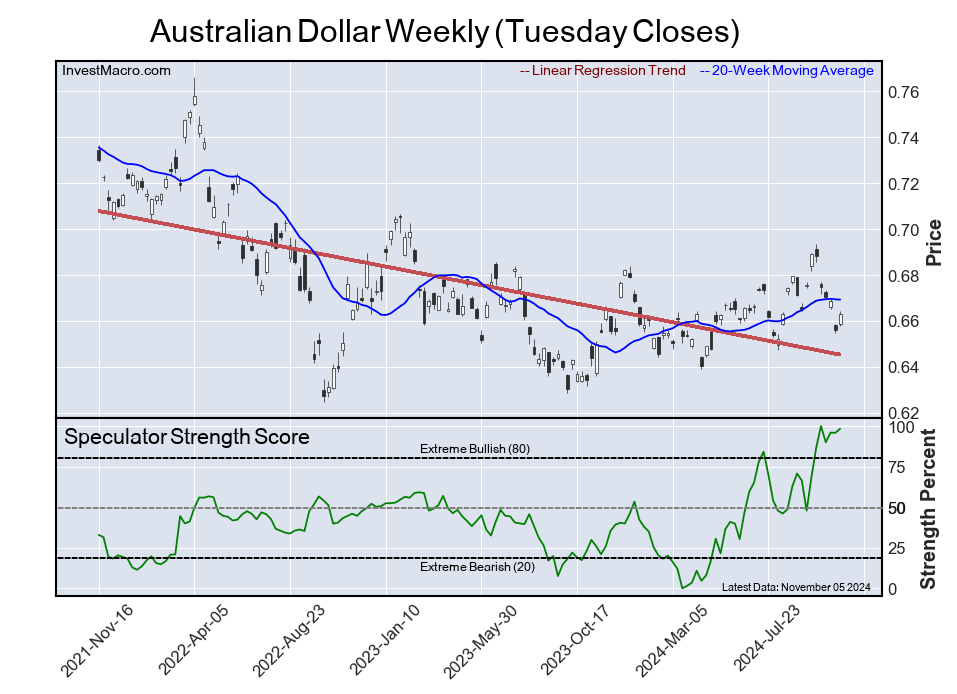
Australian Dollar Futures:
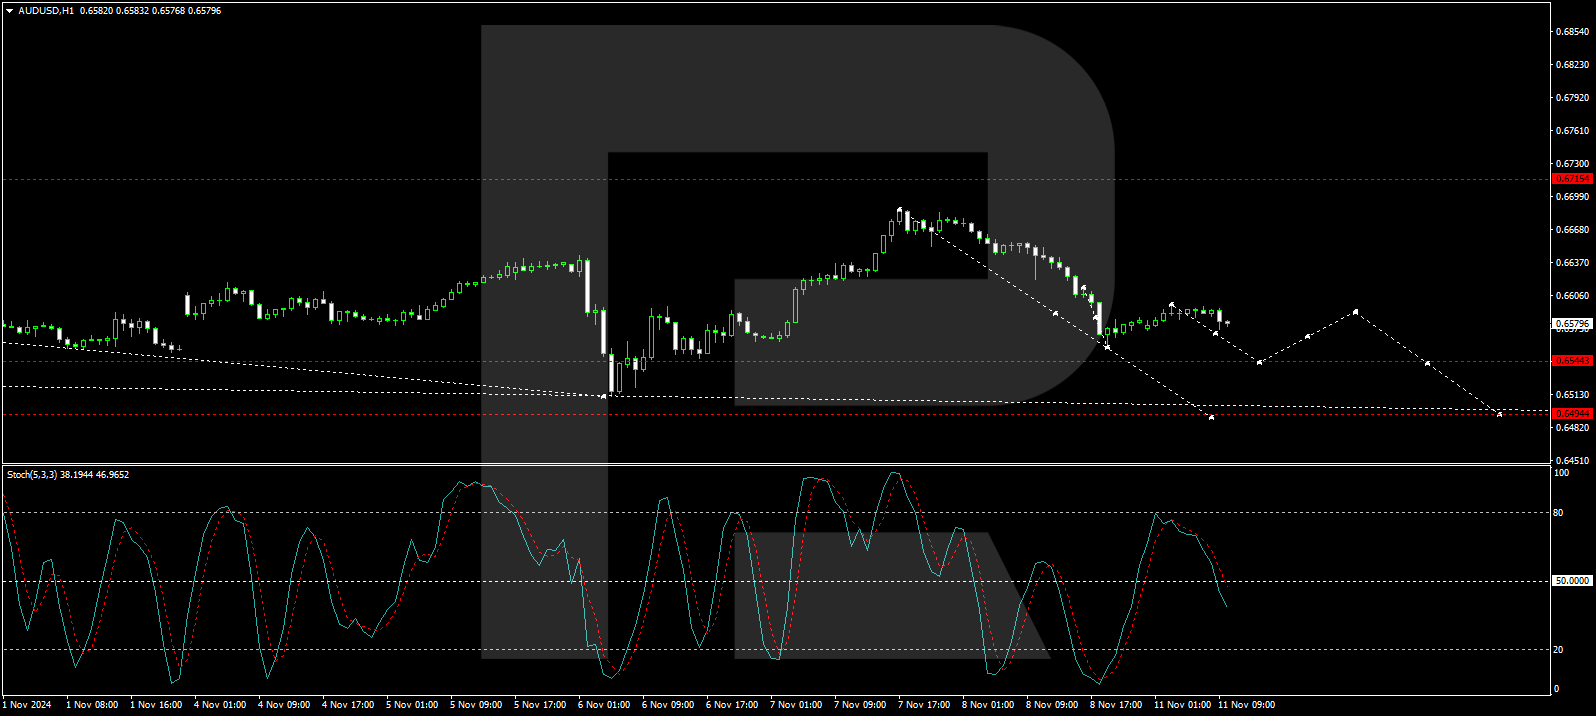
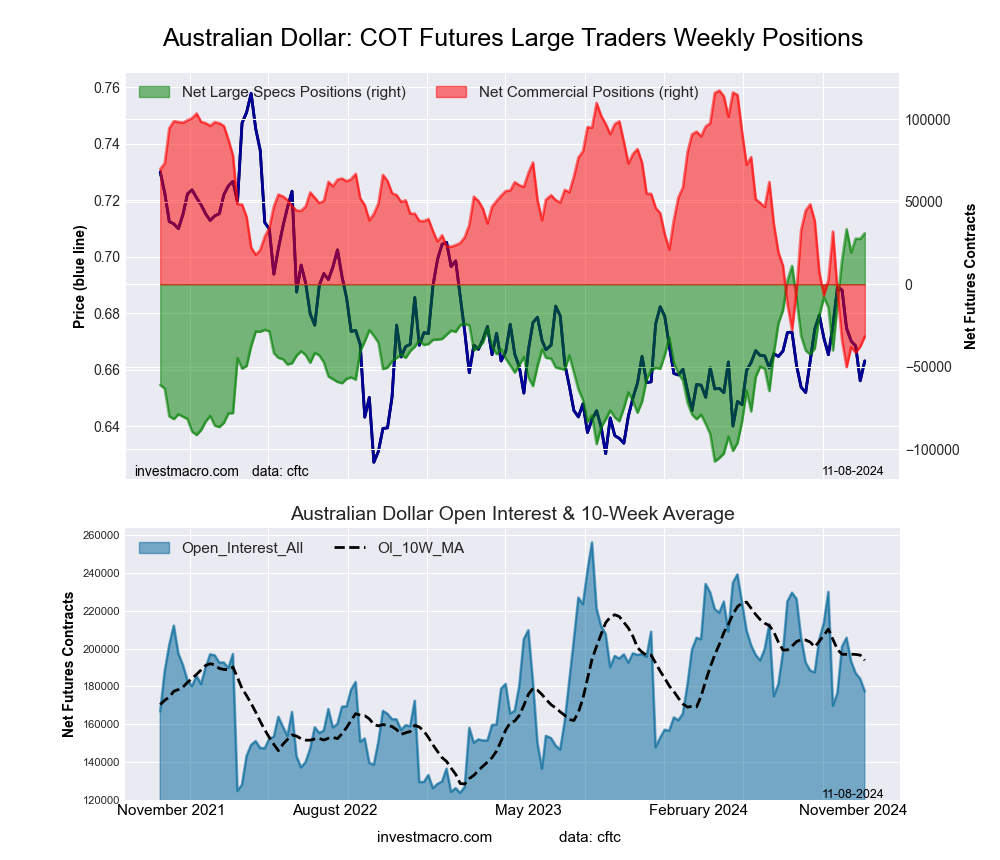 The Australian Dollar large speculator standing this week came in at a net position of 30,976 contracts in the data reported through Tuesday. This was a weekly gain of 3,460 contracts from the previous week which had a total of 27,516 net contracts.
This week’s current strength score (the trader positioning range over the past three years, measured from 0 to 100) shows the speculators are currently Bullish-Extreme with a score of 98.3 percent. The commercials are Bearish-Extreme with a score of 11.0 percent and the small traders (not shown in chart) are Bullish with a score of 52.3 percent.
Price Trend-Following Model: Weak Uptrend
Our weekly trend-following model classifies the current market price position as: Weak Uptrend.
| AUSTRALIAN DOLLAR Statistics | SPECULATORS | COMMERCIALS | SMALL TRADERS |
| – Percent of Open Interest Longs: | 51.6 | 33.3 | 14.4 |
| – Percent of Open Interest Shorts: | 34.1 | 51.2 | 13.9 |
| – Net Position: | 30,976 | -31,759 | 783 |
| – Gross Longs: | 91,488 | 59,108 | 25,478 |
| – Gross Shorts: | 60,512 | 90,867 | 24,695 |
| – Long to Short Ratio: | 1.5 to 1 | 0.7 to 1 | 1.0 to 1 |
| NET POSITION TREND: | | | |
| – Strength Index Score (3 Year Range Pct): | 98.3 | 11.0 | 52.3 |
| – Strength Index Reading (3 Year Range): | Bullish-Extreme | Bearish-Extreme | Bullish |
| NET POSITION MOVEMENT INDEX: | | | |
| – 6-Week Change in Strength Index: | 30.0 | -16.2 | -38.9 |
New Zealand Dollar Futures:
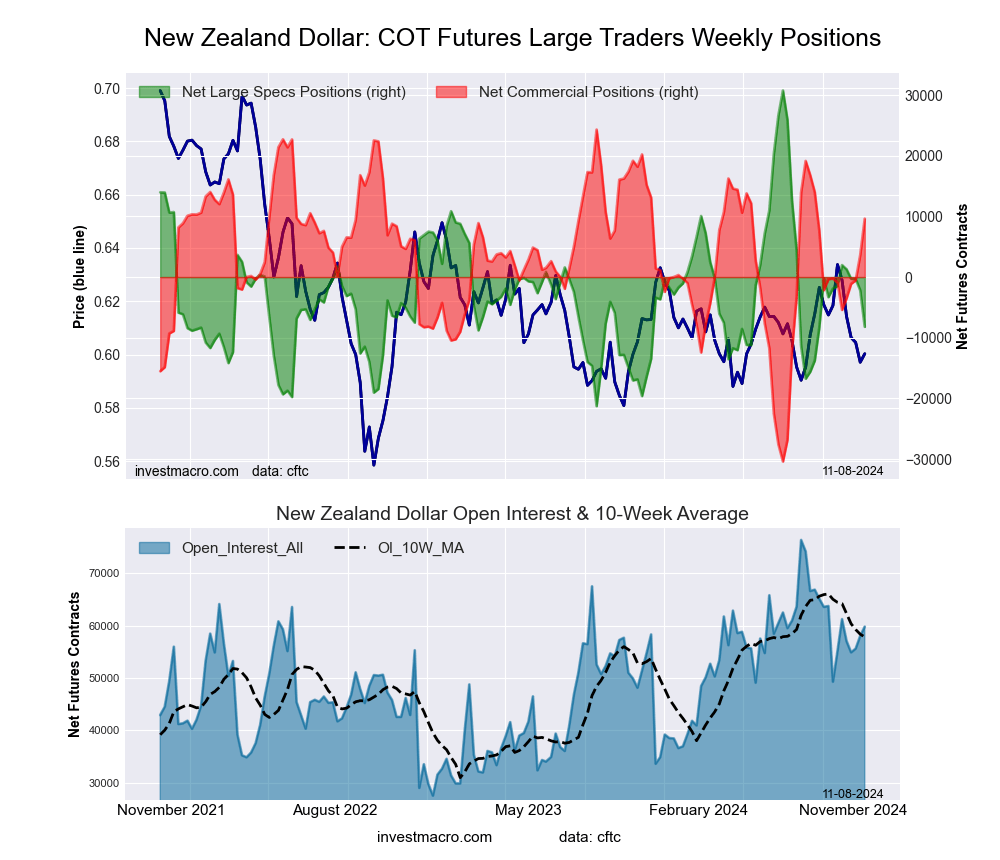 The New Zealand Dollar large speculator standing this week came in at a net position of -8,199 contracts in the data reported through Tuesday. This was a weekly fall of -6,032 contracts from the previous week which had a total of -2,167 net contracts.
This week’s current strength score (the trader positioning range over the past three years, measured from 0 to 100) shows the speculators are currently Bearish with a score of 25.1 percent. The commercials are Bullish with a score of 73.2 percent and the small traders (not shown in chart) are Bearish with a score of 35.4 percent.
Price Trend-Following Model: Weak Uptrend
Our weekly trend-following model classifies the current market price position as: Weak Uptrend.
| NEW ZEALAND DOLLAR Statistics | SPECULATORS | COMMERCIALS | SMALL TRADERS |
| – Percent of Open Interest Longs: | 36.5 | 57.5 | 5.9 |
| – Percent of Open Interest Shorts: | 50.3 | 41.4 | 8.2 |
| – Net Position: | -8,199 | 9,620 | -1,421 |
| – Gross Longs: | 21,855 | 34,368 | 3,501 |
| – Gross Shorts: | 30,054 | 24,748 | 4,922 |
| – Long to Short Ratio: | 0.7 to 1 | 1.4 to 1 | 0.7 to 1 |
| NET POSITION TREND: | | | |
| – Strength Index Score (3 Year Range Pct): | 25.1 | 73.2 | 35.4 |
| – Strength Index Reading (3 Year Range): | Bearish | Bullish | Bearish |
| NET POSITION MOVEMENT INDEX: | | | |
| – 6-Week Change in Strength Index: | -13.0 | 19.3 | -48.4 |
Mexican Peso Futures:
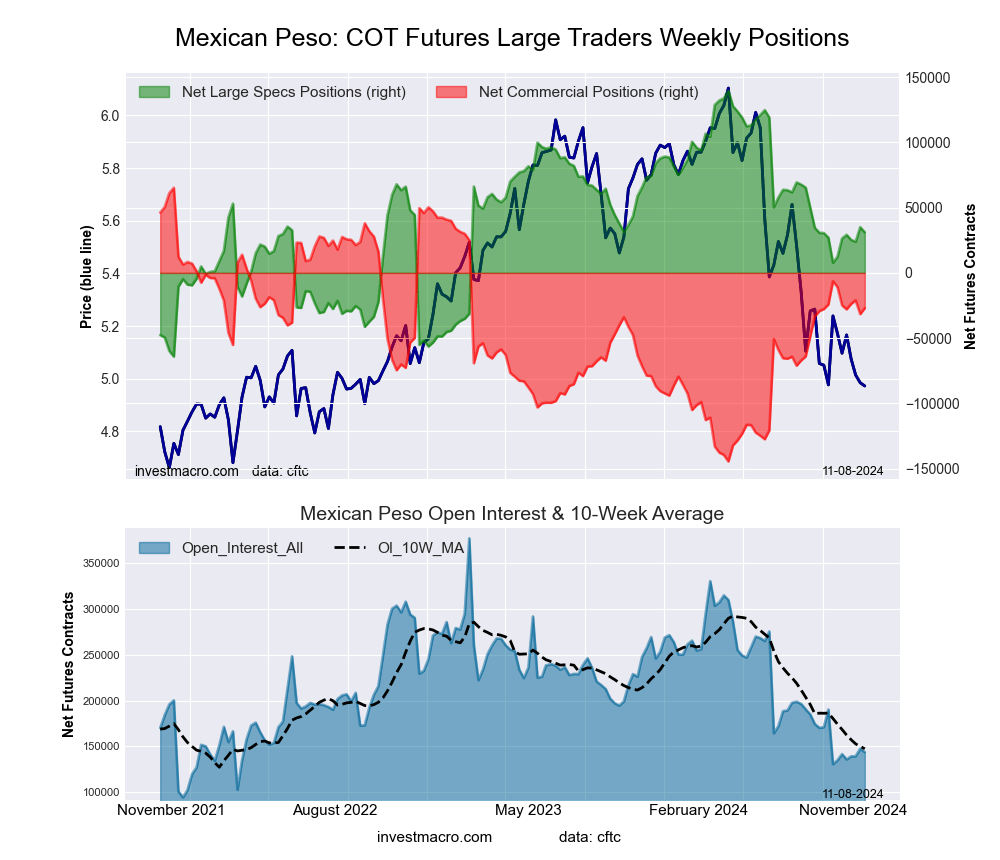 The Mexican Peso large speculator standing this week came in at a net position of 31,095 contracts in the data reported through Tuesday. This was a weekly decline of -3,950 contracts from the previous week which had a total of 35,045 net contracts.
This week’s current strength score (the trader positioning range over the past three years, measured from 0 to 100) shows the speculators are currently Bearish with a score of 46.7 percent. The commercials are Bullish with a score of 56.0 percent and the small traders (not shown in chart) are Bearish-Extreme with a score of 0.0 percent.
Price Trend-Following Model: Downtrend
Our weekly trend-following model classifies the current market price position as: Downtrend.
| MEXICAN PESO Statistics | SPECULATORS | COMMERCIALS | SMALL TRADERS |
| – Percent of Open Interest Longs: | 45.6 | 48.6 | 2.5 |
| – Percent of Open Interest Shorts: | 23.9 | 67.4 | 5.3 |
| – Net Position: | 31,095 | -27,000 | -4,095 |
| – Gross Longs: | 65,501 | 69,905 | 3,587 |
| – Gross Shorts: | 34,406 | 96,905 | 7,682 |
| – Long to Short Ratio: | 1.9 to 1 | 0.7 to 1 | 0.5 to 1 |
| NET POSITION TREND: | | | |
| – Strength Index Score (3 Year Range Pct): | 46.7 | 56.0 | 0.0 |
| – Strength Index Reading (3 Year Range): | Bearish | Bullish | Bearish-Extreme |
| NET POSITION MOVEMENT INDEX: | | | |
| – 6-Week Change in Strength Index: | 9.2 | -7.7 | -14.0 |
Brazilian Real Futures:
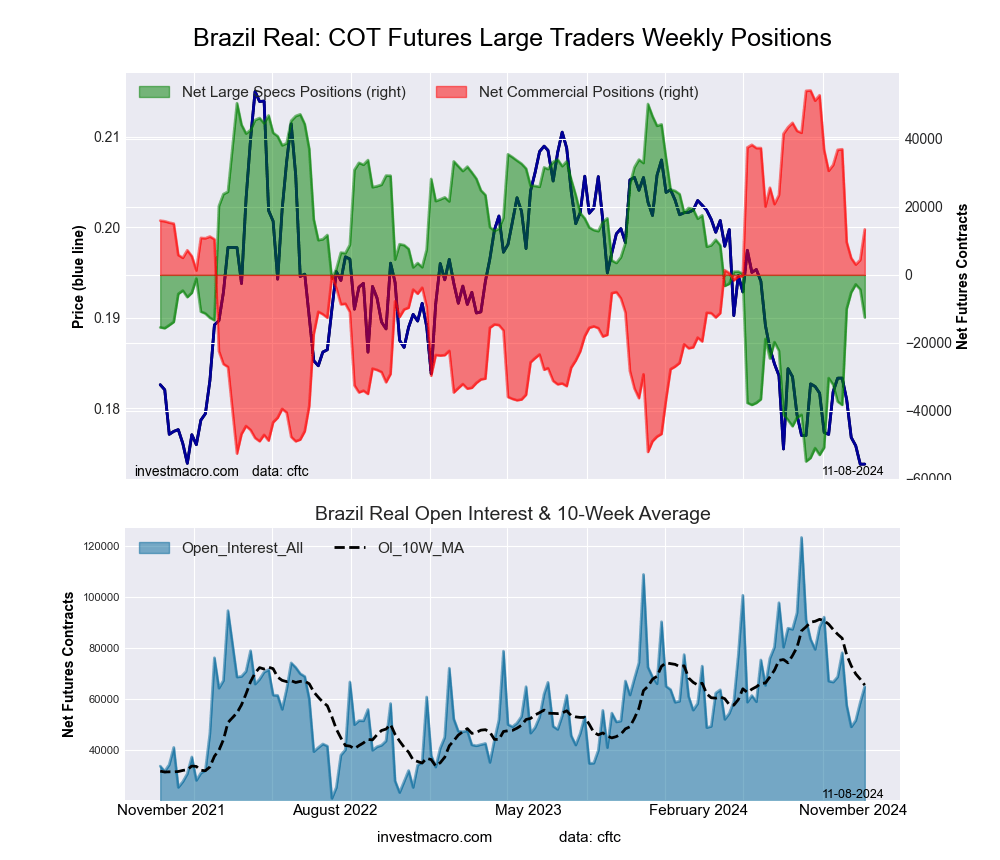 The Brazilian Real large speculator standing this week came in at a net position of -12,525 contracts in the data reported through Tuesday. This was a weekly fall of -8,256 contracts from the previous week which had a total of -4,269 net contracts.
This week’s current strength score (the trader positioning range over the past three years, measured from 0 to 100) shows the speculators are currently Bearish with a score of 40.2 percent. The commercials are Bullish with a score of 61.7 percent and the small traders (not shown in chart) are Bearish-Extreme with a score of 16.1 percent.
Price Trend-Following Model: Strong Downtrend
Our weekly trend-following model classifies the current market price position as: Strong Downtrend.
| BRAZIL REAL Statistics | SPECULATORS | COMMERCIALS | SMALL TRADERS |
| – Percent of Open Interest Longs: | 46.7 | 43.0 | 3.4 |
| – Percent of Open Interest Shorts: | 66.0 | 22.4 | 4.7 |
| – Net Position: | -12,525 | 13,371 | -846 |
| – Gross Longs: | 30,318 | 27,929 | 2,214 |
| – Gross Shorts: | 42,843 | 14,558 | 3,060 |
| – Long to Short Ratio: | 0.7 to 1 | 1.9 to 1 | 0.7 to 1 |
| NET POSITION TREND: | | | |
| – Strength Index Score (3 Year Range Pct): | 40.2 | 61.7 | 16.1 |
| – Strength Index Reading (3 Year Range): | Bearish | Bullish | Bearish-Extreme |
| NET POSITION MOVEMENT INDEX: | | | |
| – 6-Week Change in Strength Index: | 23.5 | -21.9 | -7.5 |
Bitcoin Futures:
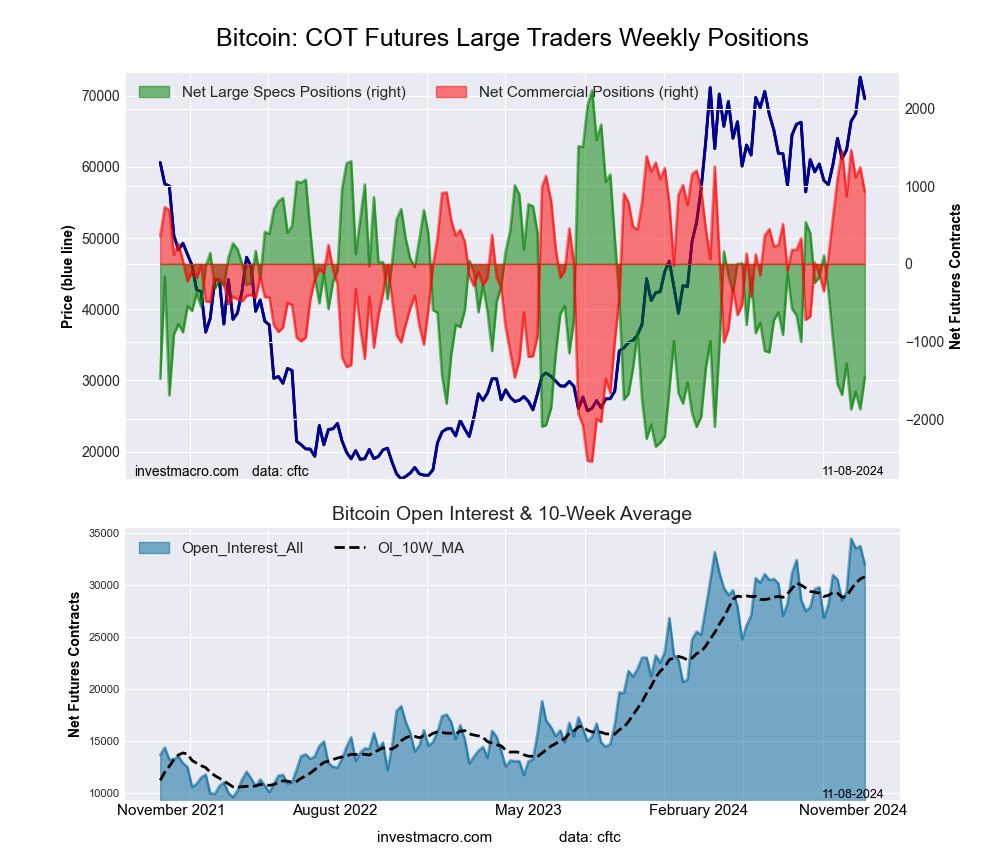 The Bitcoin large speculator standing this week came in at a net position of -1,457 contracts in the data reported through Tuesday. This was a weekly boost of 412 contracts from the previous week which had a total of -1,869 net contracts.
This week’s current strength score (the trader positioning range over the past three years, measured from 0 to 100) shows the speculators are currently Bearish-Extreme with a score of 19.5 percent. The commercials are Bullish-Extreme with a score of 86.6 percent and the small traders (not shown in chart) are Bullish with a score of 61.8 percent.
Price Trend-Following Model: Strong Uptrend
Our weekly trend-following model classifies the current market price position as: Strong Uptrend.
| BITCOIN Statistics | SPECULATORS | COMMERCIALS | SMALL TRADERS |
| – Percent of Open Interest Longs: | 82.2 | 6.0 | 4.5 |
| – Percent of Open Interest Shorts: | 86.7 | 3.1 | 2.9 |
| – Net Position: | -1,457 | 927 | 530 |
| – Gross Longs: | 26,303 | 1,907 | 1,443 |
| – Gross Shorts: | 27,760 | 980 | 913 |
| – Long to Short Ratio: | 0.9 to 1 | 1.9 to 1 | 1.6 to 1 |
| NET POSITION TREND: | | | |
| – Strength Index Score (3 Year Range Pct): | 19.5 | 86.6 | 61.8 |
| – Strength Index Reading (3 Year Range): | Bearish-Extreme | Bullish-Extreme | Bullish |
| NET POSITION MOVEMENT INDEX: | | | |
| – 6-Week Change in Strength Index: | 1.9 | -4.1 | 4.3 |
Article By InvestMacro – Receive our weekly COT Newsletter
*COT Report: The COT data, released weekly to the public each Friday, is updated through the most recent Tuesday (data is 3 days old) and shows a quick view of how large speculators or non-commercials (for-profit traders) were positioned in the futures markets.
The CFTC categorizes trader positions according to commercial hedgers (traders who use futures contracts for hedging as part of the business), non-commercials (large traders who speculate to realize trading profits) and nonreportable traders (usually small traders/speculators) as well as their open interest (contracts open in the market at time of reporting). See CFTC criteria here.