
By RoboForex Analytical Department
The AUD/USD pair is navigating the week starting with a steady tone, trading around 0.6590. After a significant drop last Friday, triggered by disappointment over China’s economic stimulus measures, the pair finds a momentary respite as it consolidates recent movements.
China’s announcement of a significant debt reduction and support for local governments and economic growth fell short of full transparency, leaving investors wanting more details. Given China’s crucial role as Australia’s top trading partner, any economic shifts there have a pronounced impact on the AUD’s performance.
The ongoing uncertainties surrounding the implications of Donald Trump’s U.S. presidential win also continue to influence market sentiment, particularly regarding U.S.-China relations.
This week is pivotal for Australian data with the release of Q3 payroll statistics and overall employment data, which are essential for assessing the Reserve Bank of Australia’s (RBA) future monetary policy decisions. Additionally, RBA Governor Michele Bullock’s participation in a regulatory panel might offer fresh insights into the central bank’s views on inflation and economic demand.
AUD/USD Technical Analysis
Free Reports:
 Get our Weekly Commitment of Traders Reports - See where the biggest traders (Hedge Funds and Commercial Hedgers) are positioned in the futures markets on a weekly basis.
 Download Our Metatrader 4 Indicators – Put Our Free MetaTrader 4 Custom Indicators on your charts when you join our Weekly Newsletter
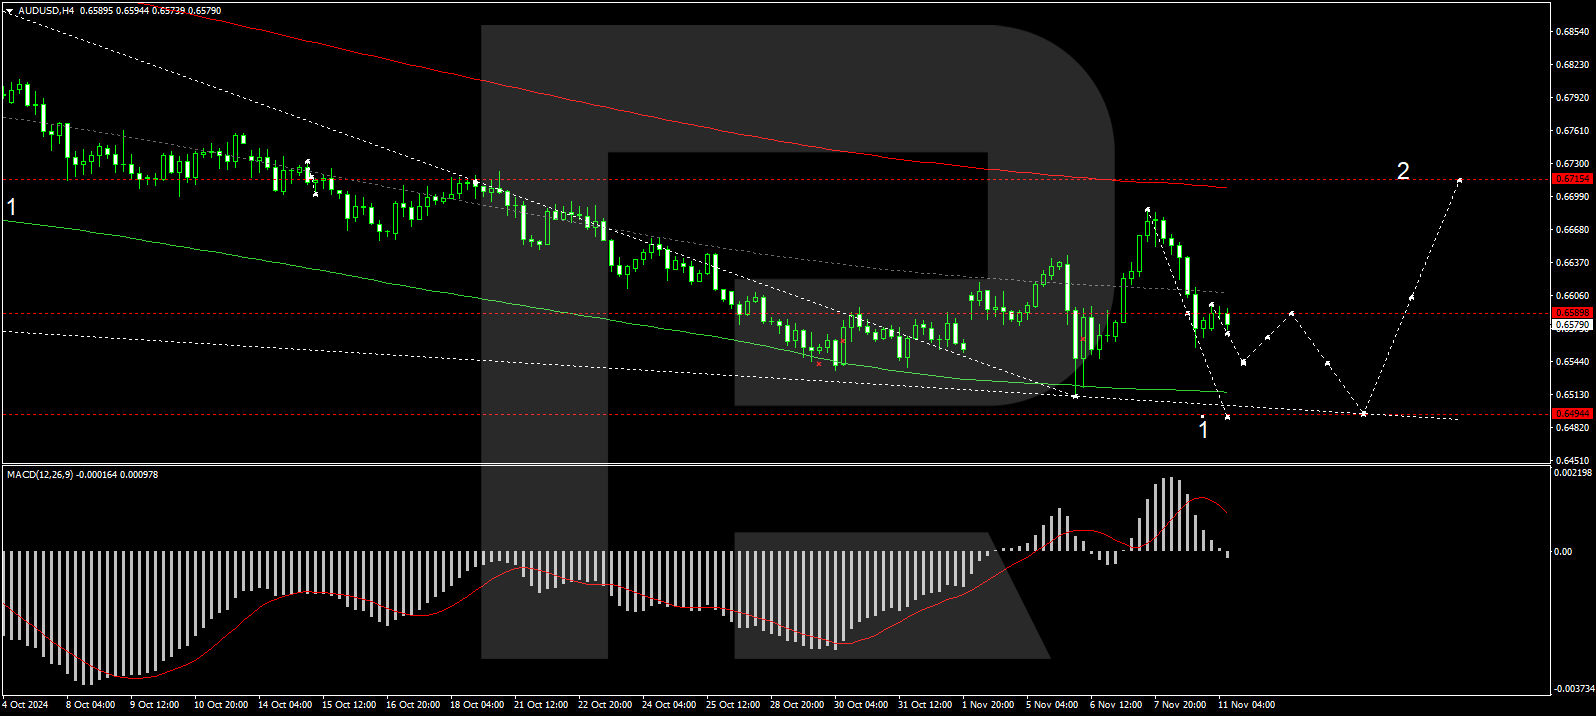
Currently, AUD/USD is hovering around 0.6589 within a tight consolidation range. Anticipations lean towards a downward breakout towards 0.6544, potentially extending to 0.6494 before reversing. Upon reaching these levels, a reversal towards 0.6715 may be considered, with an interim target at 0.6600. The MACD indicator supports a bearish outlook in the short term, as it points downwards from above the zero line.
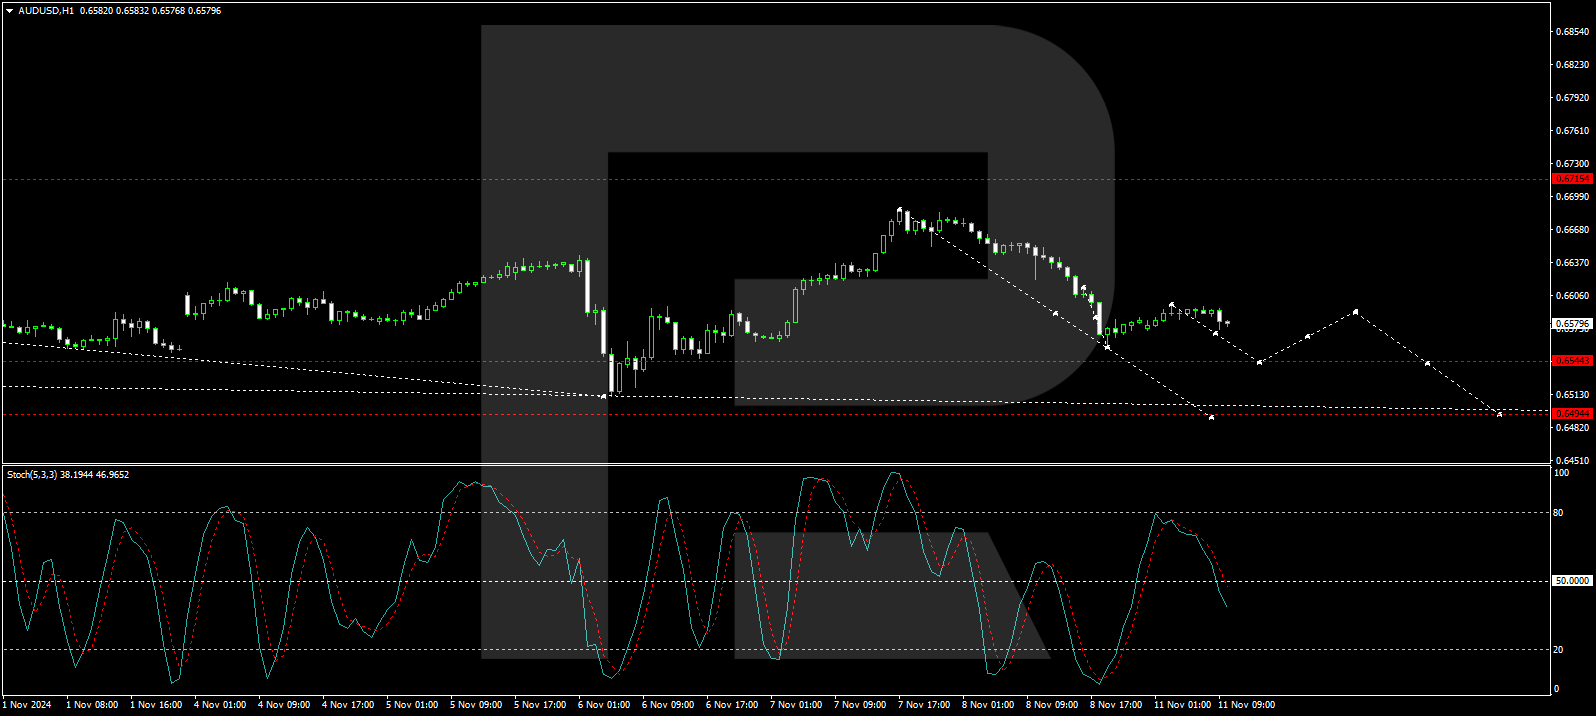
On the hourly chart, after completing a decline to 0.6557 and a subsequent correction to 0.6600, expectations are for a further dip to 0.6544. Success in reaching this level may prompt a rebound to 0.6600, testing from below before possibly resuming the downward trend towards 0.6494. The stochastic oscillator, currently below the 50 mark, underscores the potential for further declines.
Disclaimer
Any forecasts contained herein are based on the author’s particular opinion. This analysis may not be treated as trading advice. RoboForex bears no responsibility for trading results based on trading recommendations and reviews contained herein.

- GBP/USD at Month’s Lows: The Outlook Remains Weak Jul 29, 2026
- Crude oil falls below $80 per barrel. Australia sees inflation slowdown Jul 29, 2026
- The US Tech sector hit by sell‑off. Oil prices decline on renewed negotiations Jul 28, 2026
- Gold Declines, Focus on Fed and Falling Oil Prices Jul 28, 2026
- This week will be one of the most crowded for central‑bank meetings Jul 27, 2026
- EUR/USD Ahead of a Key Week: Holding Near Lows Jul 27, 2026
- COT Metals Charts: Weekly Speculator Changes led by Copper Jul 26, 2026
- COT Bonds Charts: Speculator Bets led by SOFR 3-Months & 5-Year Bonds Jul 26, 2026
- COT Energy Charts: Weekly Speculator Bets led by WTI Crude & Natural Gas Jul 26, 2026
- COT Soft Commodities Charts: Weekly Speculator Bets led by Corn & Soybeans Jul 26, 2026
