By InvestMacro
Here are the latest charts and statistics for the Commitment of Traders (COT) data published by the Commodities Futures Trading Commission (CFTC).
The latest COT data is updated through Tuesday December 3rd and shows a quick view of how large market participants (for-profit speculators and commercial traders) were positioned in the futures markets. All currency positions are in direct relation to the US dollar where, for example, a bet for the euro is a bet that the euro will rise versus the dollar while a bet against the euro will be a bet that the euro will decline versus the dollar.
Weekly Speculator Changes led by Mexican Peso & Japanese Yen
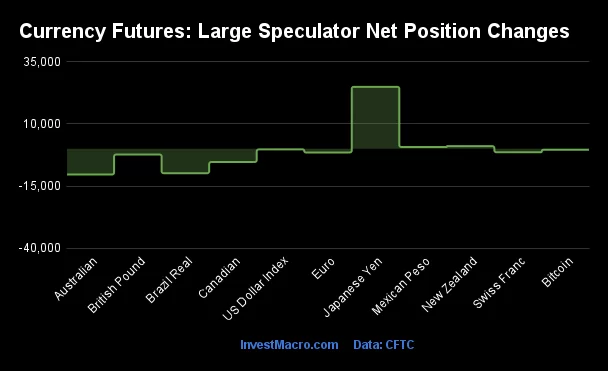
The COT currency market speculator bets were overall lower this week as just three out of the eleven currency markets we cover had higher positioning while the other eight markets had lower speculator contracts.
Leading the gains for the currency markets was the Japanese Yen (24,967 contracts) with the New Zealand Dollar (1,073 contracts) and the Mexican Peso (726 contracts) also showing positive weeks.
The currencies seeing declines in speculator bets on the week were the Australian Dollar (-10,375 contracts), the Brazilian Real (-9,847 contracts), the Canadian Dollar (-5,344 contracts), the British Pound (-2,308 contracts), the EuroFX (-1,480 contracts), the Swiss Franc (-1,418 contracts), Bitcoin (-399 contracts) and with the US Dollar Index (-255 contracts) also registering lower bets on the week.
Currency Speculators push Japanese Yen bets into small bullish level
Highlighting the COT currency’s data this week is the recent bullish moves in the Japanese yen speculator position.
The Japanese yen speculator positions rose this week by almost +25,000 contracts following a similar gain by +24,235 contracts last week and by +18,034 contracts two weeks ago. Yen positions have now increased by a total of +67,236 contracts over these past three weeks which has totally erased the bearish net positioning of the prior five weeks. The positive sentiment by the speculators has pushed the overall net position into a small bullish level of +2,334 contracts which is the first bullish standing since October 22nd.
Over the year, the yen speculator positions have been highly bearish with a weekly average of -75,251 contracts for 2024 so far. The yen positioning fell as low as -184,223 contracts on July 2nd but speculators bearish bets have eased off in the second half of the year and specs did have an eleven-week streak of bullish positions from August to October. The speculator strength score (the percent of current speculator’s level compared to the past 3-years) is a strong 75 percent at the moment.
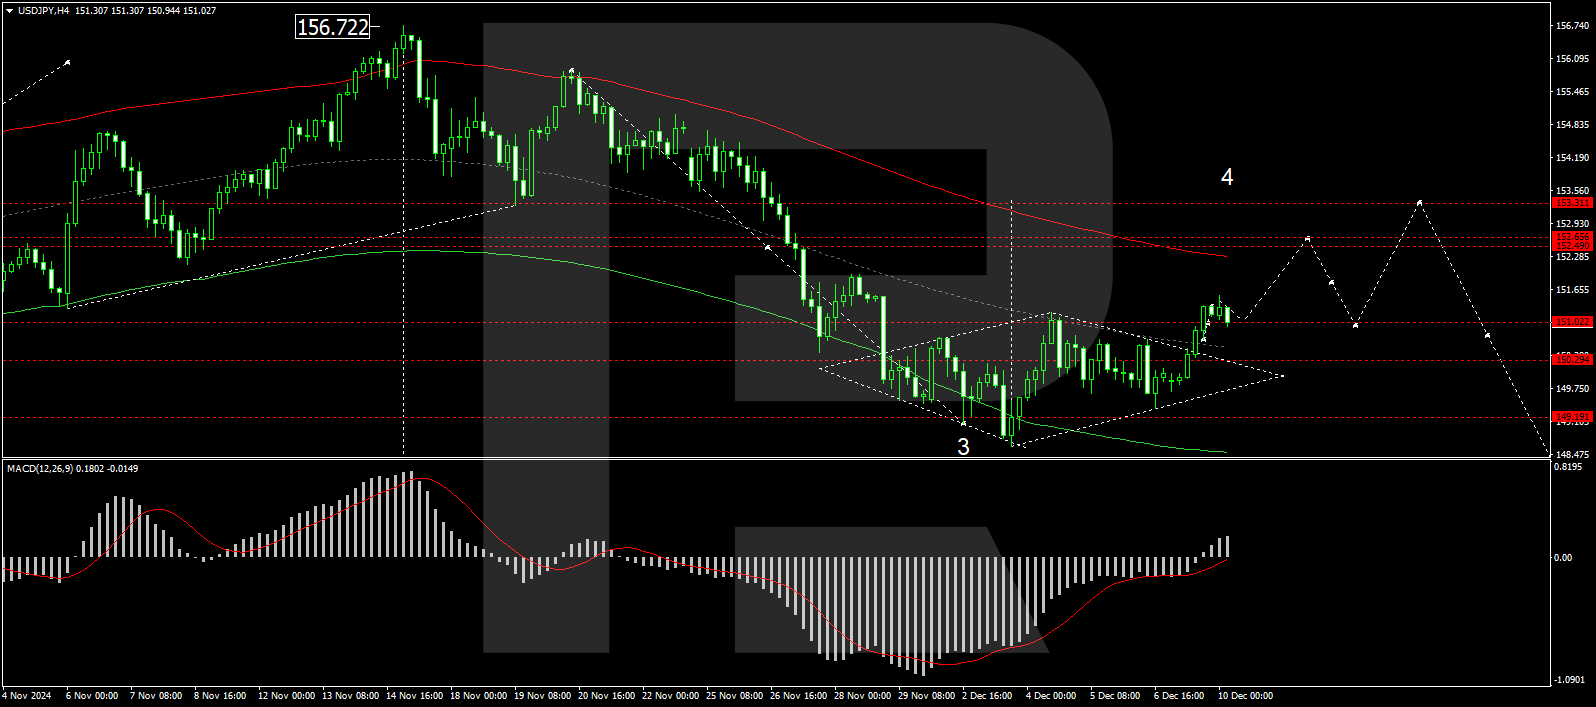
The yen exchange rate has been on an extremely weak trajectory throughout 2024 as well with the Japanese currency falling to multi-decade lows multiple times. Currently, the yen is still within 8 percent of the latest low with the USDJPY currency pair trading around 150.00.
The yen seems to be at a crossroads at the moment with a lot of money on the sidelines that could take this small bullish position in either direction. The overall direction of the US Dollar will be a major factor in whether this might be near the yen bottom or just another step in a weaker Japanese currency.
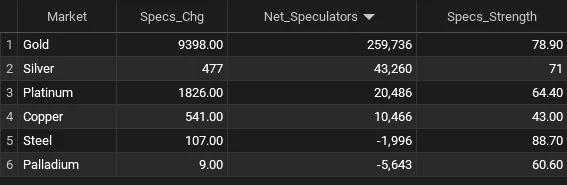
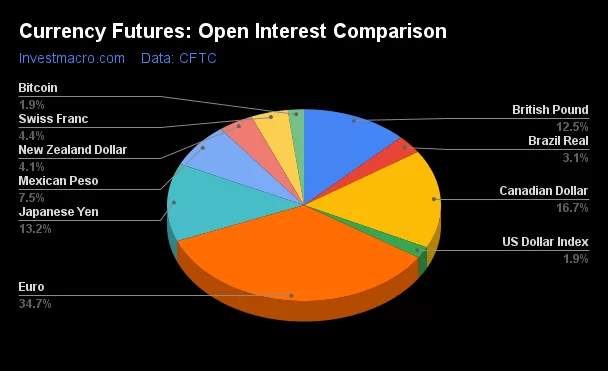
Currencies Net Speculators Leaderboard
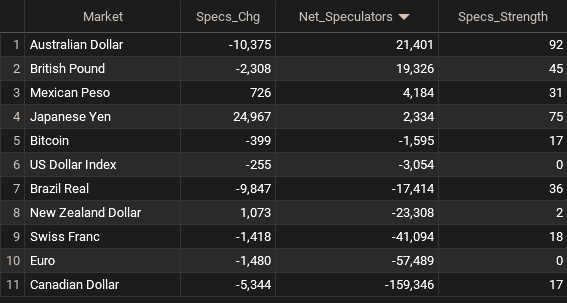
Legend: Weekly Speculators Change | Speculators Current Net Position | Speculators Strength Score compared to last 3-Years (0-100 range)
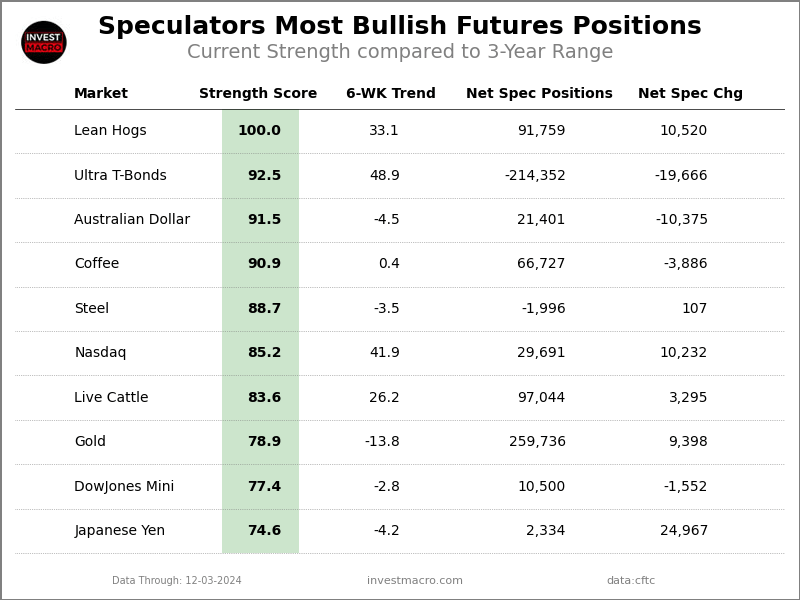
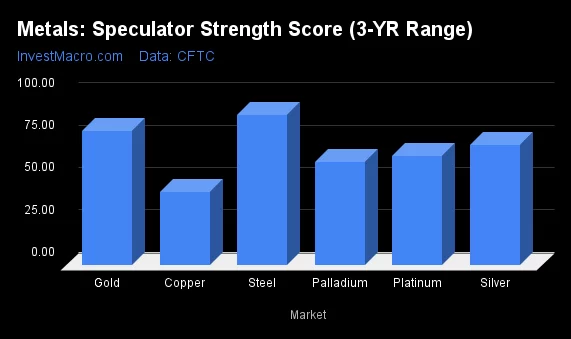
Strength Scores led by Australian Dollar & Japanese Yen
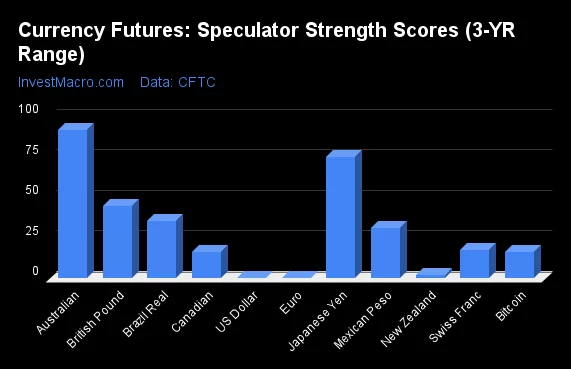
COT Strength Scores (a normalized measure of Speculator positions over a 3-Year range, from 0 to 100 where above 80 is Extreme-Bullish and below 20 is Extreme-Bearish) showed that the Australian Dollar (91 percent) and the Japanese Yen (75 percent) lead the currency markets this week.
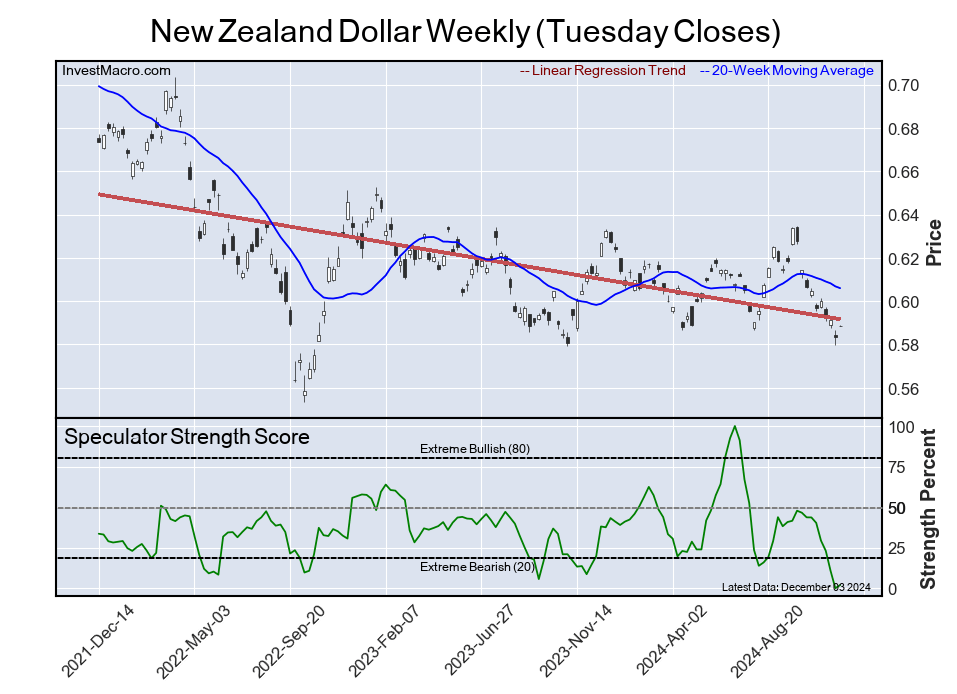
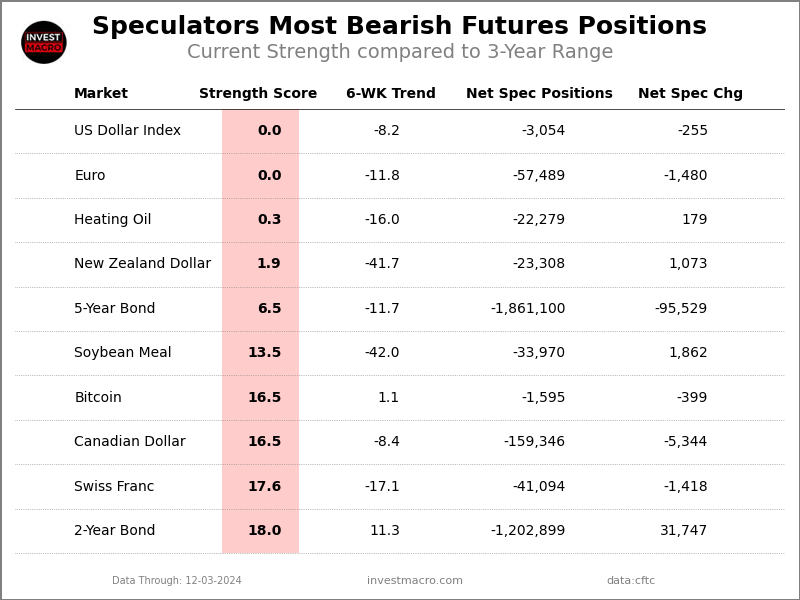
On the downside, the EuroFX (0 percent), the US Dollar Index (0 percent), the New Zealand Dollar (2 percent), Bitcoin (16 percent), the Canadian Dollar (17 percent) and the Swiss Franc (18 percent) come in at the lowest strength levels currently and are in Extreme-Bearish territory (below 20 percent).
3-Year Strength Statistics:
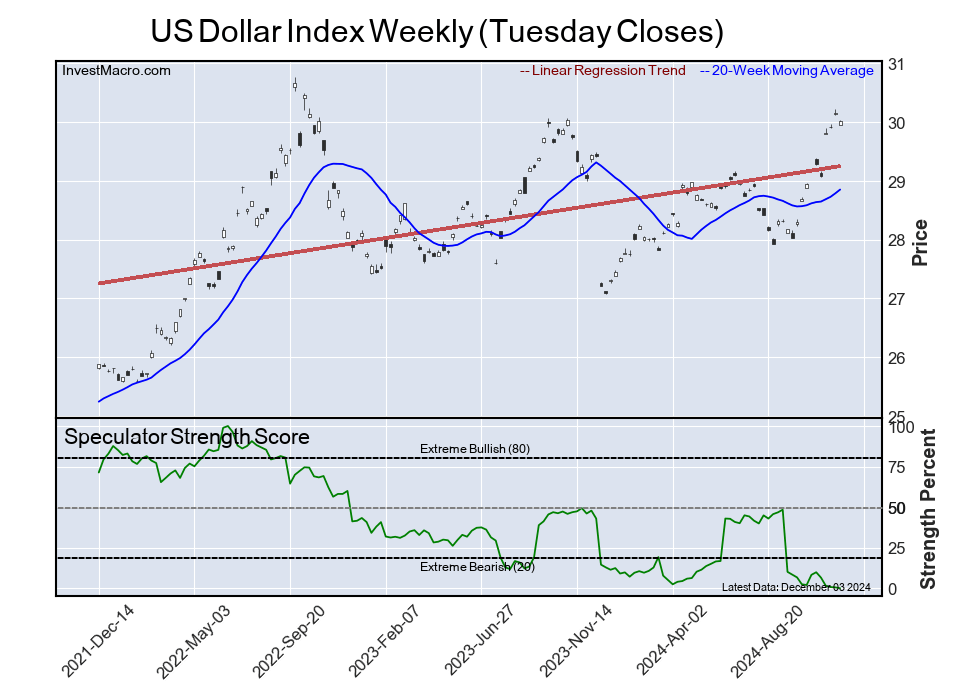
US Dollar Index (0.0 percent) vs US Dollar Index previous week (0.5 percent)
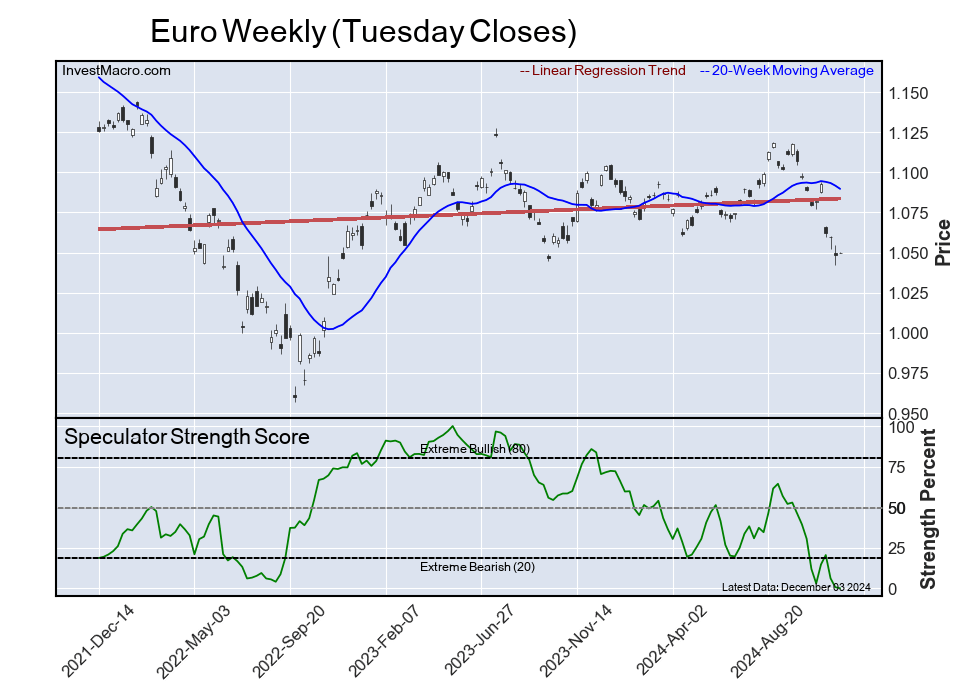
EuroFX (0.0 percent) vs EuroFX previous week (0.6 percent)
British Pound Sterling (44.8 percent) vs British Pound Sterling previous week (45.8 percent)
Japanese Yen (74.6 percent) vs Japanese Yen previous week (64.6 percent)
Swiss Franc (17.6 percent) vs Swiss Franc previous week (20.5 percent)
Canadian Dollar (16.5 percent) vs Canadian Dollar previous week (18.9 percent)
Australian Dollar (91.5 percent) vs Australian Dollar previous week (98.8 percent)
New Zealand Dollar (1.9 percent) vs New Zealand Dollar previous week (0.0 percent)
Mexican Peso (30.9 percent) vs Mexican Peso previous week (30.5 percent)
Brazilian Real (35.6 percent) vs Brazilian Real previous week (44.9 percent)
Bitcoin (16.5 percent) vs Bitcoin previous week (25.2 percent)
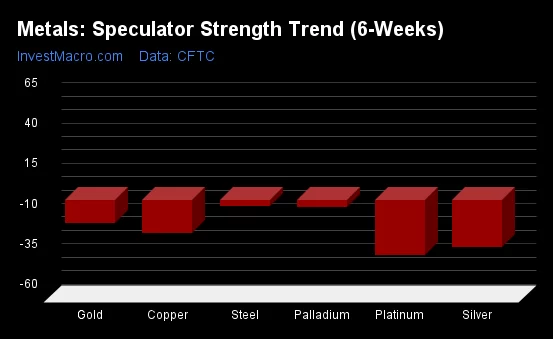
Bitcoin tops the 6-Week Strength Trends
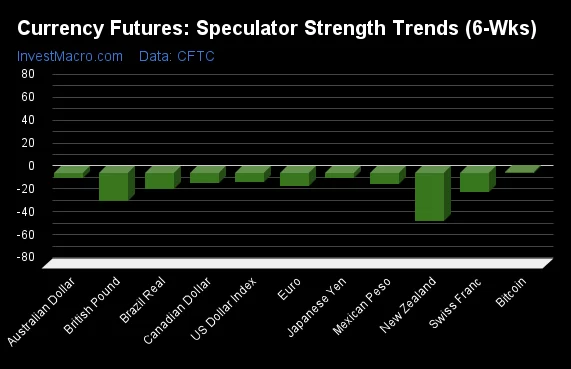
COT Strength Score Trends (or move index, calculates the 6-week changes in strength scores) showed that the Bitcoin (1 percent) leads the past six weeks trends for the currencies.
The New Zealand Dollar (-42 percent) leads the downside trend scores currently with the British Pound (-25 percent), Swiss Franc (-17 percent) and the Brazilian Real (-14 percent) following next with lower trend scores.
3-Year Strength Trends:
US Dollar Index (-8.2 percent) vs US Dollar Index previous week (-1.5 percent)
EuroFX (-11.8 percent) vs EuroFX previous week (-29.9 percent)
British Pound Sterling (-24.8 percent) vs British Pound Sterling previous week (-28.8 percent)
Japanese Yen (-4.2 percent) vs Japanese Yen previous week (-22.7 percent)
Swiss Franc (-17.1 percent) vs Swiss Franc previous week (-27.4 percent)
Canadian Dollar (-8.4 percent) vs Canadian Dollar previous week (-14.2 percent)
Australian Dollar (-4.5 percent) vs Australian Dollar previous week (8.9 percent)
New Zealand Dollar (-41.7 percent) vs New Zealand Dollar previous week (-43.7 percent)
Mexican Peso (-10.1 percent) vs Mexican Peso previous week (-11.1 percent)
Brazilian Real (-13.9 percent) vs Brazilian Real previous week (-2.3 percent)
Bitcoin (1.1 percent) vs Bitcoin previous week (14.8 percent)
Individual COT Forex Markets:
US Dollar Index Futures:
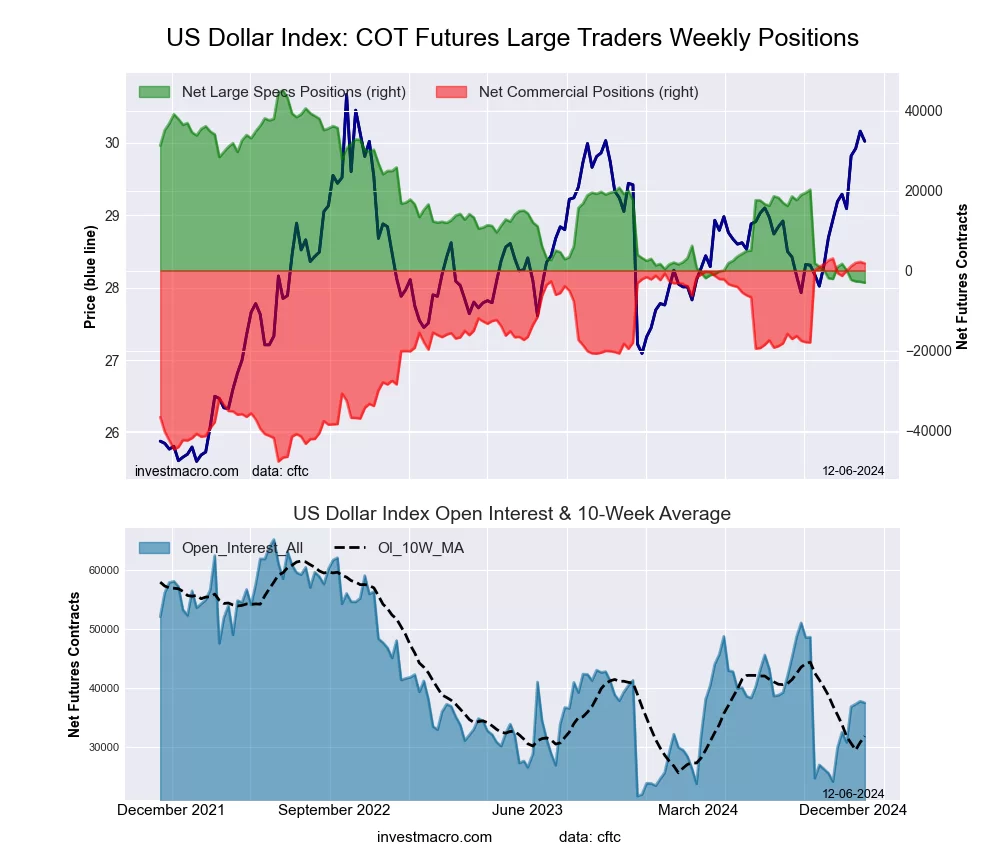 The US Dollar Index large speculator standing this week totaled a net position of -3,054 contracts in the data reported through Tuesday. This was a weekly reduction of -255 contracts from the previous week which had a total of -2,799 net contracts.
This week’s current strength score (the trader positioning range over the past three years, measured from 0 to 100) shows the speculators are currently Bearish-Extreme with a score of 0.0 percent. The commercials are Bullish-Extreme with a score of 97.6 percent and the small traders (not shown in chart) are Bearish with a score of 36.5 percent.
Price Trend-Following Model: Strong Uptrend
Our weekly trend-following model classifies the current market price position as: Strong Uptrend.
| US DOLLAR INDEX Statistics | SPECULATORS | COMMERCIALS | SMALL TRADERS |
| – Percent of Open Interest Longs: | 58.4 | 25.5 | 10.7 |
| – Percent of Open Interest Shorts: | 66.5 | 20.7 | 7.3 |
| – Net Position: | -3,054 | 1,801 | 1,253 |
| – Gross Longs: | 21,903 | 9,563 | 4,009 |
| – Gross Shorts: | 24,957 | 7,762 | 2,756 |
| – Long to Short Ratio: | 0.9 to 1 | 1.2 to 1 | 1.5 to 1 |
| NET POSITION TREND: | | | |
| – Strength Index Score (3 Year Range Pct): | 0.0 | 97.6 | 36.5 |
| – Strength Index Reading (3 Year Range): | Bearish-Extreme | Bullish-Extreme | Bearish |
| NET POSITION MOVEMENT INDEX: | | | |
| – 6-Week Change in Strength Index: | -8.2 | 4.8 | 16.1 |
Euro Currency Futures:
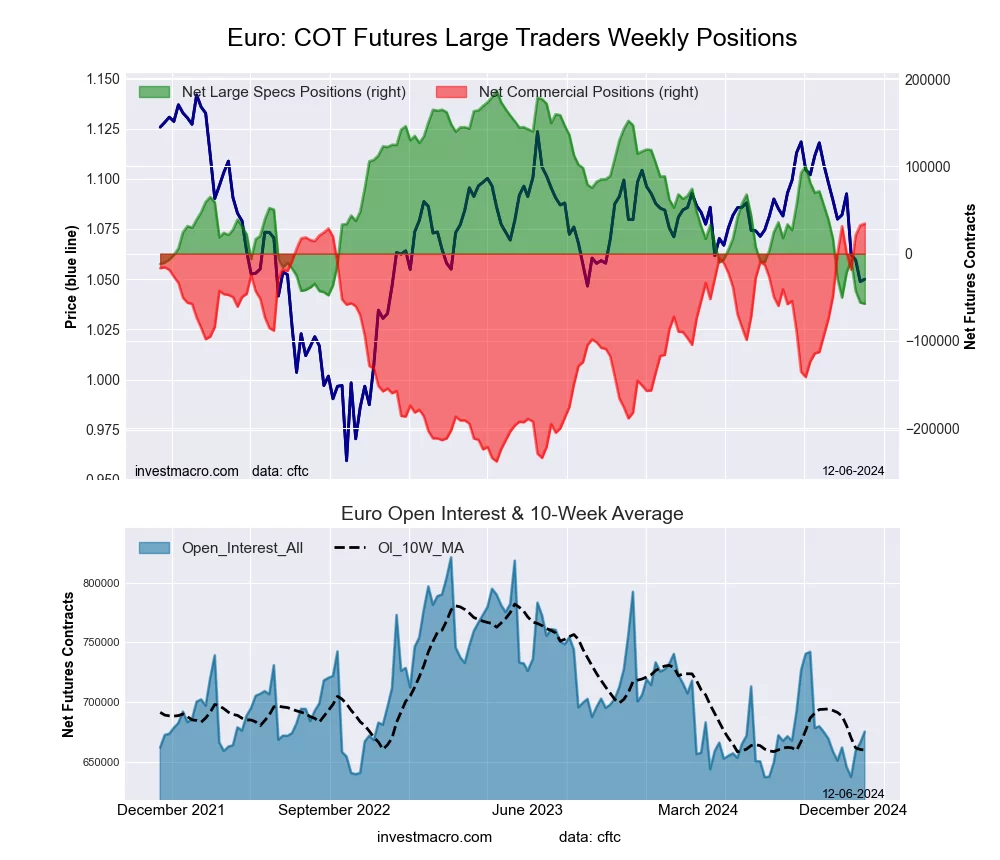 The Euro Currency large speculator standing this week totaled a net position of -57,489 contracts in the data reported through Tuesday. This was a weekly fall of -1,480 contracts from the previous week which had a total of -56,009 net contracts.
This week’s current strength score (the trader positioning range over the past three years, measured from 0 to 100) shows the speculators are currently Bearish-Extreme with a score of 0.0 percent. The commercials are Bullish-Extreme with a score of 100.0 percent and the small traders (not shown in chart) are Bearish with a score of 22.4 percent.
Price Trend-Following Model: Strong Downtrend
Our weekly trend-following model classifies the current market price position as: Strong Downtrend.
| EURO Currency Statistics | SPECULATORS | COMMERCIALS | SMALL TRADERS |
| – Percent of Open Interest Longs: | 24.8 | 59.4 | 11.5 |
| – Percent of Open Interest Shorts: | 33.4 | 54.3 | 8.1 |
| – Net Position: | -57,489 | 34,476 | 23,013 |
| – Gross Longs: | 167,693 | 401,120 | 77,569 |
| – Gross Shorts: | 225,182 | 366,644 | 54,556 |
| – Long to Short Ratio: | 0.7 to 1 | 1.1 to 1 | 1.4 to 1 |
| NET POSITION TREND: | | | |
| – Strength Index Score (3 Year Range Pct): | 0.0 | 100.0 | 22.4 |
| – Strength Index Reading (3 Year Range): | Bearish-Extreme | Bullish-Extreme | Bearish |
| NET POSITION MOVEMENT INDEX: | | | |
| – 6-Week Change in Strength Index: | -11.8 | 12.6 | -12.6 |
British Pound Sterling Futures:
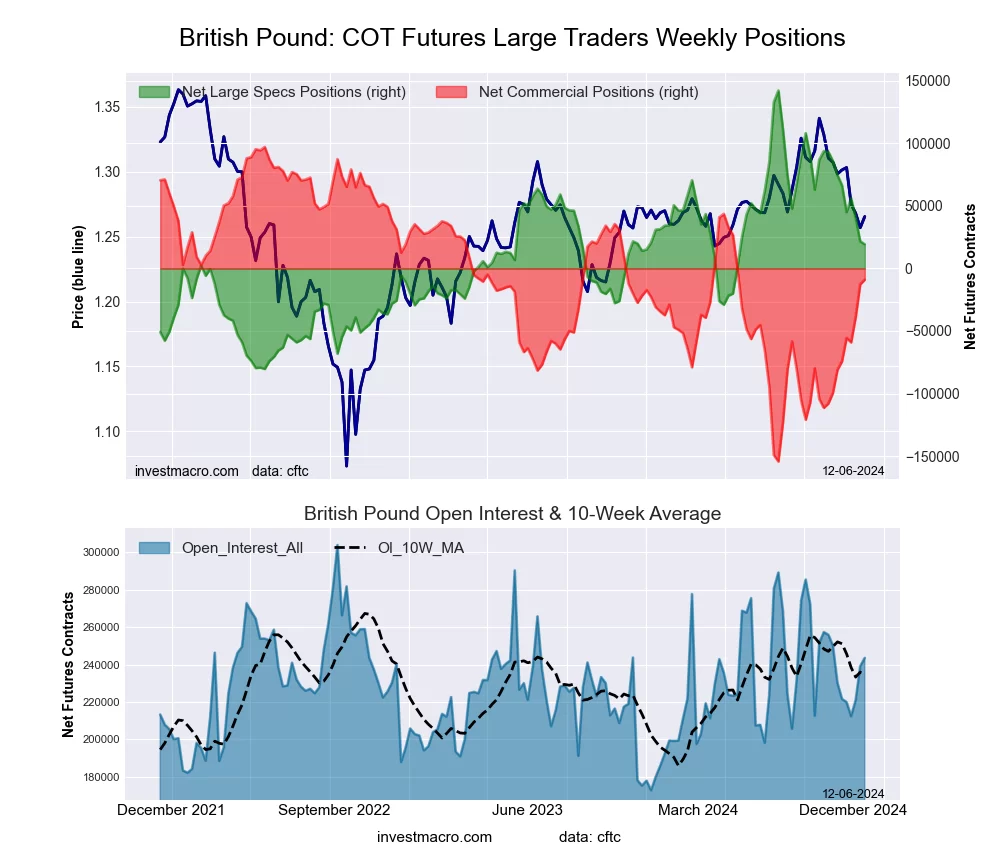 The British Pound Sterling large speculator standing this week totaled a net position of 19,326 contracts in the data reported through Tuesday. This was a weekly fall of -2,308 contracts from the previous week which had a total of 21,634 net contracts.
This week’s current strength score (the trader positioning range over the past three years, measured from 0 to 100) shows the speculators are currently Bearish with a score of 44.8 percent. The commercials are Bullish with a score of 57.8 percent and the small traders (not shown in chart) are Bearish with a score of 40.5 percent.
Price Trend-Following Model: Strong Downtrend
Our weekly trend-following model classifies the current market price position as: Strong Downtrend.
| BRITISH POUND Statistics | SPECULATORS | COMMERCIALS | SMALL TRADERS |
| – Percent of Open Interest Longs: | 40.3 | 46.8 | 9.5 |
| – Percent of Open Interest Shorts: | 32.3 | 50.5 | 13.8 |
| – Net Position: | 19,326 | -8,995 | -10,331 |
| – Gross Longs: | 98,056 | 114,068 | 23,219 |
| – Gross Shorts: | 78,730 | 123,063 | 33,550 |
| – Long to Short Ratio: | 1.2 to 1 | 0.9 to 1 | 0.7 to 1 |
| NET POSITION TREND: | | | |
| – Strength Index Score (3 Year Range Pct): | 44.8 | 57.8 | 40.5 |
| – Strength Index Reading (3 Year Range): | Bearish | Bullish | Bearish |
| NET POSITION MOVEMENT INDEX: | | | |
| – 6-Week Change in Strength Index: | -24.8 | 28.7 | -35.4 |
Japanese Yen Futures:
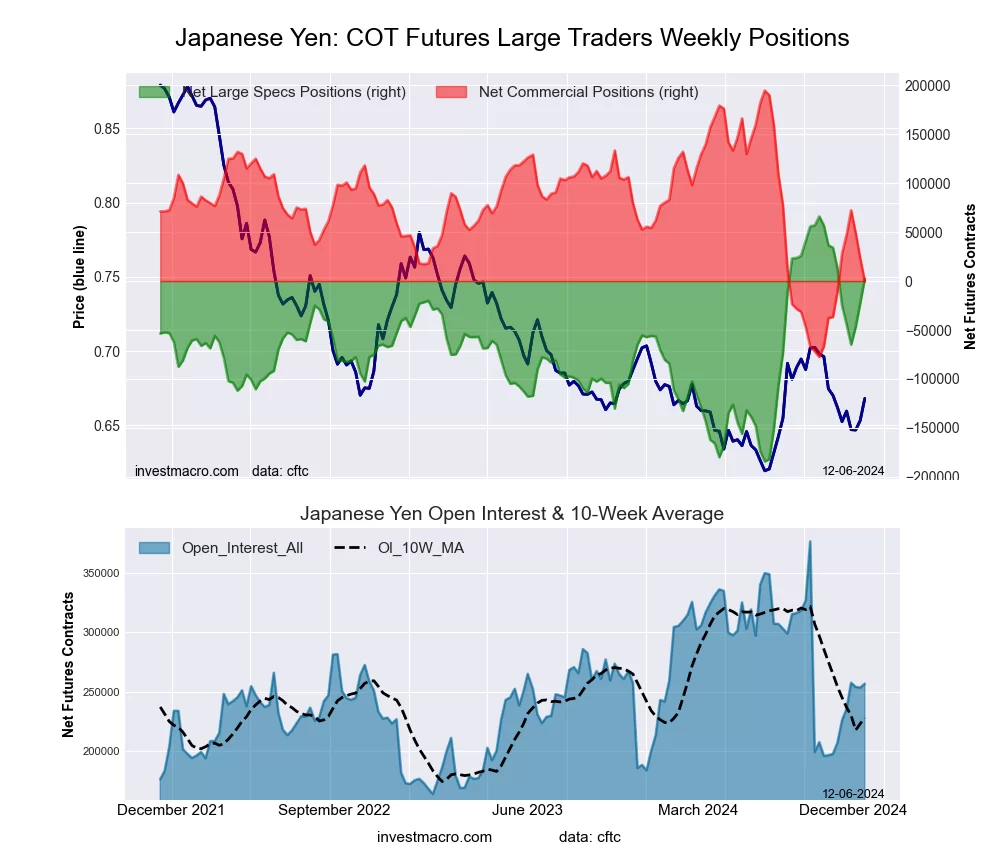 The Japanese Yen large speculator standing this week totaled a net position of 2,334 contracts in the data reported through Tuesday. This was a weekly boost of 24,967 contracts from the previous week which had a total of -22,633 net contracts.
This week’s current strength score (the trader positioning range over the past three years, measured from 0 to 100) shows the speculators are currently Bullish with a score of 74.6 percent. The commercials are Bearish with a score of 28.4 percent and the small traders (not shown in chart) are Bullish with a score of 58.4 percent.
Price Trend-Following Model: Downtrend
Our weekly trend-following model classifies the current market price position as: Downtrend.
| JAPANESE YEN Statistics | SPECULATORS | COMMERCIALS | SMALL TRADERS |
| – Percent of Open Interest Longs: | 36.5 | 43.3 | 15.4 |
| – Percent of Open Interest Shorts: | 35.5 | 43.3 | 16.2 |
| – Net Position: | 2,334 | -164 | -2,170 |
| – Gross Longs: | 93,622 | 111,171 | 39,431 |
| – Gross Shorts: | 91,288 | 111,335 | 41,601 |
| – Long to Short Ratio: | 1.0 to 1 | 1.0 to 1 | 0.9 to 1 |
| NET POSITION TREND: | | | |
| – Strength Index Score (3 Year Range Pct): | 74.6 | 28.4 | 58.4 |
| – Strength Index Reading (3 Year Range): | Bullish | Bearish | Bullish |
| NET POSITION MOVEMENT INDEX: | | | |
| – 6-Week Change in Strength Index: | -4.2 | 3.8 | -0.1 |
Swiss Franc Futures:
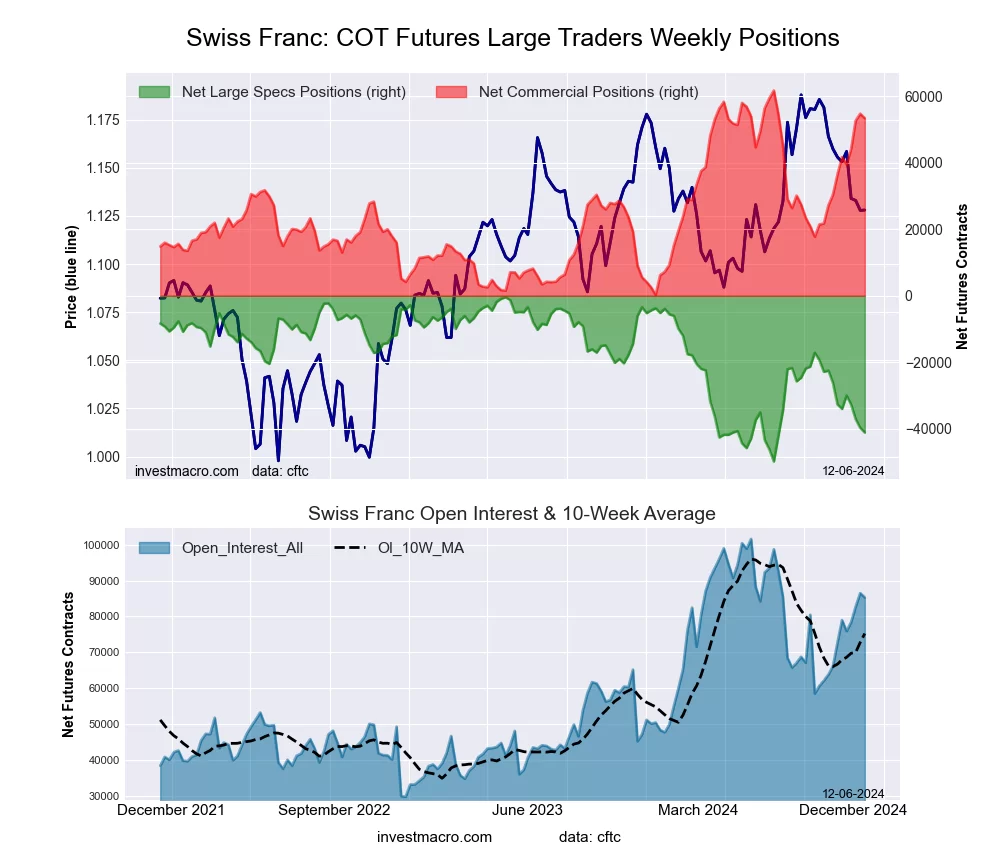 The Swiss Franc large speculator standing this week totaled a net position of -41,094 contracts in the data reported through Tuesday. This was a weekly reduction of -1,418 contracts from the previous week which had a total of -39,676 net contracts.
This week’s current strength score (the trader positioning range over the past three years, measured from 0 to 100) shows the speculators are currently Bearish-Extreme with a score of 17.6 percent. The commercials are Bullish-Extreme with a score of 86.4 percent and the small traders (not shown in chart) are Bearish with a score of 20.6 percent.
Price Trend-Following Model: Strong Downtrend
Our weekly trend-following model classifies the current market price position as: Strong Downtrend.
| SWISS FRANC Statistics | SPECULATORS | COMMERCIALS | SMALL TRADERS |
| – Percent of Open Interest Longs: | 5.7 | 83.0 | 11.2 |
| – Percent of Open Interest Shorts: | 53.9 | 20.4 | 25.6 |
| – Net Position: | -41,094 | 53,351 | -12,257 |
| – Gross Longs: | 4,874 | 70,719 | 9,565 |
| – Gross Shorts: | 45,968 | 17,368 | 21,822 |
| – Long to Short Ratio: | 0.1 to 1 | 4.1 to 1 | 0.4 to 1 |
| NET POSITION TREND: | | | |
| – Strength Index Score (3 Year Range Pct): | 17.6 | 86.4 | 20.6 |
| – Strength Index Reading (3 Year Range): | Bearish-Extreme | Bullish-Extreme | Bearish |
| NET POSITION MOVEMENT INDEX: | | | |
| – 6-Week Change in Strength Index: | -17.1 | 27.6 | -39.0 |
Canadian Dollar Futures:
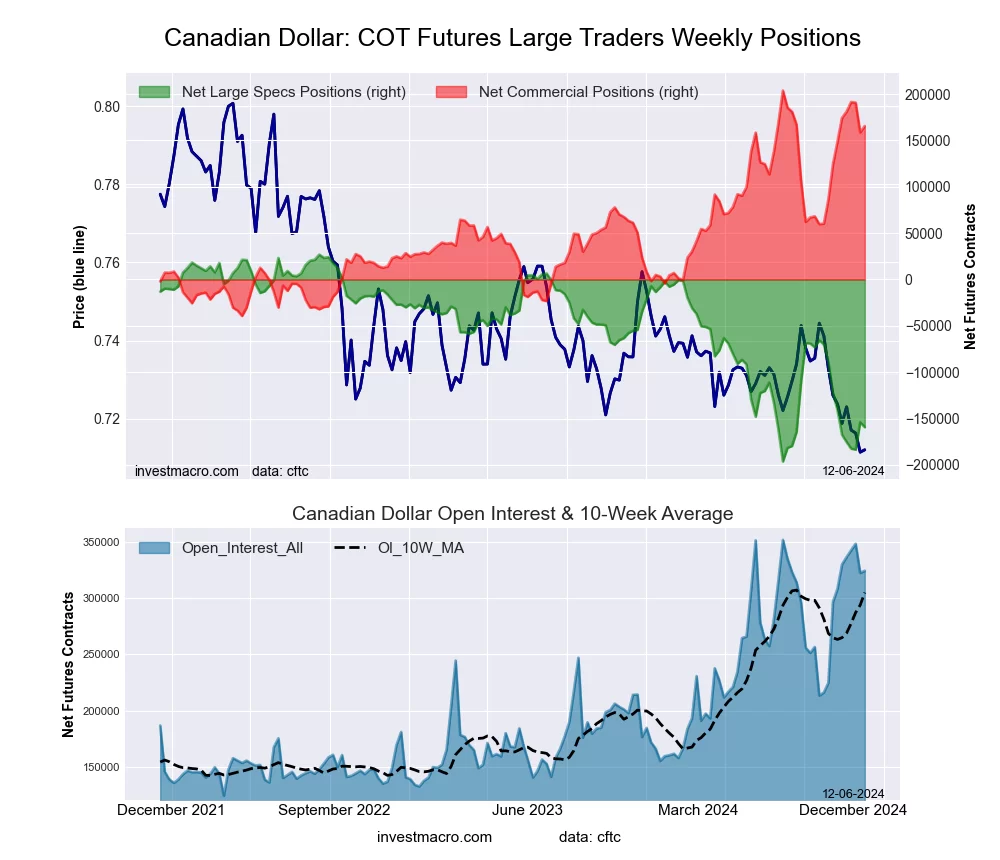 The Canadian Dollar large speculator standing this week totaled a net position of -159,346 contracts in the data reported through Tuesday. This was a weekly decrease of -5,344 contracts from the previous week which had a total of -154,002 net contracts.
This week’s current strength score (the trader positioning range over the past three years, measured from 0 to 100) shows the speculators are currently Bearish-Extreme with a score of 16.5 percent. The commercials are Bullish-Extreme with a score of 84.3 percent and the small traders (not shown in chart) are Bearish-Extreme with a score of 12.6 percent.
Price Trend-Following Model: Strong Downtrend
Our weekly trend-following model classifies the current market price position as: Strong Downtrend.
| CANADIAN DOLLAR Statistics | SPECULATORS | COMMERCIALS | SMALL TRADERS |
| – Percent of Open Interest Longs: | 6.7 | 80.7 | 9.7 |
| – Percent of Open Interest Shorts: | 55.8 | 29.6 | 11.6 |
| – Net Position: | -159,346 | 165,505 | -6,159 |
| – Gross Longs: | 21,696 | 261,571 | 31,609 |
| – Gross Shorts: | 181,042 | 96,066 | 37,768 |
| – Long to Short Ratio: | 0.1 to 1 | 2.7 to 1 | 0.8 to 1 |
| NET POSITION TREND: | | | |
| – Strength Index Score (3 Year Range Pct): | 16.5 | 84.3 | 12.6 |
| – Strength Index Reading (3 Year Range): | Bearish-Extreme | Bullish-Extreme | Bearish-Extreme |
| NET POSITION MOVEMENT INDEX: | | | |
| – 6-Week Change in Strength Index: | -8.4 | 6.9 | 5.6 |
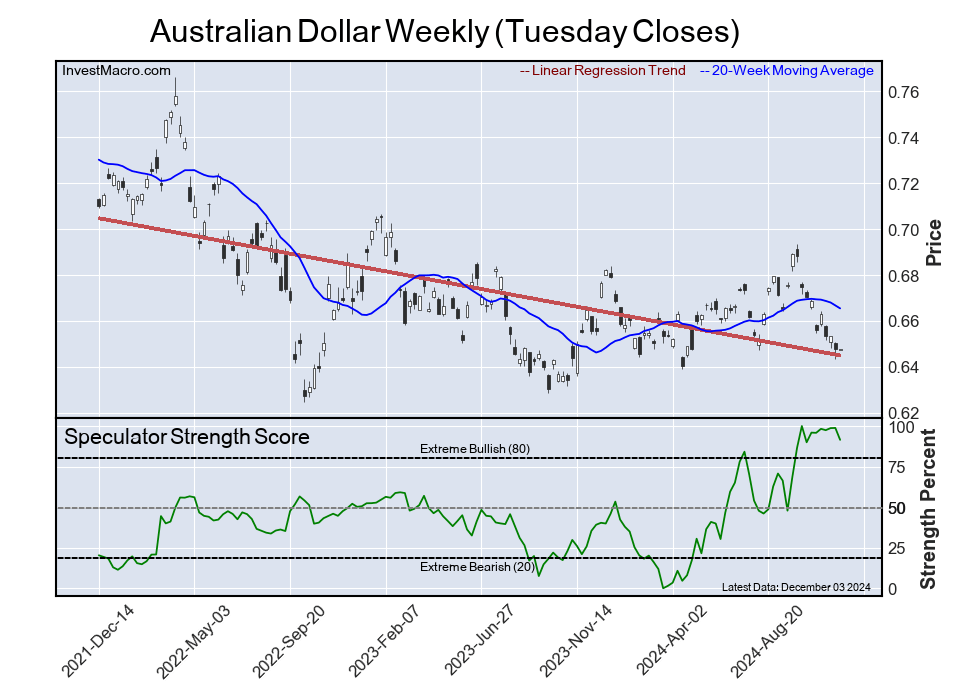
Australian Dollar Futures:
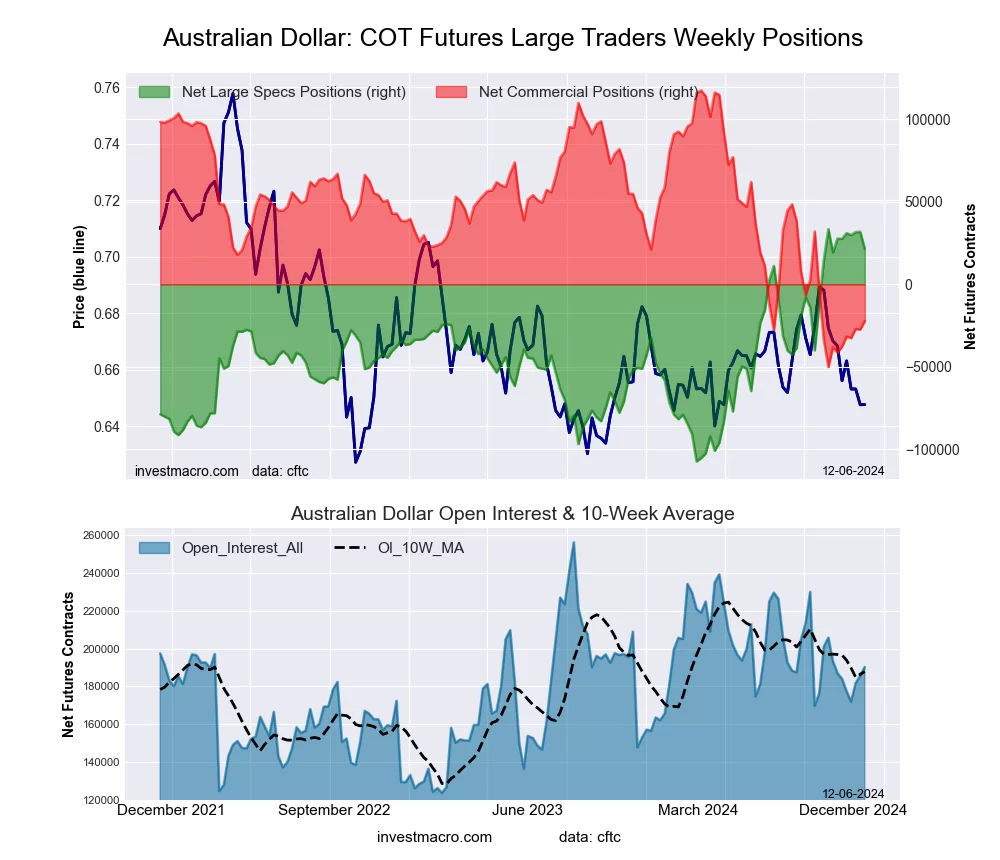 The Australian Dollar large speculator standing this week totaled a net position of 21,401 contracts in the data reported through Tuesday. This was a weekly decrease of -10,375 contracts from the previous week which had a total of 31,776 net contracts.
This week’s current strength score (the trader positioning range over the past three years, measured from 0 to 100) shows the speculators are currently Bullish-Extreme with a score of 91.5 percent. The commercials are Bearish-Extreme with a score of 16.7 percent and the small traders (not shown in chart) are Bullish with a score of 52.5 percent.
Price Trend-Following Model: Strong Downtrend
Our weekly trend-following model classifies the current market price position as: Strong Downtrend.
| AUSTRALIAN DOLLAR Statistics | SPECULATORS | COMMERCIALS | SMALL TRADERS |
| – Percent of Open Interest Longs: | 45.6 | 37.4 | 13.5 |
| – Percent of Open Interest Shorts: | 34.3 | 49.1 | 13.0 |
| – Net Position: | 21,401 | -22,286 | 885 |
| – Gross Longs: | 86,699 | 71,206 | 25,601 |
| – Gross Shorts: | 65,298 | 93,492 | 24,716 |
| – Long to Short Ratio: | 1.3 to 1 | 0.8 to 1 | 1.0 to 1 |
| NET POSITION TREND: | | | |
| – Strength Index Score (3 Year Range Pct): | 91.5 | 16.7 | 52.5 |
| – Strength Index Reading (3 Year Range): | Bullish-Extreme | Bearish-Extreme | Bullish |
| NET POSITION MOVEMENT INDEX: | | | |
| – 6-Week Change in Strength Index: | -4.5 | 11.5 | -33.4 |
New Zealand Dollar Futures:
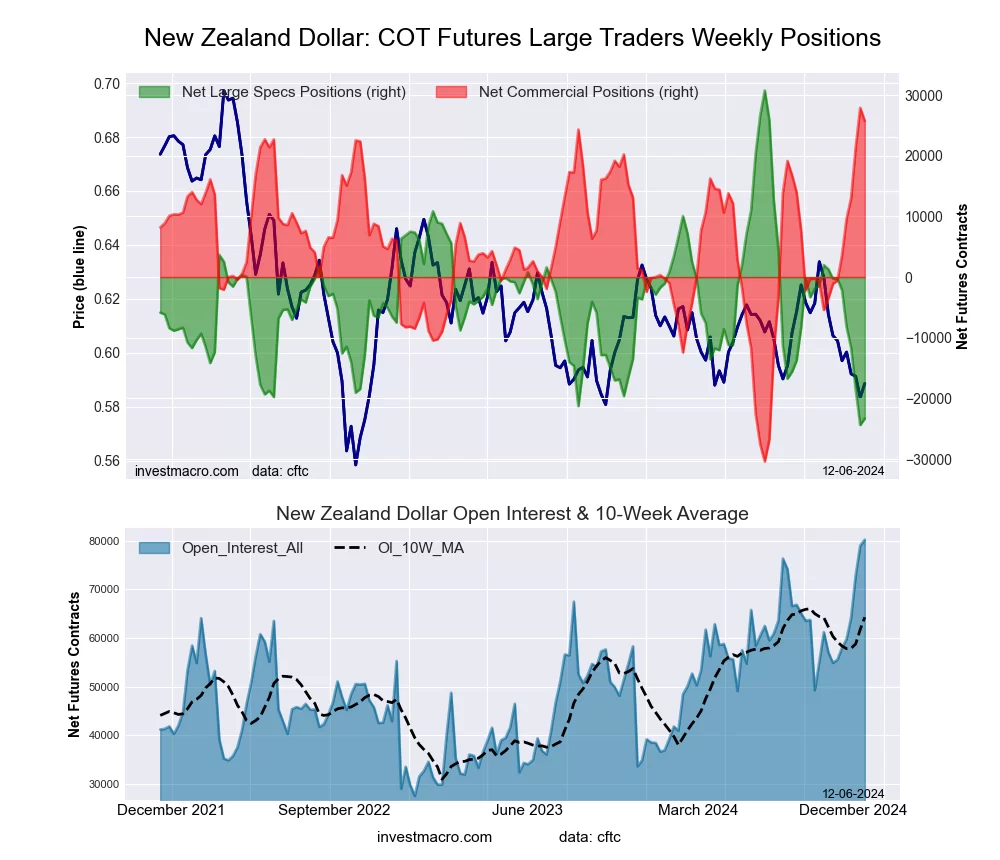 The New Zealand Dollar large speculator standing this week totaled a net position of -23,308 contracts in the data reported through Tuesday. This was a weekly rise of 1,073 contracts from the previous week which had a total of -24,381 net contracts.
This week’s current strength score (the trader positioning range over the past three years, measured from 0 to 100) shows the speculators are currently Bearish-Extreme with a score of 1.9 percent. The commercials are Bullish-Extreme with a score of 96.3 percent and the small traders (not shown in chart) are Bearish with a score of 22.6 percent.
Price Trend-Following Model: Strong Downtrend
Our weekly trend-following model classifies the current market price position as: Strong Downtrend.
| NEW ZEALAND DOLLAR Statistics | SPECULATORS | COMMERCIALS | SMALL TRADERS |
| – Percent of Open Interest Longs: | 26.4 | 66.5 | 4.3 |
| – Percent of Open Interest Shorts: | 55.5 | 34.4 | 7.3 |
| – Net Position: | -23,308 | 25,730 | -2,422 |
| – Gross Longs: | 21,213 | 53,338 | 3,446 |
| – Gross Shorts: | 44,521 | 27,608 | 5,868 |
| – Long to Short Ratio: | 0.5 to 1 | 1.9 to 1 | 0.6 to 1 |
| NET POSITION TREND: | | | |
| – Strength Index Score (3 Year Range Pct): | 1.9 | 96.3 | 22.6 |
| – Strength Index Reading (3 Year Range): | Bearish-Extreme | Bullish-Extreme | Bearish |
| NET POSITION MOVEMENT INDEX: | | | |
| – 6-Week Change in Strength Index: | -41.7 | 45.1 | -41.8 |
Mexican Peso Futures:
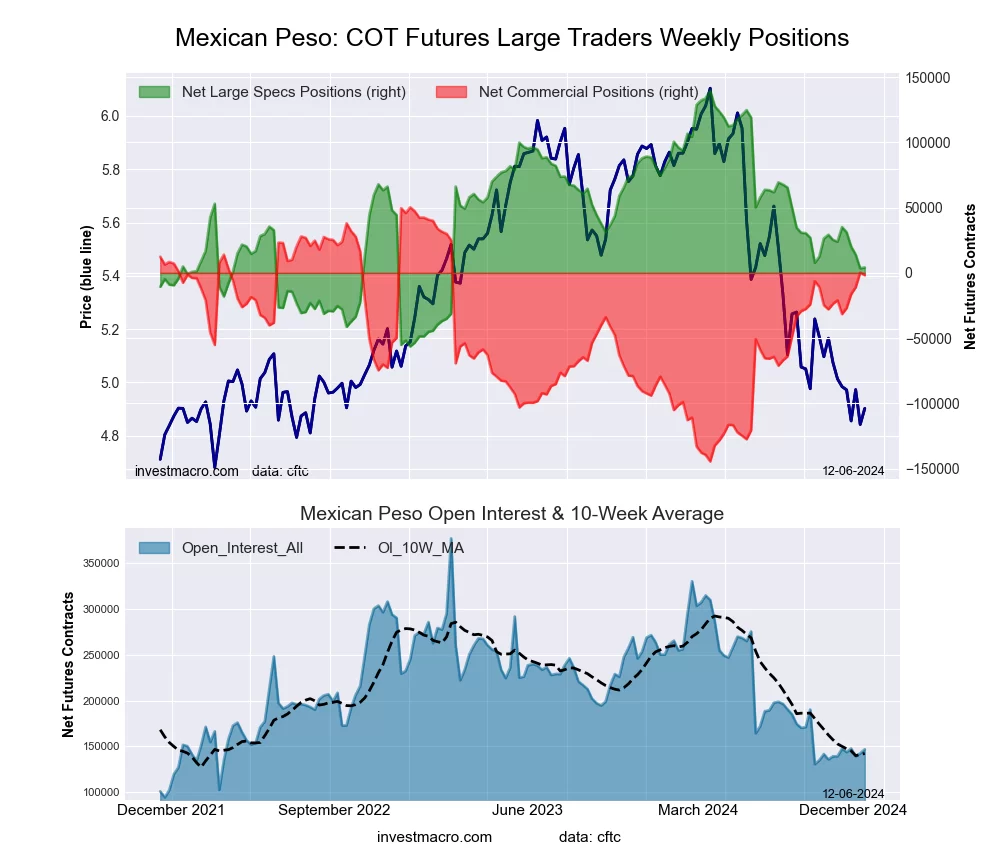 The Mexican Peso large speculator standing this week totaled a net position of 4,184 contracts in the data reported through Tuesday. This was a weekly advance of 726 contracts from the previous week which had a total of 3,458 net contracts.
This week’s current strength score (the trader positioning range over the past three years, measured from 0 to 100) shows the speculators are currently Bearish with a score of 30.9 percent. The commercials are Bullish with a score of 73.2 percent and the small traders (not shown in chart) are Bearish-Extreme with a score of 9.7 percent.
Price Trend-Following Model: Downtrend
Our weekly trend-following model classifies the current market price position as: Downtrend.
| MEXICAN PESO Statistics | SPECULATORS | COMMERCIALS | SMALL TRADERS |
| – Percent of Open Interest Longs: | 37.5 | 52.5 | 2.6 |
| – Percent of Open Interest Shorts: | 34.7 | 53.8 | 4.2 |
| – Net Position: | 4,184 | -1,838 | -2,346 |
| – Gross Longs: | 55,114 | 77,150 | 3,777 |
| – Gross Shorts: | 50,930 | 78,988 | 6,123 |
| – Long to Short Ratio: | 1.1 to 1 | 1.0 to 1 | 0.6 to 1 |
| NET POSITION TREND: | | | |
| – Strength Index Score (3 Year Range Pct): | 30.9 | 73.2 | 9.7 |
| – Strength Index Reading (3 Year Range): | Bearish | Bullish | Bearish-Extreme |
| NET POSITION MOVEMENT INDEX: | | | |
| – 6-Week Change in Strength Index: | -10.1 | 9.8 | 3.1 |
Brazilian Real Futures:
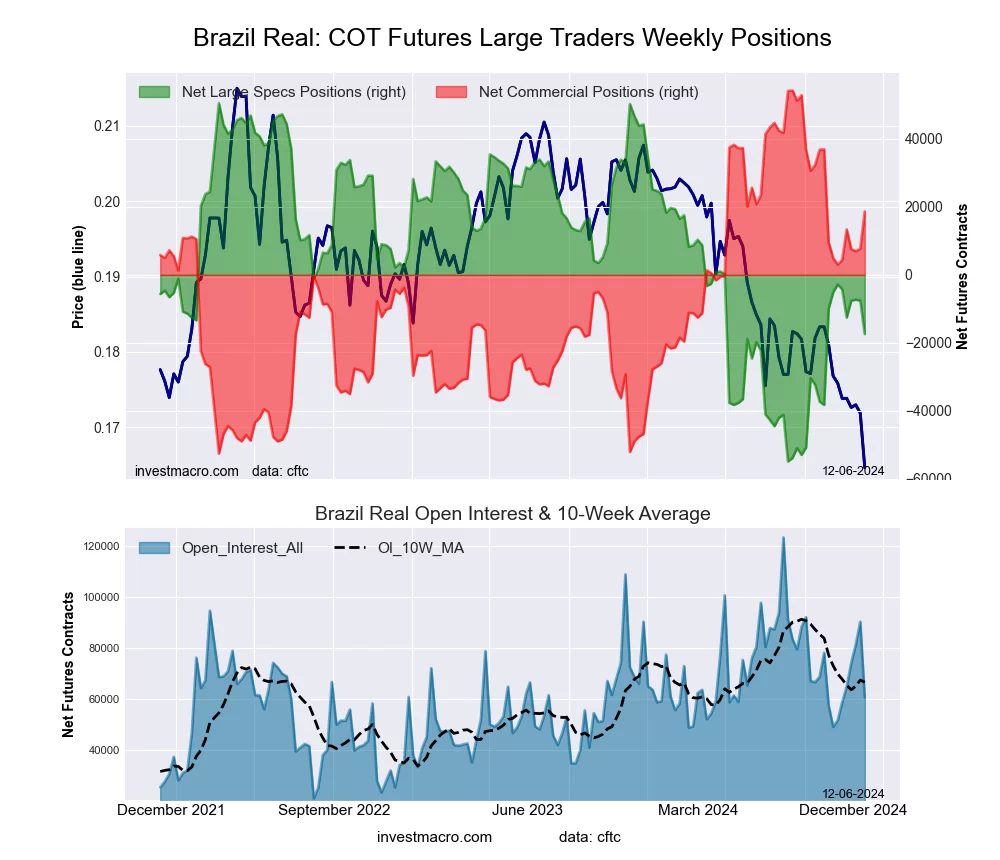 The Brazilian Real large speculator standing this week totaled a net position of -17,414 contracts in the data reported through Tuesday. This was a weekly decrease of -9,847 contracts from the previous week which had a total of -7,567 net contracts.
This week’s current strength score (the trader positioning range over the past three years, measured from 0 to 100) shows the speculators are currently Bearish with a score of 35.6 percent. The commercials are Bullish with a score of 66.7 percent and the small traders (not shown in chart) are Bearish-Extreme with a score of 13.9 percent.
Price Trend-Following Model: Strong Downtrend
Our weekly trend-following model classifies the current market price position as: Strong Downtrend.
| BRAZIL REAL Statistics | SPECULATORS | COMMERCIALS | SMALL TRADERS |
| – Percent of Open Interest Longs: | 42.6 | 53.5 | 3.6 |
| – Percent of Open Interest Shorts: | 71.4 | 22.7 | 5.7 |
| – Net Position: | -17,414 | 18,647 | -1,233 |
| – Gross Longs: | 25,853 | 32,419 | 2,213 |
| – Gross Shorts: | 43,267 | 13,772 | 3,446 |
| – Long to Short Ratio: | 0.6 to 1 | 2.4 to 1 | 0.6 to 1 |
| NET POSITION TREND: | | | |
| – Strength Index Score (3 Year Range Pct): | 35.6 | 66.7 | 13.9 |
| – Strength Index Reading (3 Year Range): | Bearish | Bullish | Bearish-Extreme |
| NET POSITION MOVEMENT INDEX: | | | |
| – 6-Week Change in Strength Index: | -13.9 | 14.6 | -5.7 |
Bitcoin Futures:
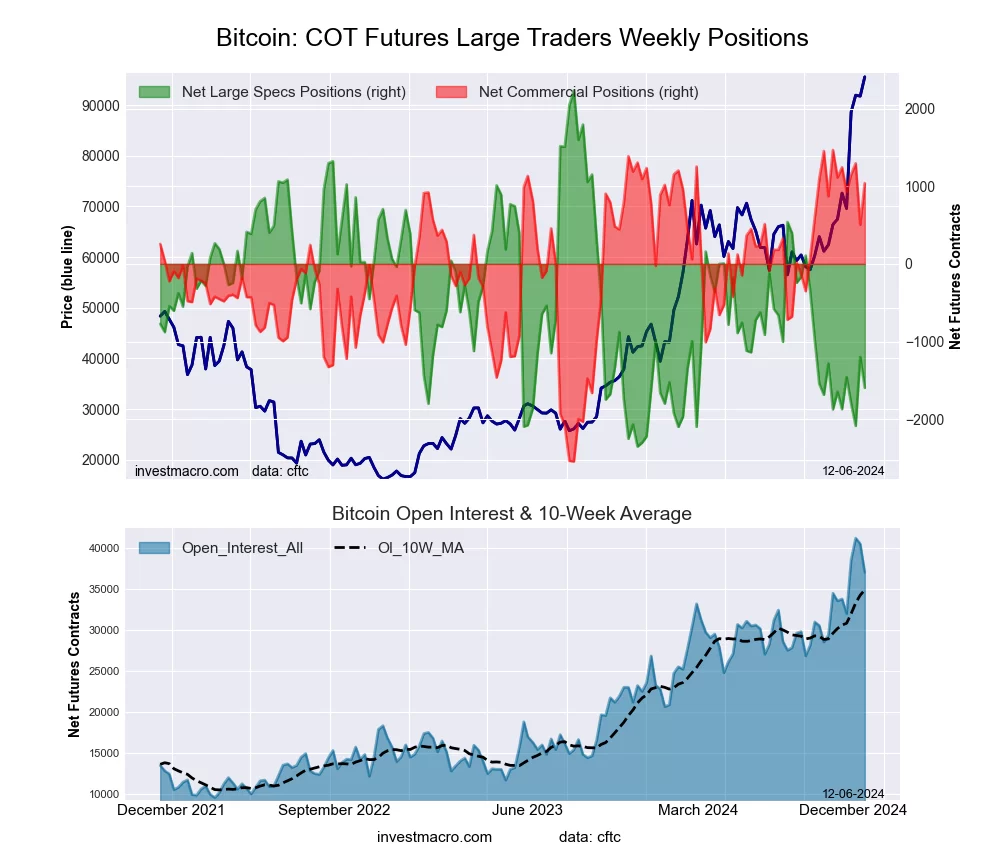 The Bitcoin large speculator standing this week totaled a net position of -1,595 contracts in the data reported through Tuesday. This was a weekly decrease of -399 contracts from the previous week which had a total of -1,196 net contracts.
This week’s current strength score (the trader positioning range over the past three years, measured from 0 to 100) shows the speculators are currently Bearish-Extreme with a score of 16.5 percent. The commercials are Bullish-Extreme with a score of 89.4 percent and the small traders (not shown in chart) are Bullish with a score of 51.4 percent.
Price Trend-Following Model: Strong Uptrend
Our weekly trend-following model classifies the current market price position as: Strong Uptrend.
| BITCOIN Statistics | SPECULATORS | COMMERCIALS | SMALL TRADERS |
| – Percent of Open Interest Longs: | 82.7 | 4.4 | 4.3 |
| – Percent of Open Interest Shorts: | 87.0 | 1.6 | 2.8 |
| – Net Position: | -1,595 | 1,040 | 555 |
| – Gross Longs: | 30,625 | 1,615 | 1,600 |
| – Gross Shorts: | 32,220 | 575 | 1,045 |
| – Long to Short Ratio: | 1.0 to 1 | 2.8 to 1 | 1.5 to 1 |
| NET POSITION TREND: | | | |
| – Strength Index Score (3 Year Range Pct): | 16.5 | 89.4 | 51.4 |
| – Strength Index Reading (3 Year Range): | Bearish-Extreme | Bullish-Extreme | Bullish |
| NET POSITION MOVEMENT INDEX: | | | |
| – 6-Week Change in Strength Index: | 1.1 | -1.8 | 1.8 |
Article By InvestMacro – Receive our weekly COT Newsletter
*COT Report: The COT data, released weekly to the public each Friday, is updated through the most recent Tuesday (data is 3 days old) and shows a quick view of how large speculators or non-commercials (for-profit traders) were positioned in the futures markets.
The CFTC categorizes trader positions according to commercial hedgers (traders who use futures contracts for hedging as part of the business), non-commercials (large traders who speculate to realize trading profits) and nonreportable traders (usually small traders/speculators) as well as their open interest (contracts open in the market at time of reporting). See CFTC criteria here.