By InvestMacro Research
The fourth quarter of 2024 is more than two-thirds through and most companies have released their third-quarter results. Today, we wanted to highlight some of the top Medium Cap companies that have been added to our Cosmic Rays Watchlist. The Cosmic Rays Watchlist is the output from our proprietary fundamental analysis algorithm.
The algo examines company fundamental metrics, earnings trends and overall sector strength trends. The aim is identify quality dividend-paying companies on the NYSE and Nasdaq stock exchanges. If a company scores over 50, it gets added to our Watchlist for further analysis.
We use this system as a stock market ideas generator and to update our Watchlist every quarter. However, be aware the fundamental system does not take the stock price as a direct element in our rating so one must compare each idea with their current stock prices (this is not a timing tool).
Disclaimer: The US stock markets continue to reach new all-time highs and this should always factor into the decision-making of buying any asset. Many major studies are consistently showing overvalued markets at the current time.
As with all investment ideas, past performance does not guarantee future results. A stock added to our list is not a recommendation to buy or sell the security.
Here we go with 5 of our Top Medium Cap Stocks scored in Q3 2024:
Virtu Financial, Inc. (VIRT): Financial Services
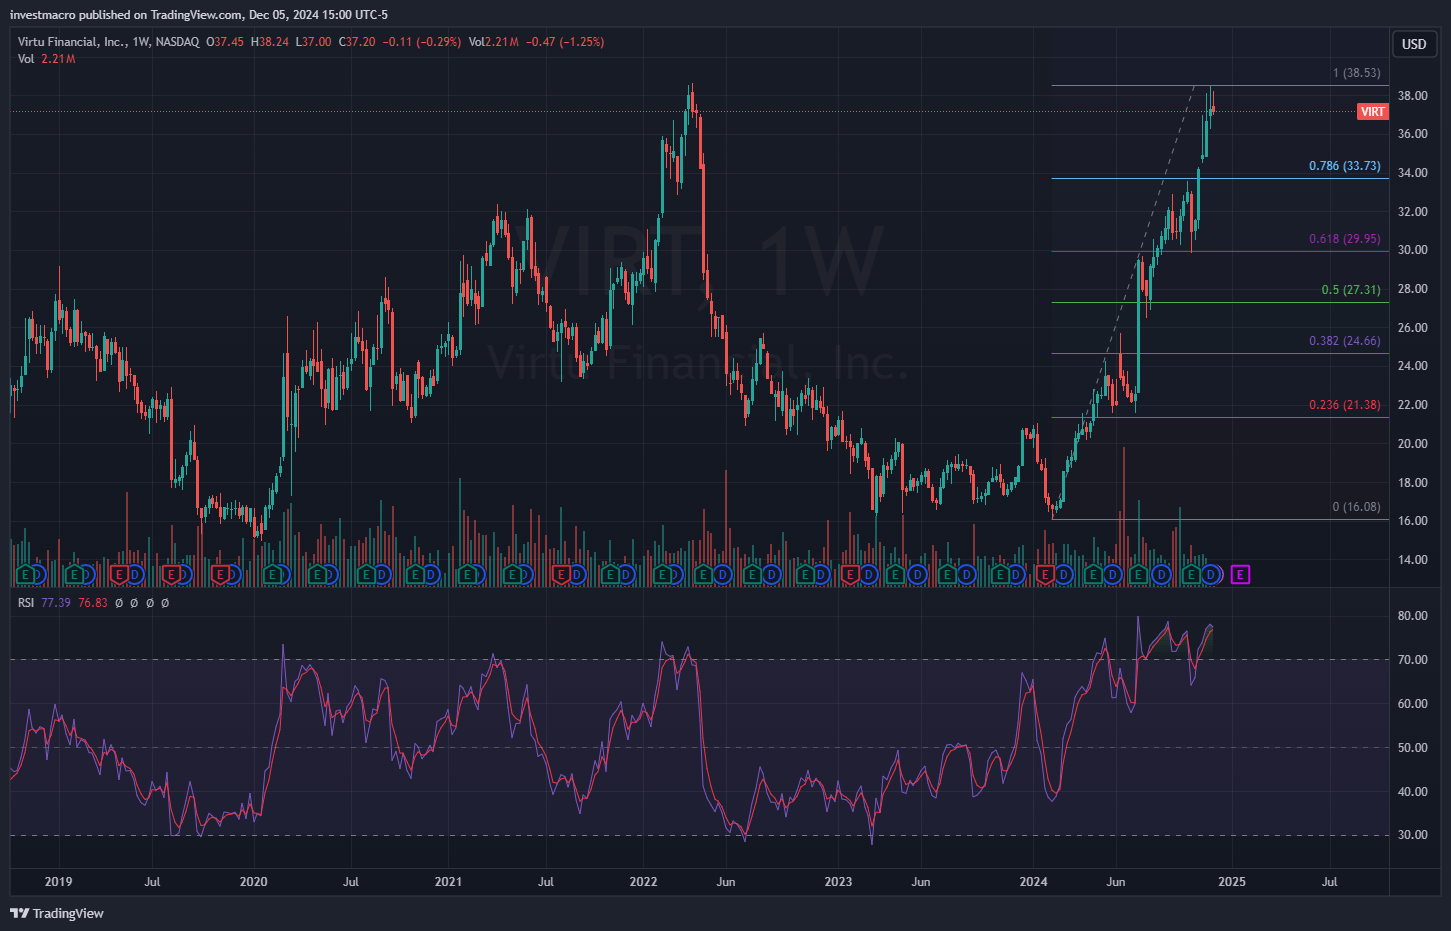
Technically, Virtu is trading at its highest level since 2022 and has an overbought Relative Strength Index (RSI) on the weekly time-frame.
Virtu Financial, Inc. (Symbol: VIRT) was recently added to our Cosmic Rays WatchList. VIRT scored a 60 in our fundamental rating system on October 25th.
At time of writing, only 4.74% of stocks have scored a 60 or better out of a total of 10,674 scores in our earnings database. This stock is on our Watchlist for the first time and rose by 36 system points from our last update. VIRT is a Medium Cap stock and part of the Financial Services sector. The industry focus for VIRT is Financial – Capital Markets.
Virtu has beat earnings expectations three quarters in a row, has a dividend of approximately 2.55 percent and a payout ratio of around 60 percent. The VIRT stock price has handily beat the Financial Sector benchmark over the past 52 weeks — which also warrants a word of caution because the year-to-date price gain is steep at over 80 percent.
Company Description (courtesy of SEC.gov):
Virtu Financial, Inc., a financial services company, provides data, analytics, and connectivity products to clients worldwide. The company operates in two segments, Market Making and Execution Services. Its product suite includes offerings in execution, liquidity sourcing, analytics and broker-neutral, and multi-dealer platforms in workflow technology.
Company Website: https://www.virtu.com
| Asset vs Sector Benchmark: | *P/E Ratio (TTM) | *52-Week Price Return | *Beta (S&P500) |
| – Stock: Virtu Financial, Inc. (VIRT) | 18.5 | 105.63 | 0.37 |
| – Benchmark Symbol: XLF | 22.9 | 38.93 | 1.0 |
* Data through December 02, 2024
Louisiana-Pacific Corporation (LPX): Industrials
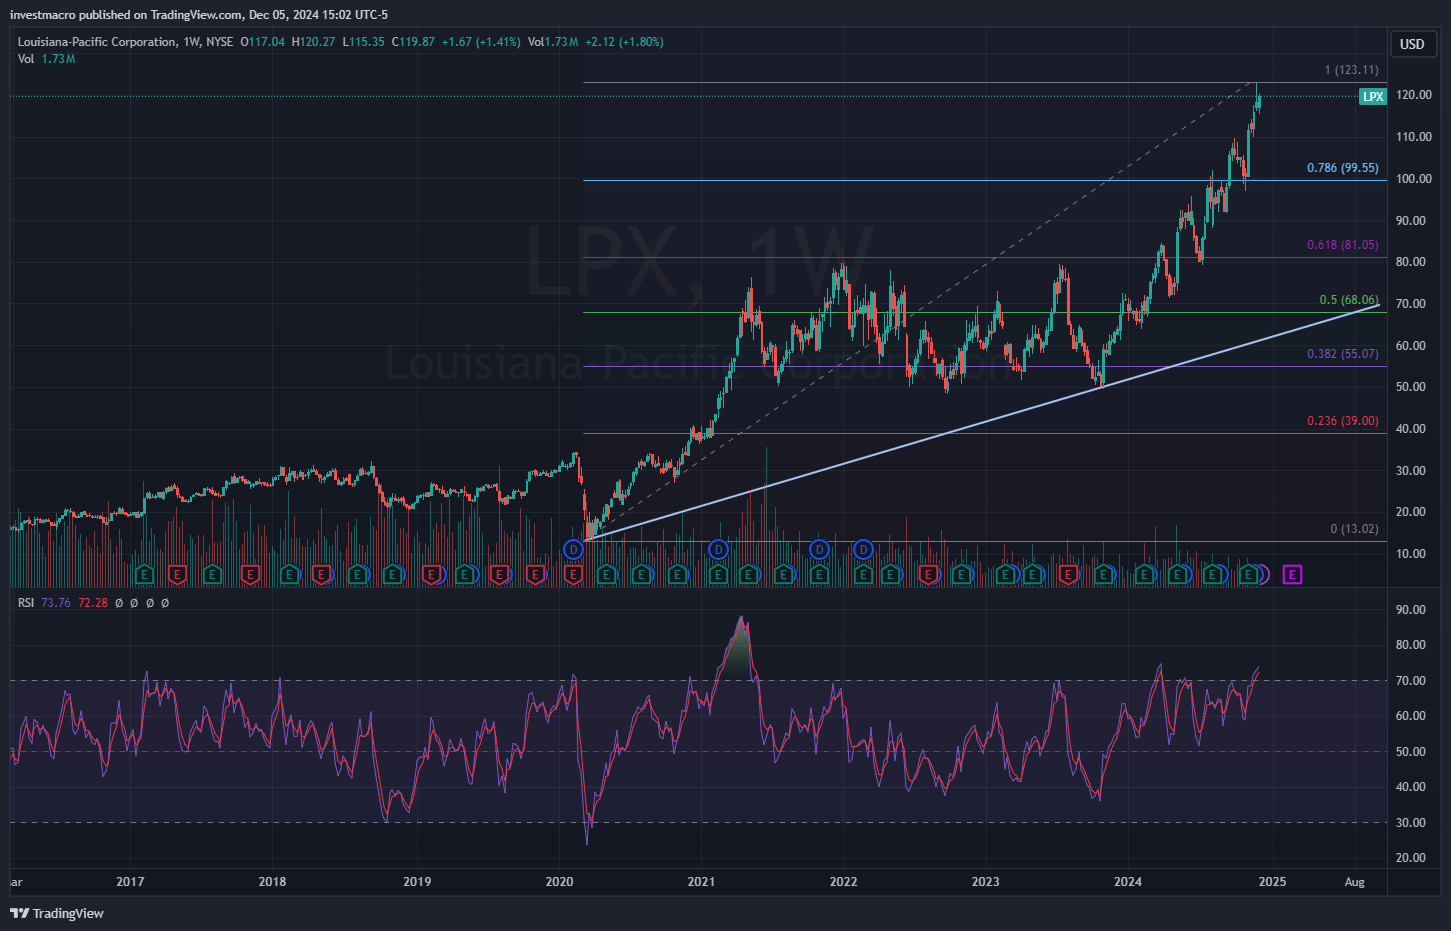
LPX is currently trading at its all-time highs near $120.00 per share and has an overbought Relative Strength Index (RSI) on the weekly time-frame.
Louisiana-Pacific Corporation (Symbol: LPX) was recently added to our Cosmic Rays WatchList. LPX scored a 62 in our fundamental rating system on November 6th.
At time of writing, only 4.74% of stocks have scored a 60 or better out of a total of 10,674 scores in our earnings database. This stock is on our Watchlist for the first time and rose by 72 system points from our last update. LPX is a Medium Cap stock and part of the Industrials sector. The industry focus for LPX is Construction.
Louisiana-Pacific has beat earnings expectations four straight quarters and has a dividend of close to 0.88 percent with a payout ratio of 64 percent. The LPX stock price has also significantly surpassed the Industrials Sector benchmark over the past 52 weeks and is up close to 70 percent year-to-date.
Company Description (courtesy of SEC.gov):
Louisiana-Pacific Corporation, together with its subsidiaries, manufactures and markets building products primarily for use in new home construction, repair and remodeling, and outdoor structure markets. It operates through four segments: Siding; Oriented Strand Board (OSB); Engineered Wood Products (EWP); and South America.
Company Website: https://www.lpcorp.com
| Asset vs Sector Benchmark: | *P/E Ratio (TTM) | *52-Week Price Return | *Beta (S&P500) |
| – Stock: Louisiana-Pacific Corporation (LPX) | 20.6 | 84.18 | 1.88 |
| – Benchmark Symbol: XLI | 30.4 | 30.77 | 1.1 |
* Data through December 02, 2024
CONMED Corporation (CNMD): Healthcare
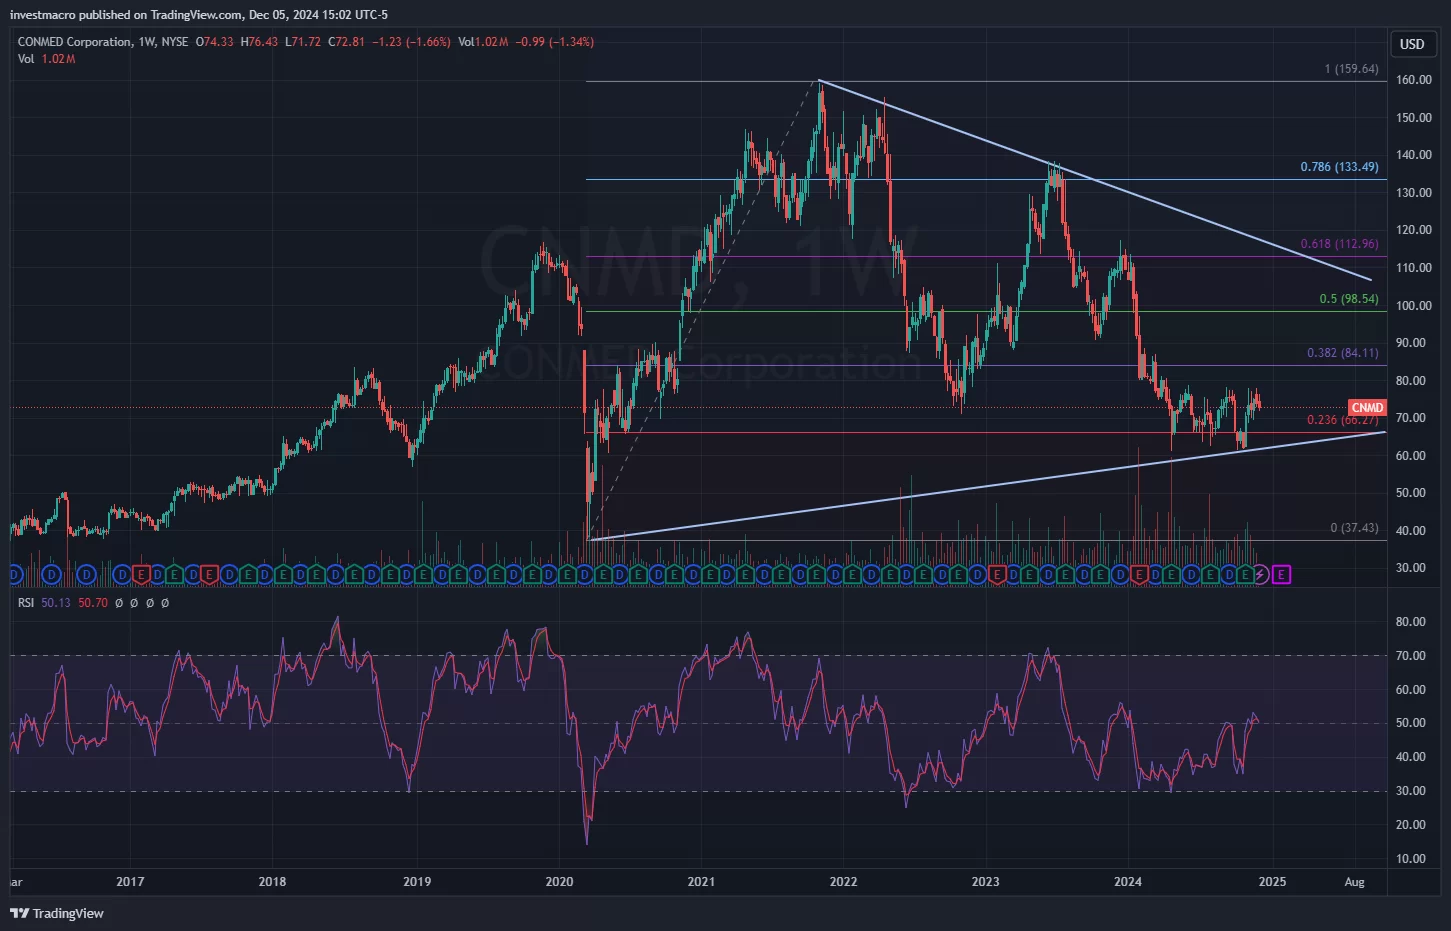
CNMD is trading around the $73.00 threshold currently and is significantly down from the $160.00 highs in 2022. The Relative Strength Index (RSI) is currently at just over the 50 level on the weekly time-frame.
CONMED Corporation (Symbol: CNMD) was recently added to our Cosmic Rays WatchList. CNMD scored a 56 in our fundamental rating system on October 31st.
At time of writing, only 8.17% of stocks have scored a 50 or better out of a total of 10,674 scores in our earnings database. This stock is on our Watchlist for the first time and rose by 14 system points from our last update. CNMD is a Medium Cap stock and part of the Healthcare sector. The industry focus for CNMD is Medical – Devices.
CONMED has beat earnings expectations three consecutive quarters and has a dividend of close to 1.08 percent with a payout ratio near 43 percent. The CNMD stock price has under-performed the Healthcare Sector benchmark over the past 52 weeks by a large margin and is actually down by -33.86 percent year-to-date.
Company Description (courtesy of SEC.gov):
CONMED Corporation, a medical technology company, develops, manufactures, and sells surgical devices and related equipment for surgical procedures worldwide.
Company Website: https://www.conmed.com
| Asset vs Sector Benchmark: | *P/E Ratio (TTM) | *52-Week Price Return | *Beta (S&P500) |
| – Stock: CONMED Corporation (CNMD) | 17.2 | -32.23 | 1.46 |
| – Benchmark Symbol: XLV | 24.6 | 11.65 | 0.7 |
* Data through December 02, 2024
Artisan Partners Asset Management Inc. (APAM): Financial Services
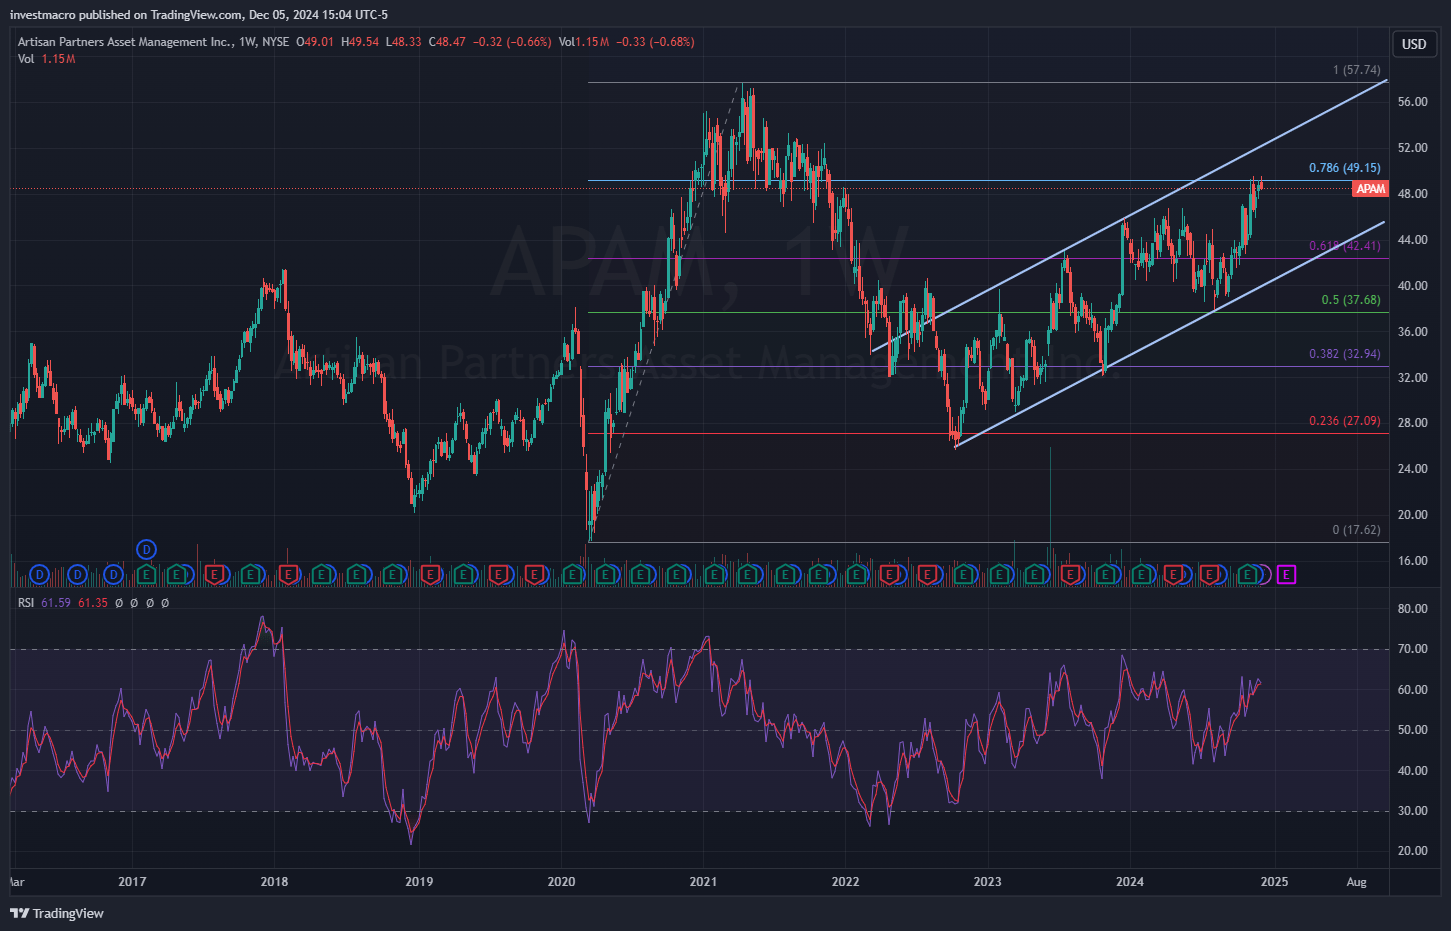
APAM is currently in an uptrend channel right under the $50 per share level with a bullish above 60 Relative Strength Index (RSI) on the weekly time-frame.
Artisan Partners Asset Management Inc. (Symbol: APAM) was recently added to our Cosmic Rays WatchList. APAM scored a 69 in our fundamental rating system on October 30th.
At time of writing, only 4.74% of stocks have scored a 60 or better out of a total of 10,674 scores in our earnings database. This stock is on our Watchlist for the first time and rose by 19 system points from our last update. APAM is a Medium Cap stock and part of the Financial Services sector. The industry focus for APAM is Asset Management.
APAM has beat earnings expectations in October after two close misses in previous quarters and has a dividend of approximately 6.7 percent with a payout ratio near 87 percent. The APAM stock price has under-performed the Financial Sector benchmark over the past 52 weeks but is higher by 9.62 percent year-to-date.
Company Description (courtesy of SEC.gov):
Artisan Partners Asset Management Inc. is publicly owned investment manager. It provides its services to pension and profit sharing plans, trusts, endowments, foundations, charitable organizations, government entities, private funds and non-U.S. funds, as well as mutual funds, non-U.S. funds and collective trusts. It manages separate client-focused equity and fixed income portfolios. The firm invests in the public equity and fixed income markets across the globe.
Company Website: https://www.artisanpartners.com
| Asset vs Sector Benchmark: | *P/E Ratio (TTM) | *52-Week Price Return | *Beta (S&P500) |
| – Stock: Artisan Partners Asset Management Inc. (APAM) | 13.5 | 27.74 | 1.79 |
| – Benchmark Symbol: XLF | 22.9 | 38.93 | 1.0 |
* Data through December 02, 2024
InterDigital, Inc. (IDCC): Technology
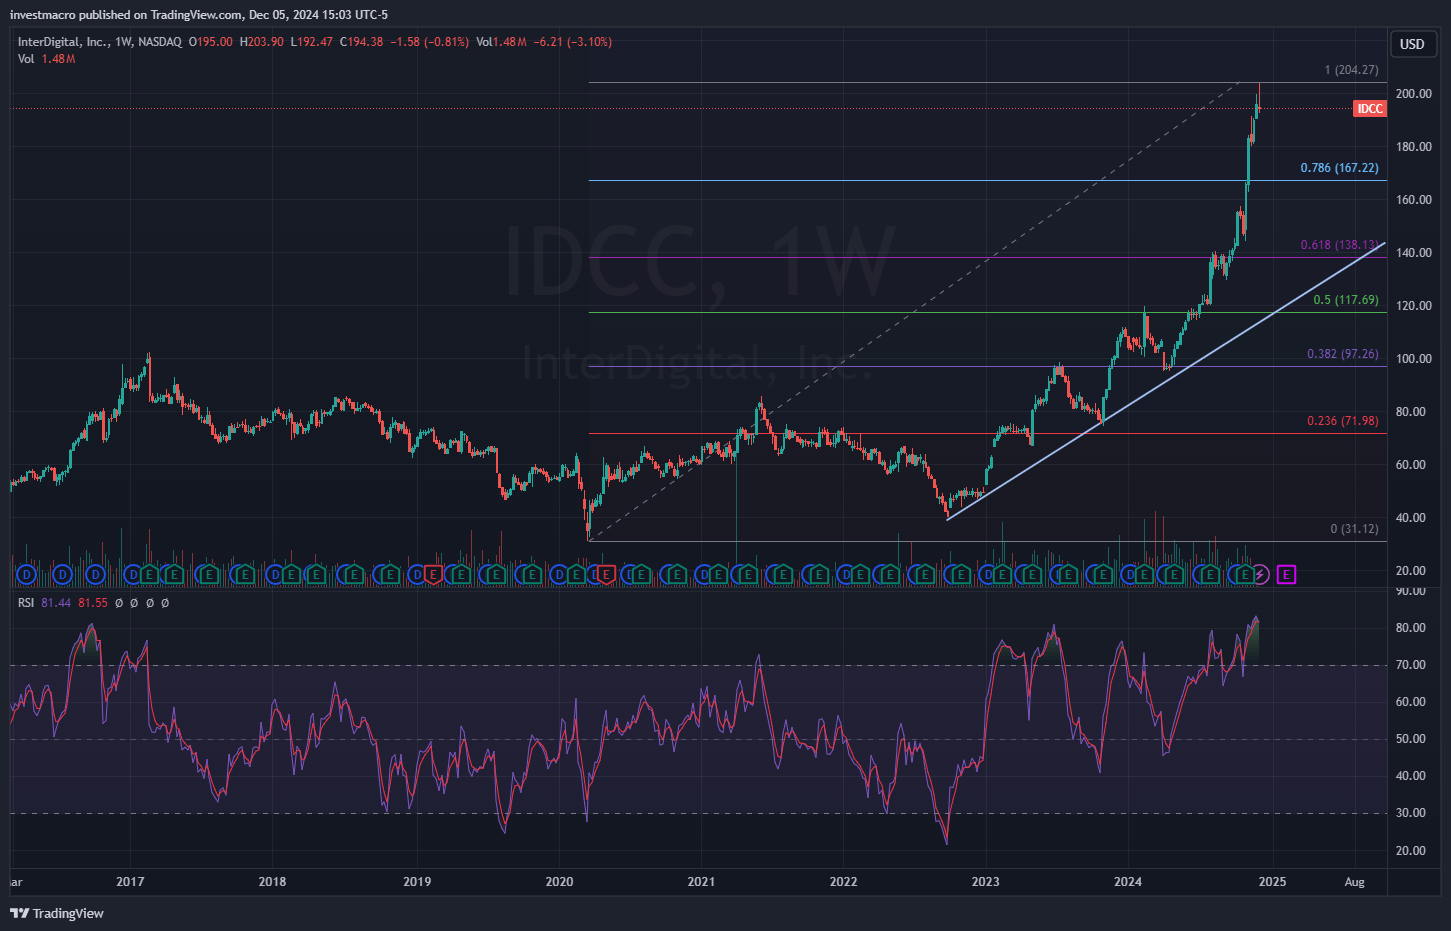
IDCC is currently trading at its all-time highs and challenging the $200.00 per share level. The Relative Strength Index (RSI) is currently overbought on the weekly time-frame.
InterDigital, Inc. (Symbol: IDCC) was recently added to our Cosmic Rays WatchList. IDCC scored a 67 in our fundamental rating system on November 1st.
At time of writing, only 4.74% of stocks have scored a 60 or better out of a total of 10,674 scores in our earnings database. This stock has made our Watchlist a total of 5 times and stayed the same score from our last update. IDCC is a Medium Cap stock and part of the Technology sector. The industry focus for IDCC is Software – Application.
InterDigital has surpassed earnings expectations four quarters in a row and has a dividend of approximately 0.89 percent with a payout ratio of approximately 20 percent. The IDCC stock price has far surpassed the Financial Sector benchmark over the past 52 weeks and is higher by almost 80 percent year-to-date.
Company Description (courtesy of SEC.gov):
InterDigital, Inc., together with its subsidiaries, designs and develops technologies that enable and enhance wireless communications in the United States, China, South Korea, Japan, Taiwan, and Europe. It provides technology solutions for use in digital cellular and wireless products and networks, including 2G, 3G, 4G, 5G, and IEEE 802-related products and networks.
Company Website: https://www.interdigital.com
| Asset vs Sector Benchmark: | *P/E Ratio (TTM) | *52-Week Price Return | *Beta (S&P500) |
| – Stock: InterDigital, Inc. (IDCC) | 21.1 | 96.23 | 1.38 |
| – Benchmark Symbol: XLK | 45.5 | 31.09 | 1.2 |
* Data through December 02, 2024
By InvestMacro – Be sure to join our stock market newsletter to get our updates and to see more top companies we add to our stock watch list.
All information, stock ideas and opinions on this website are for general informational purposes only and do not constitute investment advice. Stock scores are a data driven process through company fundamentals and are not a recommendation to buy or sell a security. Company descriptions provided by sec.gov.