By InvestMacro
Here are the latest charts and statistics for the Commitment of Traders (COT) reports data published by the Commodities Futures Trading Commission (CFTC).
The latest COT data is updated through Tuesday December 10th and shows a quick view of how large traders (for-profit speculators and commercial hedgers) were positioned in the futures markets.
Weekly Speculator Changes led by SOFR 3M & 5-Year Bonds
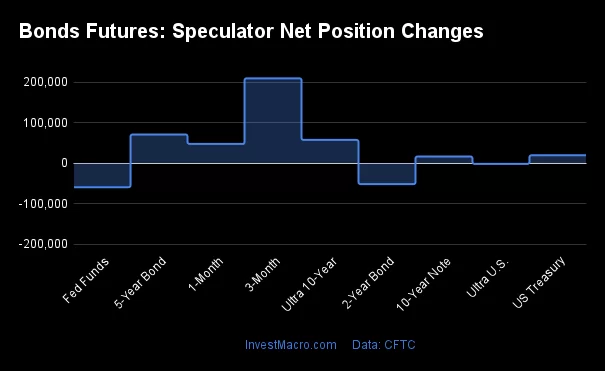
The COT bond market speculator bets were overall higher this week as six out of the nine bond markets we cover had higher positioning while the other three markets had lower speculator contracts.
Leading the gains for the bond markets was the SOFR 3-Months (209,405 contracts) with the 5-Year Bonds (70,670 contracts), the Ultra 10-Year Bonds (57,215 contracts), the SOFR 1-Month (47,335 contracts), the US Treasury Bonds (19,282 contracts) and the 10-Year Bonds (16,185 contracts) also showing positive weeks.
The bond markets with declines in speculator bets for the week were the Fed Funds (-59,567 contracts), the 2-Year Bonds (-52,025 contracts) and the Ultra Treasury Bonds (-2,020 contracts) also having lower bets on the week.
Bonds Net Speculators Leaderboard

Legend: Weekly Speculators Change | Speculators Current Net Position | Speculators Strength Score compared to last 3-Years (0-100 range)
Strength Scores led by Ultra Treasury Bonds & US Treasury Bonds
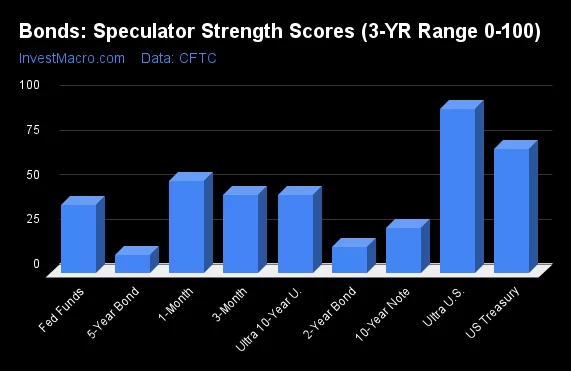
COT Strength Scores (a normalized measure of Speculator positions over a 3-Year range, from 0 to 100 where above 80 is Extreme-Bullish and below 20 is Extreme-Bearish) showed that the Ultra Treasury Bonds (92 percent) and the US Treasury Bonds (70 percent) lead the bond markets this week.
On the downside, the 2-Year Bonds (15 percent) and the 5-Year Bond (10 percent) come in at the lowest strength level currently and are in Extreme-Bearish territory (below 20 percent).
Strength Statistics:
Fed Funds (38.3 percent) vs Fed Funds previous week (49.3 percent)
2-Year Bond (14.7 percent) vs 2-Year Bond previous week (18.0 percent)
5-Year Bond (10.3 percent) vs 5-Year Bond previous week (6.5 percent)
10-Year Bond (25.3 percent) vs 10-Year Bond previous week (23.8 percent)
Ultra 10-Year Bond (43.9 percent) vs Ultra 10-Year Bond previous week (29.3 percent)
US Treasury Bond (69.7 percent) vs US Treasury Bond previous week (63.0 percent)
Ultra US Treasury Bond (91.7 percent) vs Ultra US Treasury Bond previous week (92.5 percent)
SOFR 1-Month (51.4 percent) vs SOFR 1-Month previous week (39.7 percent)
SOFR 3-Months (43.4 percent) vs SOFR 3-Months previous week (32.5 percent)
SOFR 1-Month & Ultra Treasury Bonds top the 6-Week Strength Trends

COT Strength Score Trends (or move index, calculates the 6-week changes in strength scores) showed that the SOFR 1-Month (51 percent) and the Ultra Treasury Bonds (36 percent) lead the past six weeks trends for bonds. The 2-Year Bonds (14 percent) are the next highest positive movers in the latest trends data.
The Fed Funds (-45 percent), the SOFR 3-Months (-14 percent) and the 5-Year Bonds (-6 percent) lead the downside trend scores currently.
Strength Trend Statistics:
Fed Funds (-44.7 percent) vs Fed Funds previous week (-30.5 percent)
2-Year Bond (14.3 percent) vs 2-Year Bond previous week (11.3 percent)
5-Year Bond (-5.9 percent) vs 5-Year Bond previous week (-11.7 percent)
10-Year Bond (2.4 percent) vs 10-Year Bond previous week (-4.1 percent)
Ultra 10-Year Bond (-0.8 percent) vs Ultra 10-Year Bond previous week (-25.4 percent)
US Treasury Bond (5.3 percent) vs US Treasury Bond previous week (5.2 percent)
Ultra US Treasury Bond (35.8 percent) vs Ultra US Treasury Bond previous week (48.9 percent)
SOFR 1-Month (51.4 percent) vs SOFR 1-Month previous week (32.7 percent)
SOFR 3-Months (-14.2 percent) vs SOFR 3-Months previous week (-25.0 percent)
30-Day Federal Funds Futures:
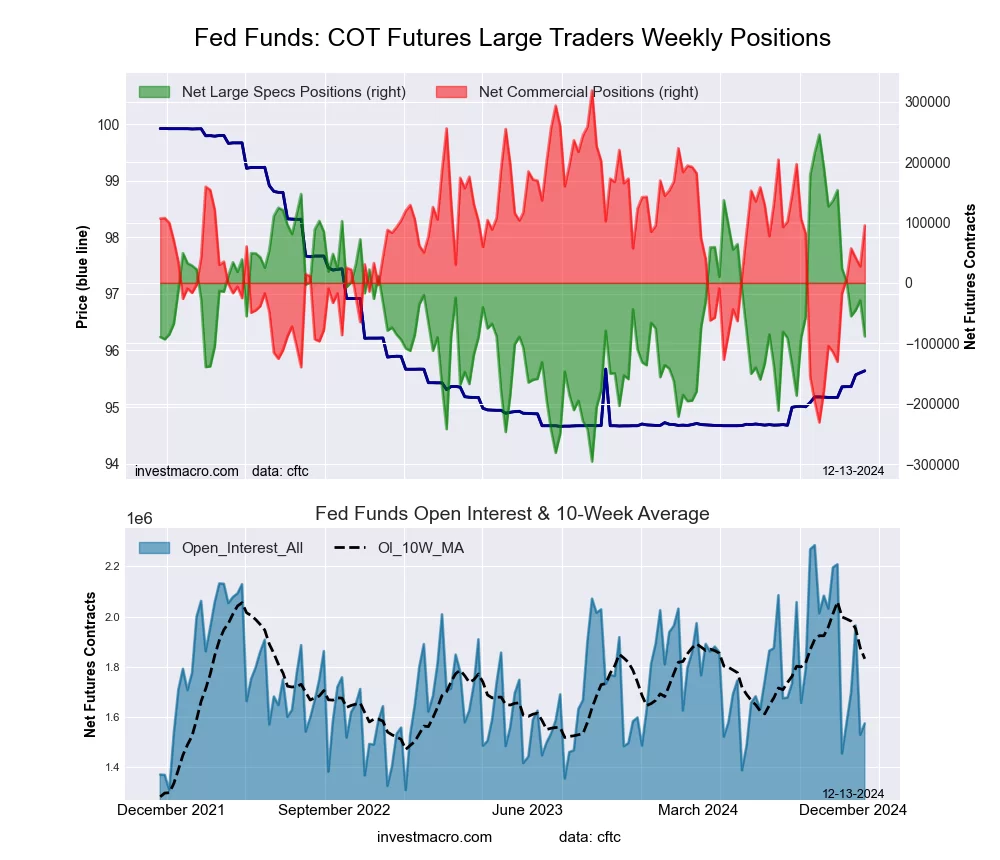 The 30-Day Federal Funds large speculator standing this week resulted in a net position of -88,471 contracts in the data reported through Tuesday. This was a weekly decline of -59,567 contracts from the previous week which had a total of -28,904 net contracts.
This week’s current strength score (the trader positioning range over the past three years, measured from 0 to 100) shows the speculators are currently Bearish with a score of 38.3 percent. The commercials are Bullish with a score of 59.3 percent and the small traders (not shown in chart) are Bullish with a score of 72.9 percent.
Price Trend-Following Model: Downtrend
Our weekly trend-following model classifies the current market price position as: Downtrend. The current action for the model is considered to be: Hold – Maintain Short Position.
| 30-Day Federal Funds Statistics | SPECULATORS | COMMERCIALS | SMALL TRADERS |
| – Percent of Open Interest Longs: | 10.8 | 71.9 | 2.3 |
| – Percent of Open Interest Shorts: | 16.5 | 65.9 | 2.8 |
| – Net Position: | -88,471 | 95,143 | -6,672 |
| – Gross Longs: | 170,536 | 1,131,257 | 36,896 |
| – Gross Shorts: | 259,007 | 1,036,114 | 43,568 |
| – Long to Short Ratio: | 0.7 to 1 | 1.1 to 1 | 0.8 to 1 |
| NET POSITION TREND: | |||
| – Strength Index Score (3 Year Range Pct): | 38.3 | 59.3 | 72.9 |
| – Strength Index Reading (3 Year Range): | Bearish | Bullish | Bullish |
| NET POSITION MOVEMENT INDEX: | |||
| – 6-Week Change in Strength Index: | -44.7 | 41.0 | 30.4 |
Secured Overnight Financing Rate (3-Month) Futures:
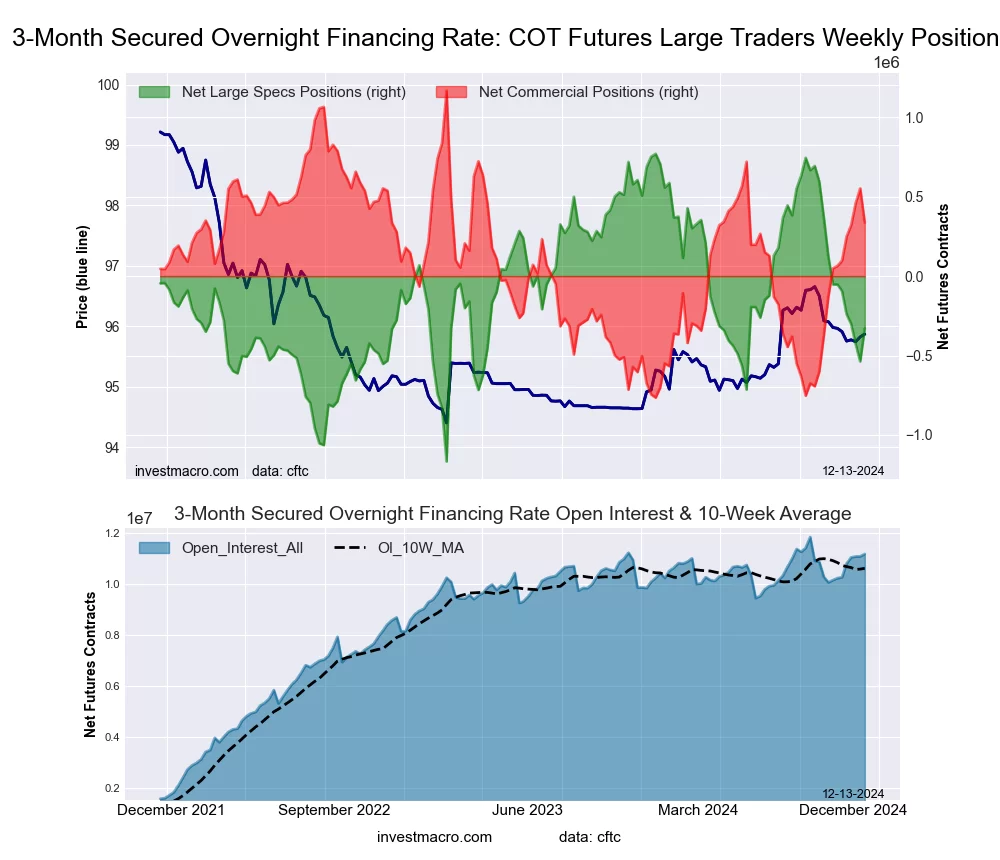 The Secured Overnight Financing Rate (3-Month) large speculator standing this week resulted in a net position of -327,476 contracts in the data reported through Tuesday. This was a weekly lift of 209,405 contracts from the previous week which had a total of -536,881 net contracts.
This week’s current strength score (the trader positioning range over the past three years, measured from 0 to 100) shows the speculators are currently Bearish with a score of 43.4 percent. The commercials are Bullish with a score of 57.0 percent and the small traders (not shown in chart) are Bullish-Extreme with a score of 82.5 percent.
Price Trend-Following Model: Weak Uptrend
Our weekly trend-following model classifies the current market price position as: Weak Uptrend. The current action for the model is considered to be: Hold – Maintain Long Position.
| SOFR 3-Months Statistics | SPECULATORS | COMMERCIALS | SMALL TRADERS |
| – Percent of Open Interest Longs: | 13.1 | 59.2 | 0.3 |
| – Percent of Open Interest Shorts: | 16.1 | 56.2 | 0.4 |
| – Net Position: | -327,476 | 337,197 | -9,721 |
| – Gross Longs: | 1,466,029 | 6,611,792 | 33,875 |
| – Gross Shorts: | 1,793,505 | 6,274,595 | 43,596 |
| – Long to Short Ratio: | 0.8 to 1 | 1.1 to 1 | 0.8 to 1 |
| NET POSITION TREND: | |||
| – Strength Index Score (3 Year Range Pct): | 43.4 | 57.0 | 82.5 |
| – Strength Index Reading (3 Year Range): | Bearish | Bullish | Bullish-Extreme |
| NET POSITION MOVEMENT INDEX: | |||
| – 6-Week Change in Strength Index: | -14.2 | 14.1 | 1.3 |
Individual Bond Markets:
Secured Overnight Financing Rate (1-Month) Futures:
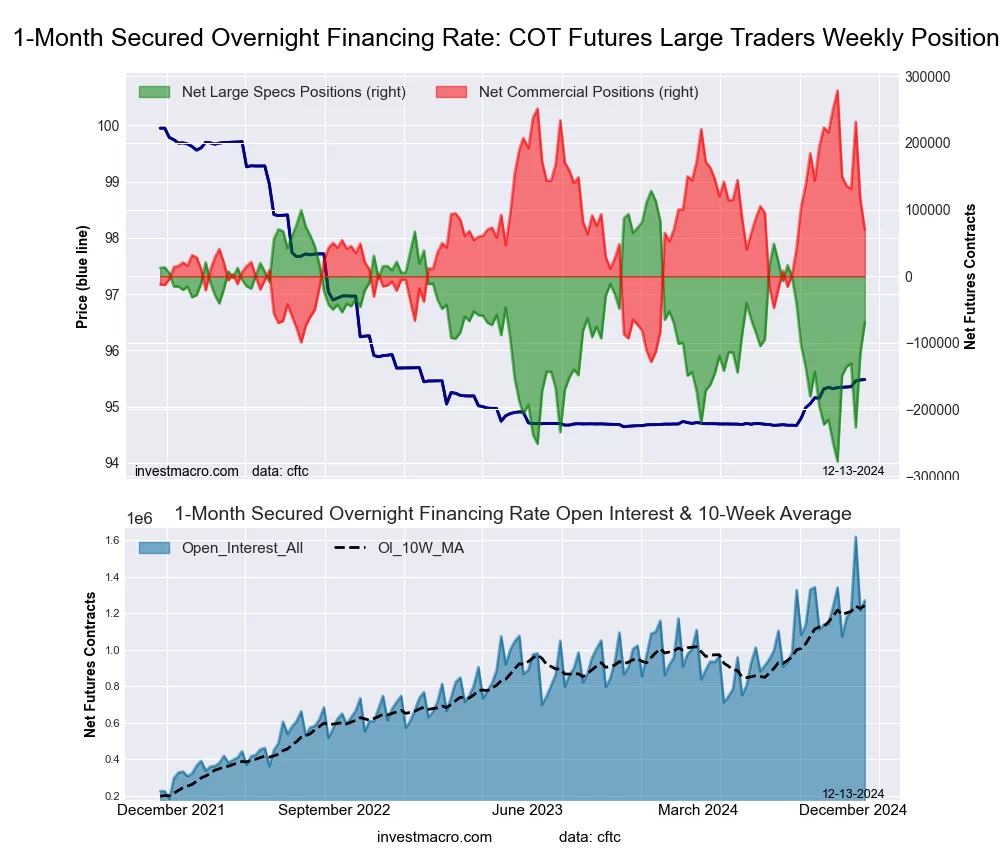 The Secured Overnight Financing Rate (1-Month) large speculator standing this week resulted in a net position of -69,330 contracts in the data reported through Tuesday. This was a weekly increase of 47,335 contracts from the previous week which had a total of -116,665 net contracts.
This week’s current strength score (the trader positioning range over the past three years, measured from 0 to 100) shows the speculators are currently Bullish with a score of 51.4 percent. The commercials are Bearish with a score of 48.7 percent and the small traders (not shown in chart) are Bullish with a score of 53.4 percent.
Price Trend-Following Model: Uptrend
Our weekly trend-following model classifies the current market price position as: Uptrend.
| SOFR 1-Month Statistics | SPECULATORS | COMMERCIALS | SMALL TRADERS |
| – Percent of Open Interest Longs: | 18.8 | 67.6 | 0.0 |
| – Percent of Open Interest Shorts: | 24.2 | 62.1 | 0.0 |
| – Net Position: | -69,330 | 69,643 | -313 |
| – Gross Longs: | 238,301 | 858,711 | 131 |
| – Gross Shorts: | 307,631 | 789,068 | 444 |
| – Long to Short Ratio: | 0.8 to 1 | 1.1 to 1 | 0.3 to 1 |
| NET POSITION TREND: | |||
| – Strength Index Score (3 Year Range Pct): | 51.4 | 48.7 | 53.4 |
| – Strength Index Reading (3 Year Range): | Bullish | Bearish | Bullish |
| NET POSITION MOVEMENT INDEX: | |||
| – 6-Week Change in Strength Index: | 51.4 | -51.3 | 2.5 |
2-Year Treasury Note Futures:
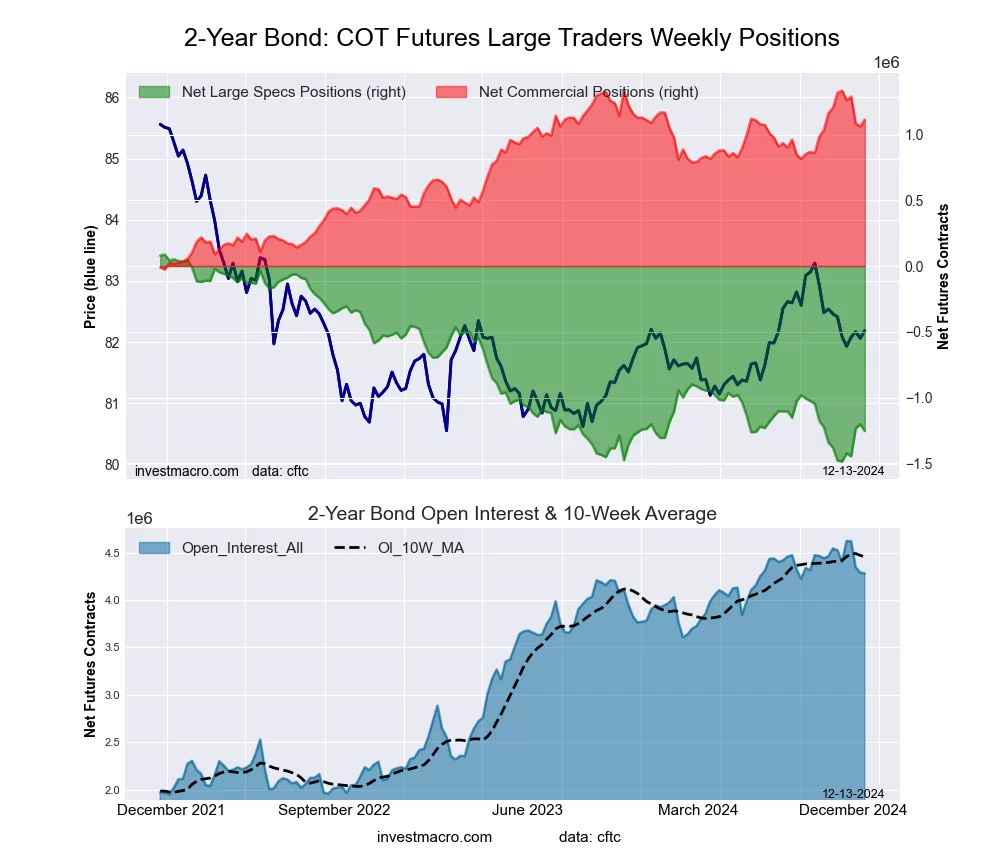 The 2-Year Treasury Note large speculator standing this week resulted in a net position of -1,254,924 contracts in the data reported through Tuesday. This was a weekly lowering of -52,025 contracts from the previous week which had a total of -1,202,899 net contracts.
This week’s current strength score (the trader positioning range over the past three years, measured from 0 to 100) shows the speculators are currently Bearish-Extreme with a score of 14.7 percent. The commercials are Bullish-Extreme with a score of 83.8 percent and the small traders (not shown in chart) are Bullish-Extreme with a score of 80.7 percent.
Price Trend-Following Model: Strong Downtrend
Our weekly trend-following model classifies the current market price position as: Strong Downtrend.
| 2-Year Treasury Note Statistics | SPECULATORS | COMMERCIALS | SMALL TRADERS |
| – Percent of Open Interest Longs: | 11.3 | 78.2 | 6.1 |
| – Percent of Open Interest Shorts: | 40.6 | 52.2 | 2.8 |
| – Net Position: | -1,254,924 | 1,113,690 | 141,234 |
| – Gross Longs: | 481,986 | 3,348,411 | 260,916 |
| – Gross Shorts: | 1,736,910 | 2,234,721 | 119,682 |
| – Long to Short Ratio: | 0.3 to 1 | 1.5 to 1 | 2.2 to 1 |
| NET POSITION TREND: | |||
| – Strength Index Score (3 Year Range Pct): | 14.7 | 83.8 | 80.7 |
| – Strength Index Reading (3 Year Range): | Bearish-Extreme | Bullish-Extreme | Bullish-Extreme |
| NET POSITION MOVEMENT INDEX: | |||
| – 6-Week Change in Strength Index: | 14.3 | -15.0 | -6.2 |
5-Year Treasury Note Futures:
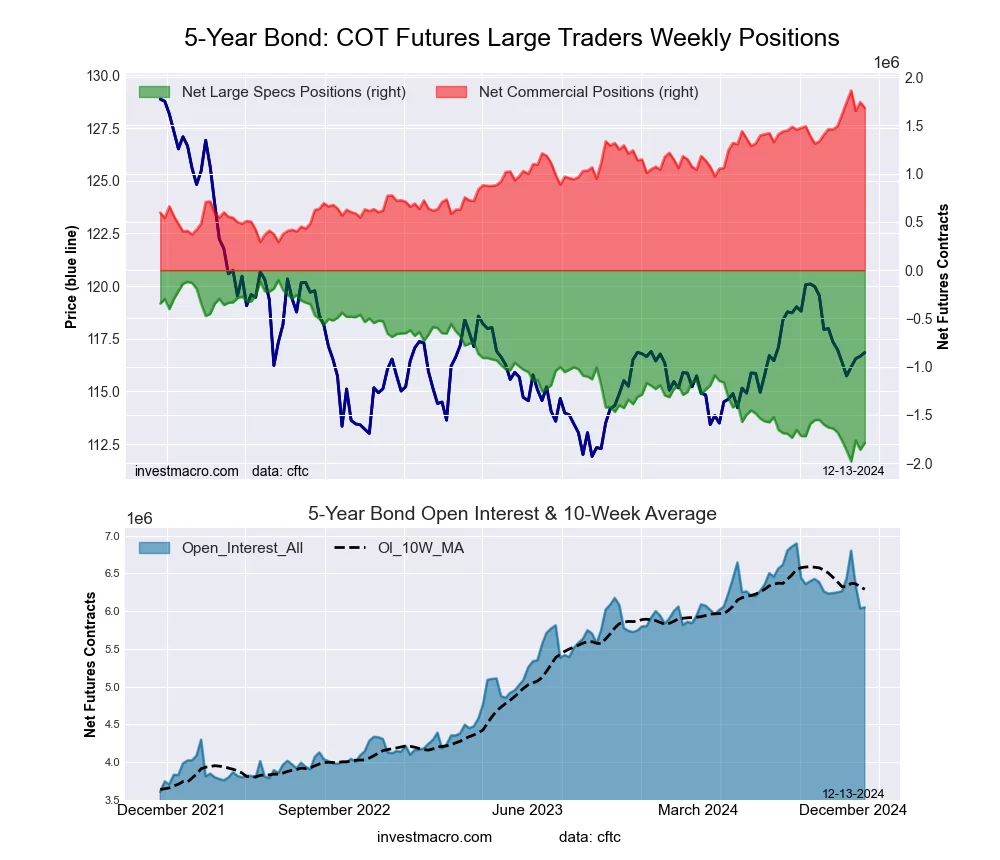 The 5-Year Treasury Note large speculator standing this week resulted in a net position of -1,790,430 contracts in the data reported through Tuesday. This was a weekly advance of 70,670 contracts from the previous week which had a total of -1,861,100 net contracts.
This week’s current strength score (the trader positioning range over the past three years, measured from 0 to 100) shows the speculators are currently Bearish-Extreme with a score of 10.3 percent. The commercials are Bullish-Extreme with a score of 88.6 percent and the small traders (not shown in chart) are Bullish with a score of 73.5 percent.
Price Trend-Following Model: Strong Downtrend
Our weekly trend-following model classifies the current market price position as: Strong Downtrend.
| 5-Year Treasury Note Statistics | SPECULATORS | COMMERCIALS | SMALL TRADERS |
| – Percent of Open Interest Longs: | 6.9 | 85.1 | 6.8 |
| – Percent of Open Interest Shorts: | 36.5 | 57.3 | 5.0 |
| – Net Position: | -1,790,430 | 1,682,114 | 108,316 |
| – Gross Longs: | 419,439 | 5,145,585 | 408,423 |
| – Gross Shorts: | 2,209,869 | 3,463,471 | 300,107 |
| – Long to Short Ratio: | 0.2 to 1 | 1.5 to 1 | 1.4 to 1 |
| NET POSITION TREND: | |||
| – Strength Index Score (3 Year Range Pct): | 10.3 | 88.6 | 73.5 |
| – Strength Index Reading (3 Year Range): | Bearish-Extreme | Bullish-Extreme | Bullish |
| NET POSITION MOVEMENT INDEX: | |||
| – 6-Week Change in Strength Index: | -5.9 | 12.0 | -14.6 |
10-Year Treasury Note Futures:
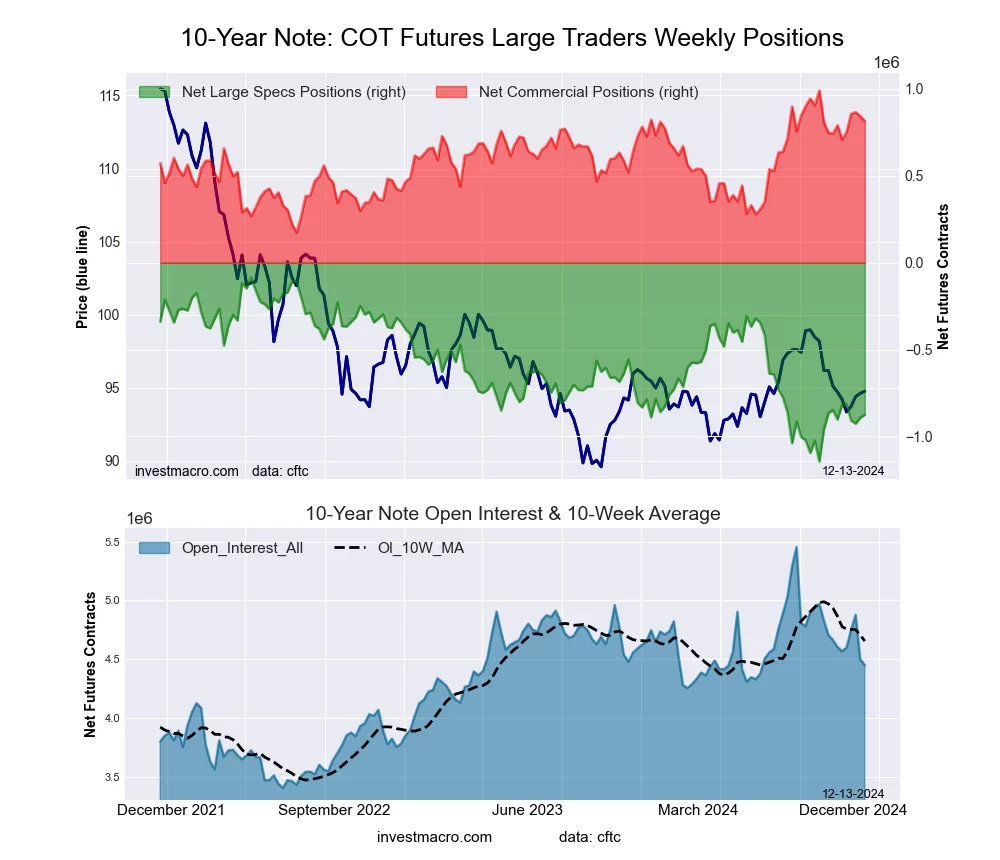 The 10-Year Treasury Note large speculator standing this week resulted in a net position of -875,716 contracts in the data reported through Tuesday. This was a weekly lift of 16,185 contracts from the previous week which had a total of -891,901 net contracts.
This week’s current strength score (the trader positioning range over the past three years, measured from 0 to 100) shows the speculators are currently Bearish with a score of 25.3 percent. The commercials are Bullish with a score of 78.6 percent and the small traders (not shown in chart) are Bullish with a score of 77.9 percent.
Price Trend-Following Model: Strong Downtrend
Our weekly trend-following model classifies the current market price position as: Strong Downtrend.
| 10-Year Treasury Note Statistics | SPECULATORS | COMMERCIALS | SMALL TRADERS |
| – Percent of Open Interest Longs: | 9.9 | 79.1 | 9.4 |
| – Percent of Open Interest Shorts: | 29.6 | 60.7 | 8.0 |
| – Net Position: | -875,716 | 815,384 | 60,332 |
| – Gross Longs: | 438,538 | 3,516,621 | 416,813 |
| – Gross Shorts: | 1,314,254 | 2,701,237 | 356,481 |
| – Long to Short Ratio: | 0.3 to 1 | 1.3 to 1 | 1.2 to 1 |
| NET POSITION TREND: | |||
| – Strength Index Score (3 Year Range Pct): | 25.3 | 78.6 | 77.9 |
| – Strength Index Reading (3 Year Range): | Bearish | Bullish | Bullish |
| NET POSITION MOVEMENT INDEX: | |||
| – 6-Week Change in Strength Index: | 2.4 | 3.1 | -11.3 |
Ultra 10-Year Notes Futures:
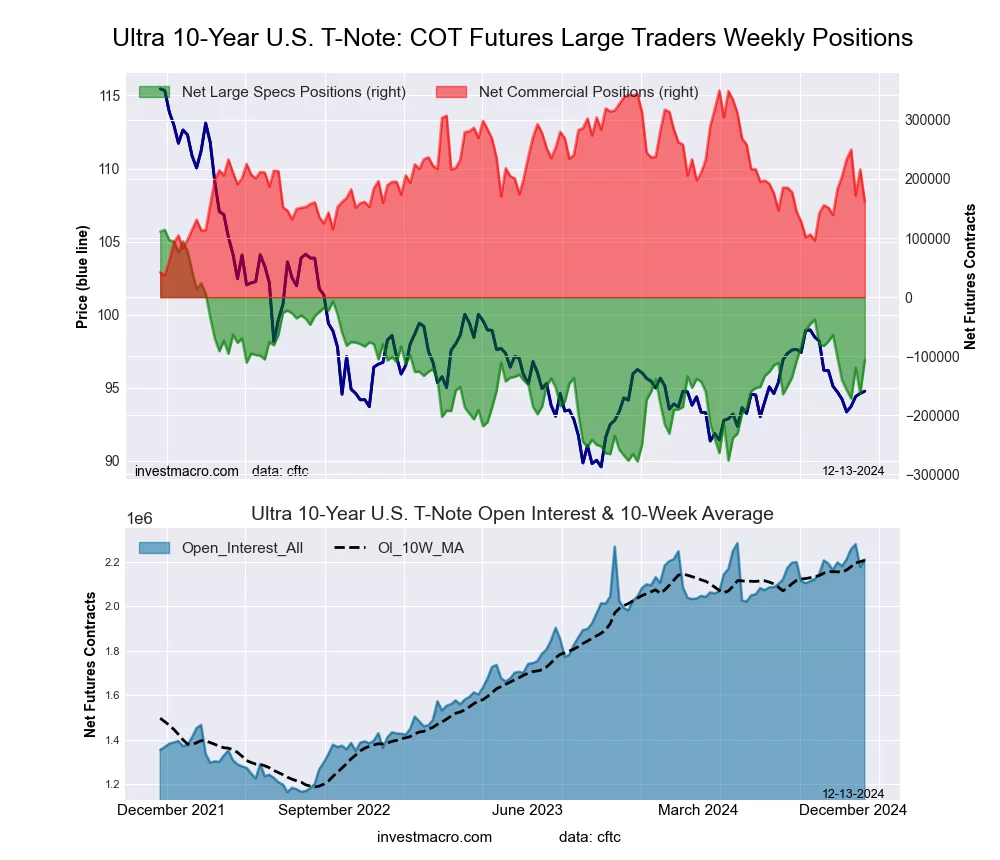 The Ultra 10-Year Notes large speculator standing this week resulted in a net position of -106,082 contracts in the data reported through Tuesday. This was a weekly advance of 57,215 contracts from the previous week which had a total of -163,297 net contracts.
This week’s current strength score (the trader positioning range over the past three years, measured from 0 to 100) shows the speculators are currently Bearish with a score of 43.9 percent. The commercials are Bearish with a score of 39.8 percent and the small traders (not shown in chart) are Bullish with a score of 79.2 percent.
Price Trend-Following Model: Weak Uptrend
Our weekly trend-following model classifies the current market price position as: Weak Uptrend. The current action for the model is considered to be: Hold – Maintain Long Position.
| Ultra 10-Year Notes Statistics | SPECULATORS | COMMERCIALS | SMALL TRADERS |
| – Percent of Open Interest Longs: | 15.7 | 73.3 | 10.1 |
| – Percent of Open Interest Shorts: | 20.5 | 66.0 | 12.6 |
| – Net Position: | -106,082 | 161,350 | -55,268 |
| – Gross Longs: | 346,401 | 1,620,031 | 223,359 |
| – Gross Shorts: | 452,483 | 1,458,681 | 278,627 |
| – Long to Short Ratio: | 0.8 to 1 | 1.1 to 1 | 0.8 to 1 |
| NET POSITION TREND: | |||
| – Strength Index Score (3 Year Range Pct): | 43.9 | 39.8 | 79.2 |
| – Strength Index Reading (3 Year Range): | Bearish | Bearish | Bullish |
| NET POSITION MOVEMENT INDEX: | |||
| – 6-Week Change in Strength Index: | -0.8 | -7.0 | 15.0 |
US Treasury Bonds Futures:
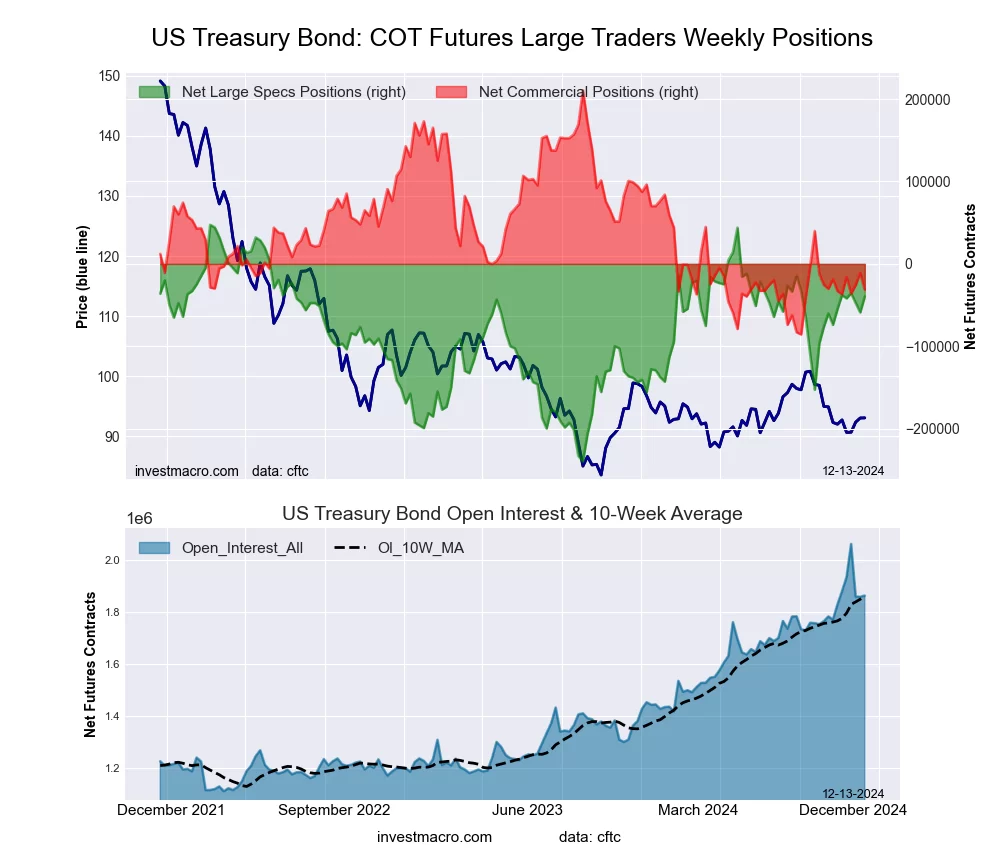 The US Treasury Bonds large speculator standing this week resulted in a net position of -39,493 contracts in the data reported through Tuesday. This was a weekly gain of 19,282 contracts from the previous week which had a total of -58,775 net contracts.
This week’s current strength score (the trader positioning range over the past three years, measured from 0 to 100) shows the speculators are currently Bullish with a score of 69.7 percent. The commercials are Bearish-Extreme with a score of 18.3 percent and the small traders (not shown in chart) are Bullish with a score of 67.6 percent.
Price Trend-Following Model: Strong Downtrend
Our weekly trend-following model classifies the current market price position as: Strong Downtrend.
| US Treasury Bonds Statistics | SPECULATORS | COMMERCIALS | SMALL TRADERS |
| – Percent of Open Interest Longs: | 22.1 | 65.6 | 10.9 |
| – Percent of Open Interest Shorts: | 24.2 | 67.3 | 7.1 |
| – Net Position: | -39,493 | -31,489 | 70,982 |
| – Gross Longs: | 410,909 | 1,221,804 | 203,350 |
| – Gross Shorts: | 450,402 | 1,253,293 | 132,368 |
| – Long to Short Ratio: | 0.9 to 1 | 1.0 to 1 | 1.5 to 1 |
| NET POSITION TREND: | |||
| – Strength Index Score (3 Year Range Pct): | 69.7 | 18.3 | 67.6 |
| – Strength Index Reading (3 Year Range): | Bullish | Bearish-Extreme | Bullish |
| NET POSITION MOVEMENT INDEX: | |||
| – 6-Week Change in Strength Index: | 5.3 | 0.5 | -11.5 |
Ultra US Treasury Bonds Futures:
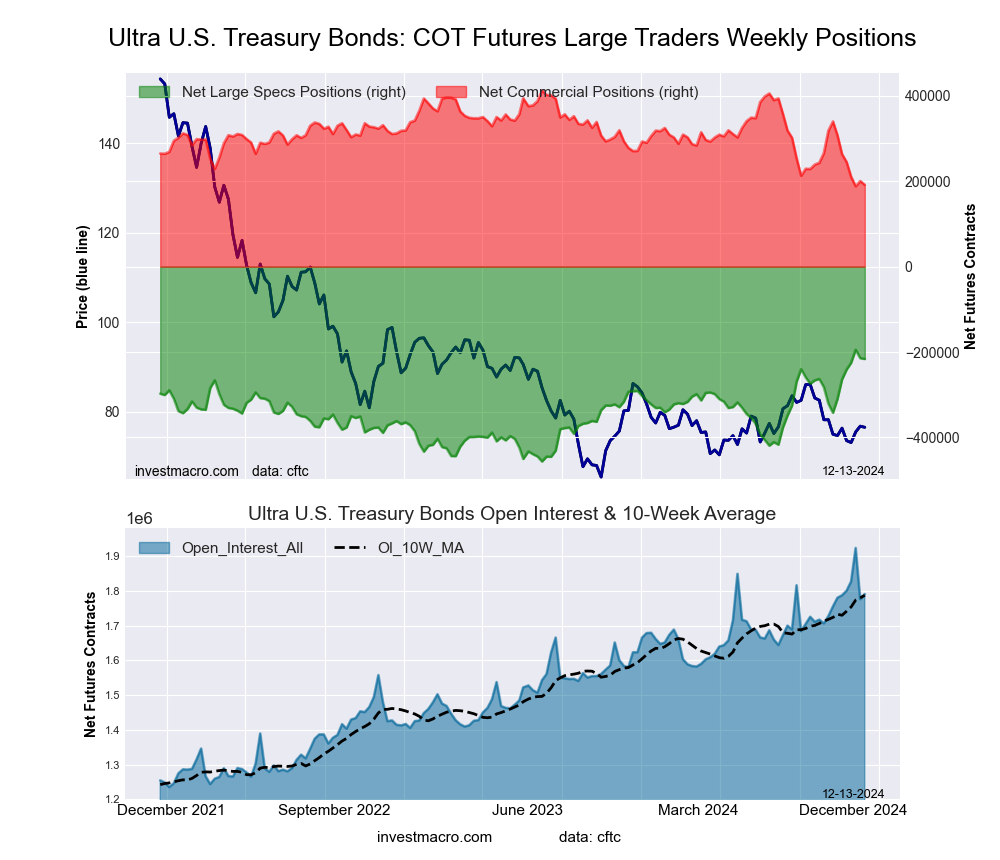 The Ultra US Treasury Bonds large speculator standing this week resulted in a net position of -216,372 contracts in the data reported through Tuesday. This was a weekly decline of -2,020 contracts from the previous week which had a total of -214,352 net contracts.
This week’s current strength score (the trader positioning range over the past three years, measured from 0 to 100) shows the speculators are currently Bullish-Extreme with a score of 91.7 percent. The commercials are Bearish-Extreme with a score of 1.5 percent and the small traders (not shown in chart) are Bearish with a score of 40.7 percent.
Price Trend-Following Model: Strong Downtrend
Our weekly trend-following model classifies the current market price position as: Strong Downtrend.
| Ultra US Treasury Bonds Statistics | SPECULATORS | COMMERCIALS | SMALL TRADERS |
| – Percent of Open Interest Longs: | 8.1 | 80.1 | 10.1 |
| – Percent of Open Interest Shorts: | 20.1 | 69.4 | 8.7 |
| – Net Position: | -216,372 | 191,705 | 24,667 |
| – Gross Longs: | 144,422 | 1,433,739 | 180,858 |
| – Gross Shorts: | 360,794 | 1,242,034 | 156,191 |
| – Long to Short Ratio: | 0.4 to 1 | 1.2 to 1 | 1.2 to 1 |
| NET POSITION TREND: | |||
| – Strength Index Score (3 Year Range Pct): | 91.7 | 1.5 | 40.7 |
| – Strength Index Reading (3 Year Range): | Bullish-Extreme | Bearish-Extreme | Bearish |
| NET POSITION MOVEMENT INDEX: | |||
| – 6-Week Change in Strength Index: | 35.8 | -51.7 | 31.6 |
Article By InvestMacro – Receive our weekly COT Newsletter
*COT Report: The COT data, released weekly to the public each Friday, is updated through the most recent Tuesday (data is 3 days old) and shows a quick view of how large speculators or non-commercials (for-profit traders) were positioned in the futures markets.
The CFTC categorizes trader positions according to commercial hedgers (traders who use futures contracts for hedging as part of the business), non-commercials (large traders who speculate to realize trading profits) and nonreportable traders (usually small traders/speculators) as well as their open interest (contracts open in the market at time of reporting). See CFTC criteria here.