
By RoboForex Analytical Department
The Australian dollar remains under significant pressure, with AUD/USD extending its downtrend mid-week to reach 0.6539, the lowest since August. The decline, which began on 1 October, has been relentless, with the pair experiencing little to no respite from its downward trajectory.
Recent data indicating that Australia’s annual inflation cooled to 2.8% in Q3 from 3.8% in Q2, falling just below the expected 2.9%, has contributed to the accelerated sell-off. Although this brings inflation within the Reserve Bank of Australia’s (RBA) target range of 2-3%, the core inflation gauge closely monitored by the RBA remains elevated at 3.5% year-on-year in Q3. Given the persistent core inflation, the RBA has no immediate impetus to lower interest rates.
The central bank maintains that inflation needs to stabilise before considering monetary easing. With the RBA’s next meeting scheduled for next week, market consensus does not anticipate a change in the current interest rate of 4.35% per annum. Rate cuts are not expected until at least May 2025.
Technical analysis of AUD/USD
Free Reports:
 Download Our Metatrader 4 Indicators – Put Our Free MetaTrader 4 Custom Indicators on your charts when you join our Weekly Newsletter
 Get our Weekly Commitment of Traders Reports - See where the biggest traders (Hedge Funds and Commercial Hedgers) are positioned in the futures markets on a weekly basis.
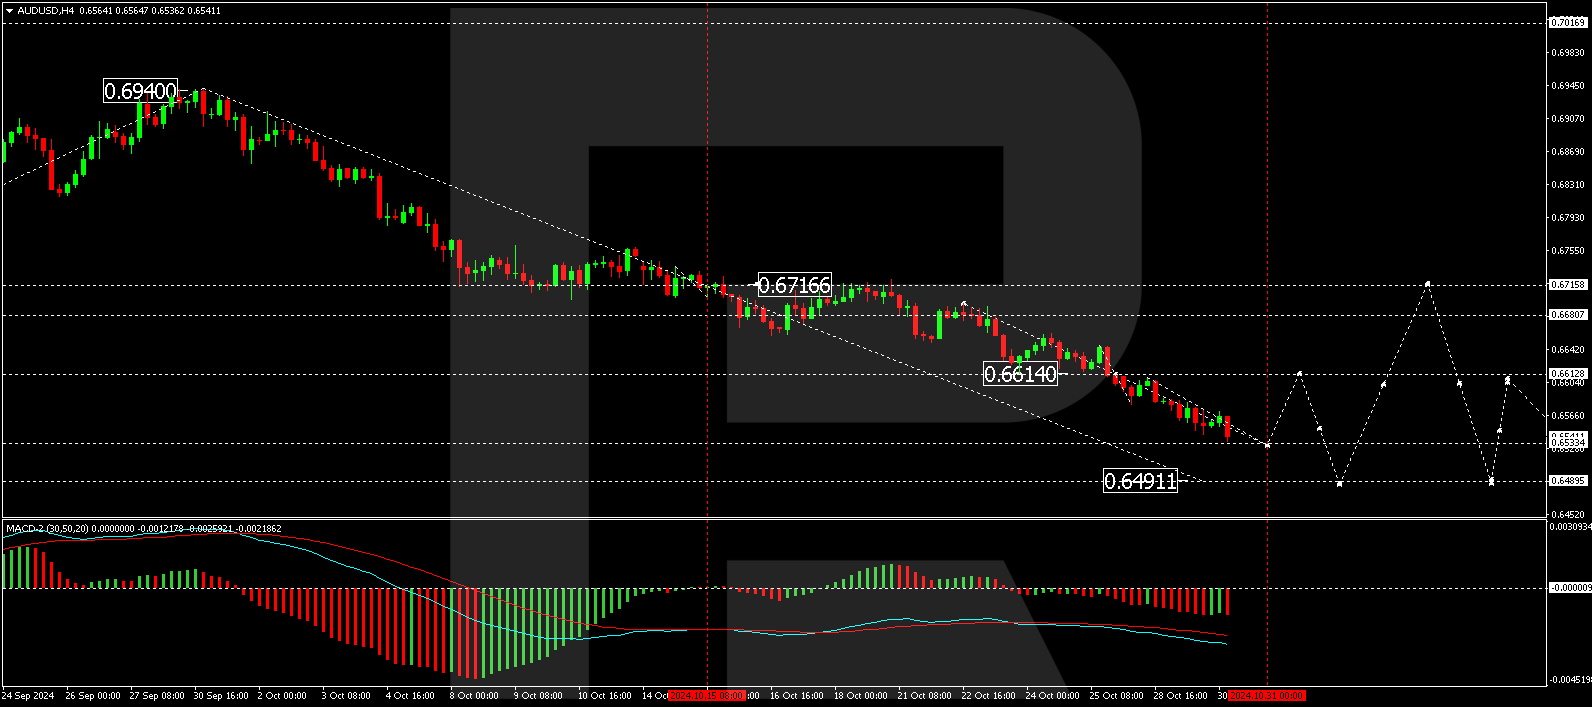
The AUD/USD is persisting in its downward wave, targeting 0.6533. If this level is reached, a corrective phase towards 0.6613 may follow, and the downward trend is expected to resume towards 0.6491. The MACD indicator supports this bearish outlook, as its signal line is well below zero, indicating a continuation of the downward momentum.
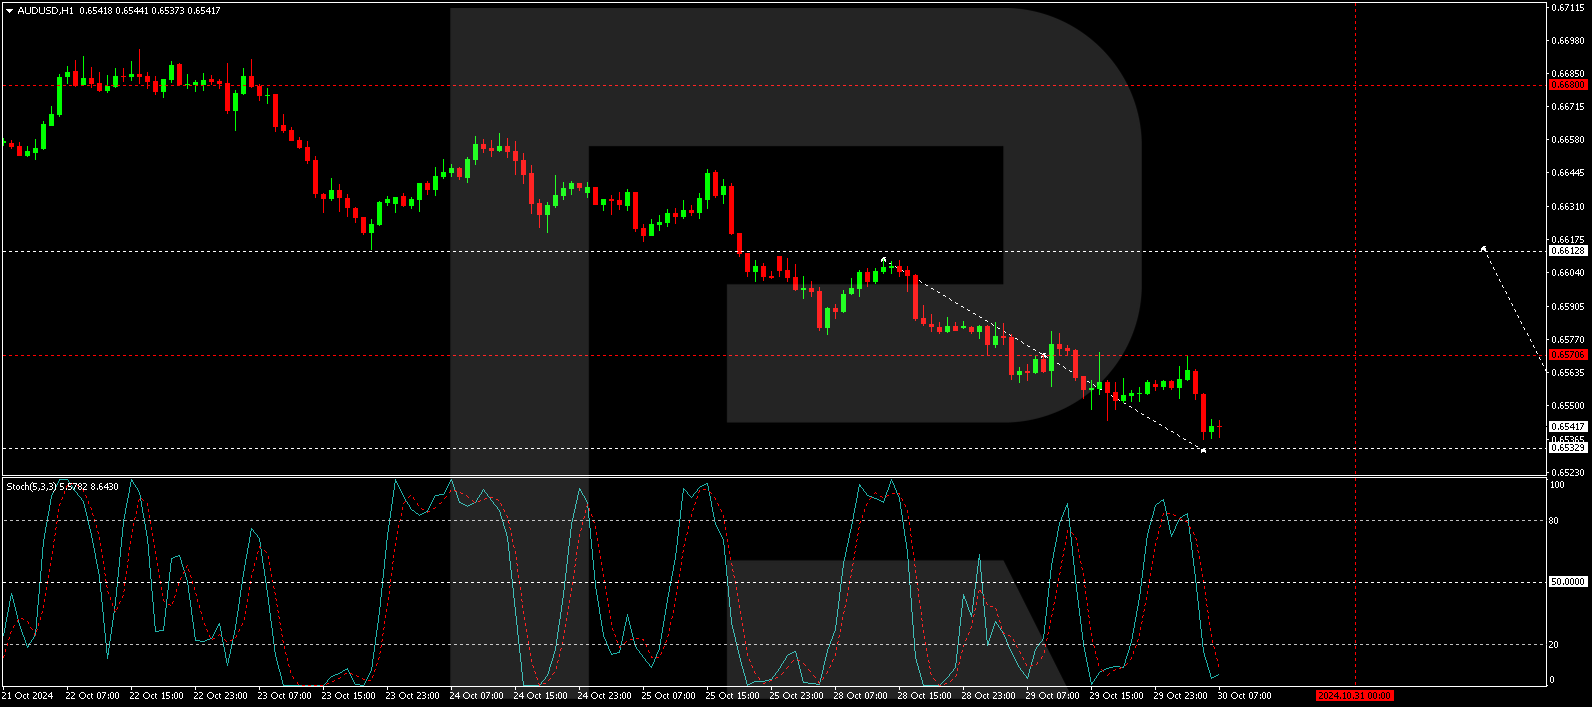
On the hourly chart, AUD/USD has established a consolidation range around 0.6570, breaking downwards to continue towards 0.6533. Once this level is achieved, a corrective move to 0.6613 may begin, with an intermediate target at 0.6570. This potential upward correction is confirmed by the Stochastic oscillator, whose signal line is below 20 but poised to rise towards 80, suggesting a brief respite from the selling pressure.
Disclaimer
Any forecasts contained herein are based on the author’s particular opinion. This analysis may not be treated as trading advice. RoboForex bears no responsibility for trading results based on trading recommendations and reviews contained herein.

- Oil prices jumped 4% amid a new wave of escalation between the US and Iran Jul 14, 2026
- USD/JPY Holds at Highs: Pressure Lingers on Yen Jul 14, 2026
- Oil prices jumped 4% amid a new wave of escalation between the US and Iran Jul 13, 2026
- EUR/USD: US Inflation Will Determine Everything Jul 13, 2026
- COT Metals Charts: Weekly Speculator Bets see small gains for Silver & Gold Jul 12, 2026
- COT Bonds Charts: Speculator Bets led by SOFR 3-Months & 2-Year Bonds Jul 12, 2026
- COT Energy Charts: Weekly Speculator Changes led by Brent Oil Jul 12, 2026
- COT Soft Commodities Charts: Weekly Speculator Changes led by Sugar, Corn & Soybeans Jul 12, 2026
- The US and European stock indices are rising again amid renewed investor interest in the AI industry. Jul 10, 2026
- USD/JPY Falls as Yen Recovers Weekly Losses Jul 10, 2026