
Source: Michael Ballanger (6/12/23)
Michael Ballanger of GGM Advisory Inc. shares his opinion on the current state of the gold market as the U.S. federal debt rises.
Schizophrenia: “the abnormal interpretation of reality.”
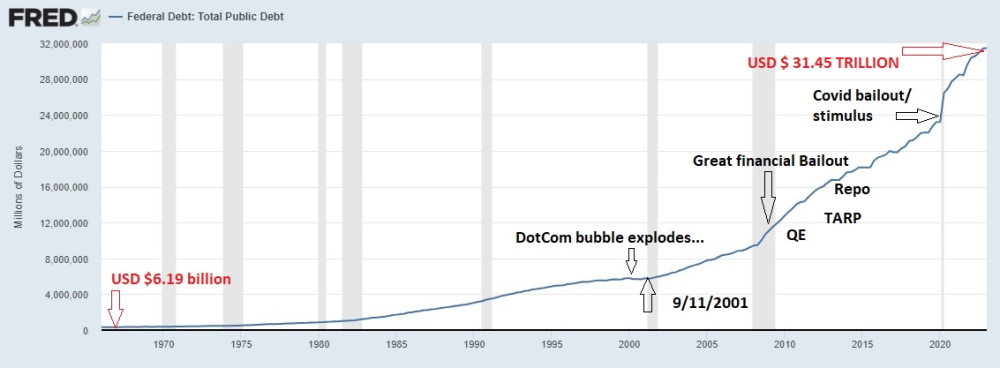
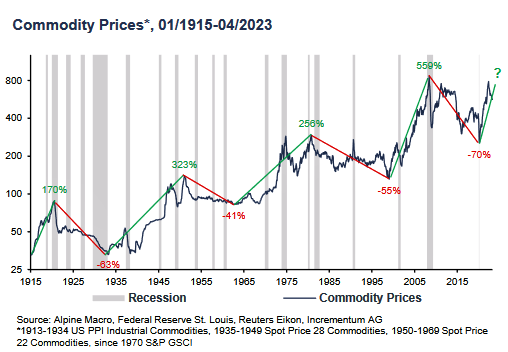
If this was June of 2003, and I were to tell you that in the next twenty years, U.S. Federal debt would rise from US$6.19 billion to US$31.35 trillion, you would probably assume that gold would be somewhat higher.
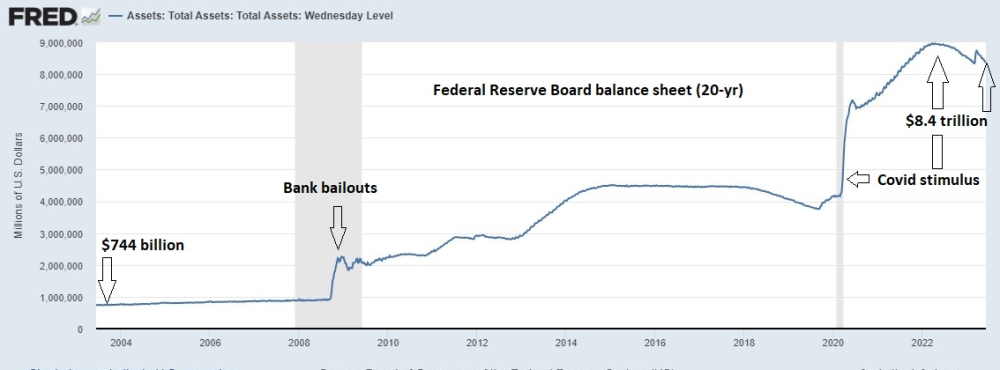
If this were June 2003, and I were to tell you that the Federal Reserve Board would manufacture a balance sheet explosion from US$744 billion to US$8.4 trillion, you would be correct in assuming that the prices for gold and silver would be substantially higher than US$1,981 per ounce.
In June of 2003, the price of gold was around US$350/ounce, still approximately US$500/ounce below the 1980 peak but just beginning an uptrend that would take it to the current price of US$1,980/ounce, representing a 566% increase over the twenty year period of fiscal and monetary insanity.
However, the national debt has increased by 4,715% while the Fed balance sheet has increased by 1,144% within the same time period.
Now, nowhere in the cards is it written that the U.S. national debt should be positively correlated with the price of gold, nor can the same assumption be made for the Fed balance sheet.
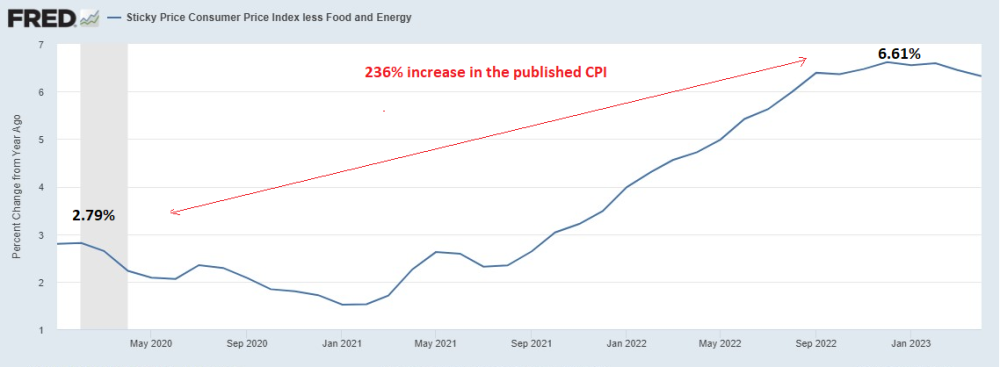
In fact, outside of the 1970s, there has been no time in recent history that gold was positively correlated to the published rate of inflation, and no better example exists than the period of 2020 to 2023 when inflation rates rose 236% while at the same time, gold rose a paltry 29.6 % despite massive central bank accumulation.
If I told you in June of 2003 that within twenty years, there would be two banking crises, a global economic shutdown due to a viral outbreak, and an invasion of Ukraine by Russia, you would certainly put the price of gold at a minimum of tenfold its price at the time as US$3,500/ounce would still be ridiculously low relative to the price increases in food, medicine, real estate, and other notable items.
I propose that gold, were it a human, suffers from a severe case of schizophrenia where its pricing structure is an “abnormal interpretation of reality.”
In the case of gold, it separates itself from all other assets in that it cannot be stored electronically, and it has no other counterparty laying claim to it. Also, given its historic role as a store of value, a protector of sorts against monetary and fiscal shenanigans that serve to cheapen the value of our savings which in turn are the reward for our labor, how is it that prices for everything that humans consume can experience astronomical increases in price while the 5,000-year-old haven does not follow suit?
Gold bullion is the kryptonite of the central bank “Supermen” that use money to control the citizenry. As Mayer Anselm Rothschild said back in 1790, “Permit me to issue and control the money of a nation, and I care not who makes its laws.”
Perhaps this explains the perversity of gold’s inability to interpret reality “normally” as it languishes in mediocrity.
Gold at Critical Crossroads
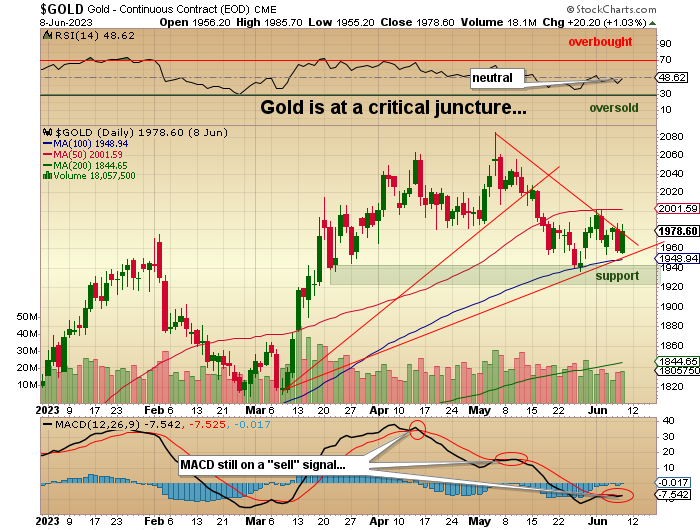
Here in June of 2023, gold appears to be at critical crossroads. I have been a gold bull for most of the post-Millennium period, having fully expected the arrival of a debt crisis as the catalyst for a re-pricing of the only asset that serves as collateral currently for central banks the world over. It is collateral that remains pitifully underpriced relative to the mountains of debt, the bulk of which has been issued in the past fifteen years (since the 2008 GFC).
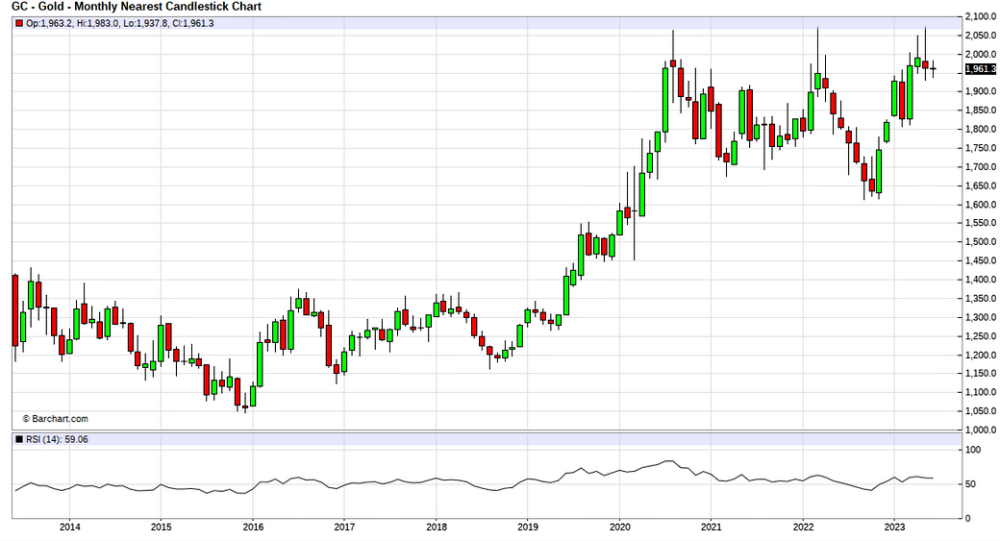
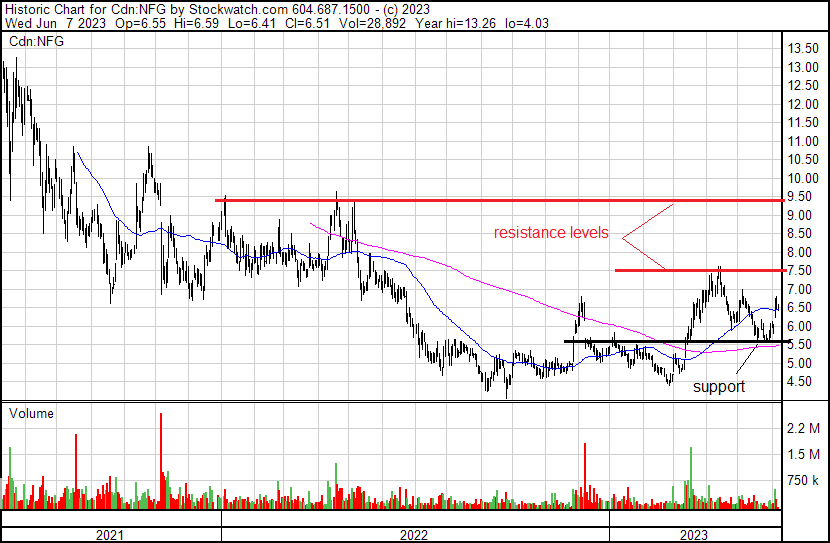
However, on a near-term basis, the U.S. dollar-denominated price of gold is a matter of National Security for those that recognize the downside risk to the end of dollar hegemony. With that in mind, one must factor in the interventions when one is trading gold so as the chart shown above would dictate, there have been two major runs at the old highs at US$2,089 in 2023, and both times they were soundly repelled.
It now looks as though it is a fruitless to attempt to “call” the breakout to new highs in gold. I am therefore standing aside until the forces of true price discovery are able to overcome the interventionalists and take it through and above US$2,100/ounce with certainty.
Not even the second and third largest bank failures in U.S. history — First Republic and Silicon Valley — were enough to vault gold to new highs, and this I find staggeringly bizarre.
Nevertheless, gold sits at US$1,981 basis August and needs to reclaim the mighty US$2,000/ounce level in order to repair the damage wrought by the recent bombing to US$1,939.
I fully expected that gold would see new highs in the first half of 2023, and thus far, I have once again been vanquished by legions of NY Fed desk traders, programmed algobots operating on platforms designed by the dollar protectors, and the always dependable bullion banks that continue to spoof their way to insane trading enrichment, setting aside a sinking fund of realized profits for future and totally anticipated fines from the Justice Department and the SEC.
From the trader’s perspective, it now looks as though it is a fruitless and completely maddening exercise to attempt to “call” the breakout to new highs in gold. I am therefore standing aside until the forces of true price discovery are able to overcome the interventionalists and take it through and above US$2,100/ounce with certainty. Until then, the chop-chop one hears is the sound of the bulls’ P&Ls being decimated by bullion bank artistry at which they are supremely adept.
AI
There have been only two times in my long life that I have attempted to short a technology bubble, and both times I had my head handed to me on a platter, but not before ample servings of crow were stuffed down my throat by snot-nosed kiddies “riding the wave.”
The first time was in late 1999 when I decided that America Online was overvalued; I got sledgehammered in the put options abattoir. The second time was in 2019 when I thought the idea of an electric car running on two-hour power intervals was ridiculously overrated, so I bought a whack load of Tesla puts as it was rising, only to watch it continue to rise right on up until Feb/2020 when the rumor of a pandemic coming out of China sent it reeling lower.
Alas, by then, the Tesla put options were sawdust resting on the floor of broken dreams as the Tesla-vites and their Millennial know-it-alls wagged their fingers disdainfully, trying their best to hold back shrieks of laughter at “that old guy that doesn’t get it.”
Vancouver promoters are once again mobilizing their marketing armies to “get the word out” that Foofoo Mining Corp. is now “FULLY ENGAGES IN ARTIFICIAL INTELLIGENCE” and is working on a deal with Microsoft t find lithium and cobalt on Mars.
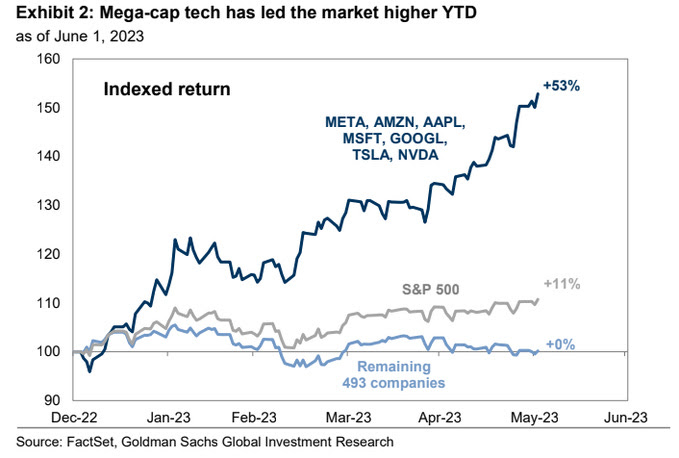
Well, that “old guy that doesn’t get it” is ignoring the arrival of sexagenarian memory loss and is going to once again take a royal run at the short side of a market driven largely by ten stocks all leading an entire exchange of “wannabe’s” to incorporate “AI” into their business models.
In the past month, dozens of junior mining companies, many of which switched from silver to lithium in 2022, have now told the world that they are using AI to find lithium AND silver, and furthermore, they are using it to provide life insurance for dachshunds in case they need hip replacements in their later years.
The predictability of this migration to AI is reminiscent of the one that took place in 2018 when all the junior mining explorco’s sitting at five cents with twenty bucks in working capital ( but a really “cool” website) all made the switch to “crypto” in order to catch the wave of Millennial Madness sweeping across the international trading floors.
Vancouver promoters are once again mobilizing their marketing armies to “get the word out” that Foofoo Mining Corp. is now “FULLY ENGAGES IN ARTIFICIAL INTELLIGENCE” and is working on a deal with Microsoft t find lithium and cobalt on Mars.
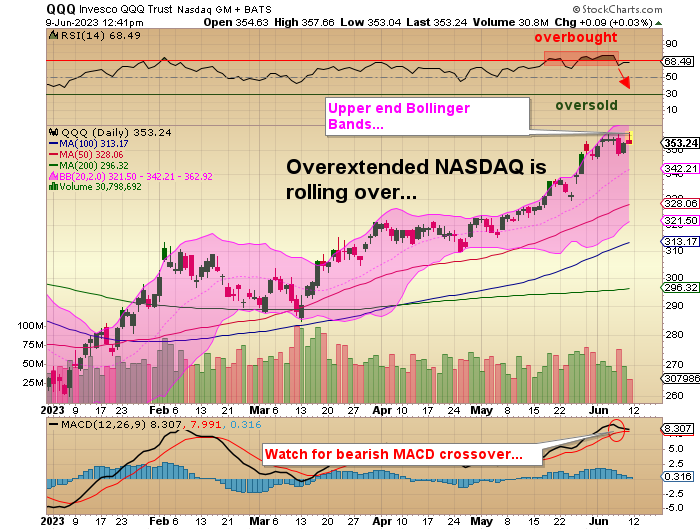
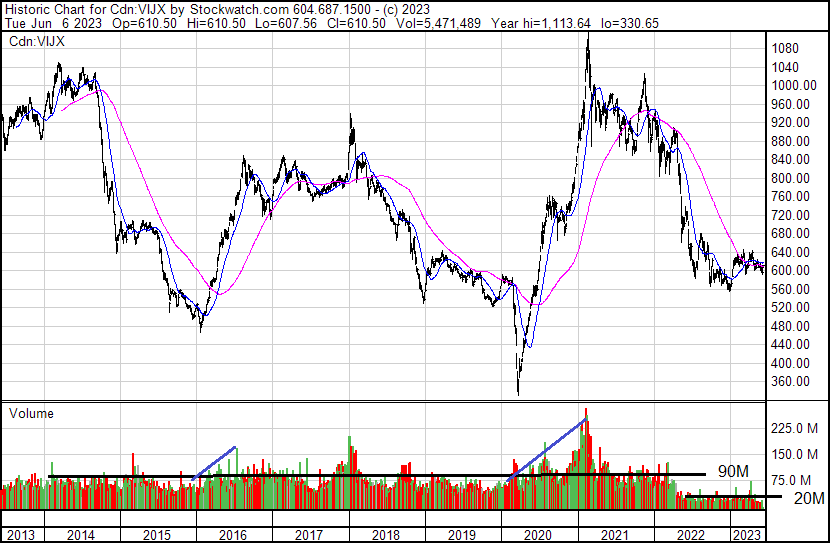
The QQQ’s are the ETF created to capture the NASDAQ magic in one very potent bottle, and as you can see, it is an ETF that is up 33.39% YTD coming off a three-week period in “overbought” status where the RSI got up into the low 80’s before heading south.
The MACD indicator is dangerously close to a full bearish crossover that, when combined with prices now stretched to the top of the Bollinger Bands, gives me a very warm and fuzzy feeling that a NASDAQ correction might be very close.
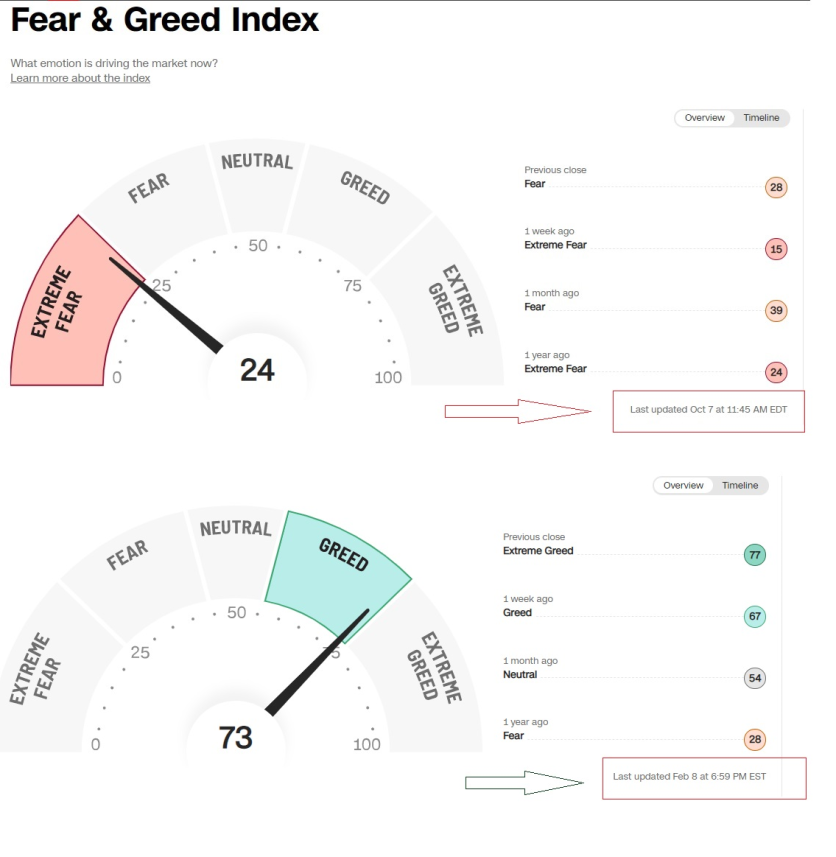
The CNN Fear-Greed Index, which was flashing “Extreme Fear” last October, has for the first time reached the “Extreme Greed” zone largely fueled by NASDAQ exuberance, much of which is irrational.
I fully recognize that I could be “early,” which translates into “I could be wrong,” which means that I will be three-for-three in failed attempts to second-guess the tech market, and the only thing worse than achieving this “Trifecta” of trading incompetence is the wagging of Millennial fingers in my wizened face.
Fingers crossed and rabbit’s feet engaged. . .
Junior Miners
If there is one sector that has become the poster child for a generation of Babyboomers, it is the junior resource space. I was talking to a young gentleman in his late twenties that has been in investment banking since he successfully passed his CFA designation five years ago after graduating summa cum laude (“with great distinction”) from a prestigious American university.
The conversation shifted from “central bank pivoting” to the junior resource space, and I was astonished to learn that the number of funds that specialize in junior resource companies has declined something like 75% in the last fifteen years.
Conversely, the pool of capital that was once the playground of adventurous youth has dwindled away as the number of “Special Situations/Technology” funds has increased tenfold over the same period. The kiddies are sick and tired of the old guys telling that old story about making it big in Diamondfields or Arequipa or DiaMet or even more recently, Great Bear Resources circa 2018, which seems for many like just yesterday but for this new generation of traders, five years is a lifetime.
Just as gold bullion has seen investors and traders ignore all of the inputs in the last twenty years that would and should have driven gold to US$3,500/ounce, junior miners have to be ignored despite compelling results and impressive resource growth, typically the catalysts for higher prices.
There have been some wins in the junior resource space, and while most of it was in lithium, even the hard-rock pegmatite deals are coming under pressure with the correction in the lithium price late last year. The kiddies love to tell their stories about sinking stimmy cheques into Gamestop at US$20 before riding it to US$400 per share in weeks.
They loved silver back in 2021 when a number of the high-profile silver promoters conned them into the #silversqueeze travesty, but their first foray into the metals ran into a bullion bank haymaker, and that sent the kiddies scurrying back into the darkness and have yet to return.
This young banker could talk more eloquently about lithium than most miners can, but at the end of the day, it is all about the flow of money rather than the “cost of production,” “preliminary economic analysis,” or “prefeasibility study.” If the stock is expected to go up, it must first have the blessing of a select few internet “influencers” that promote these juniors by way of podcasts or tweets, or private chatrooms. The expression “safety in numbers” is not to be confused with “misery loves company” because if there is one thing the youngsters have proven, especially to older aficionados of junior resource plays like me, it is that they can really move paper.
This thought is not a great deal removed from the title of this missive because it is the inability to interpret reality that has me staring at companies like Getchell Gold Corp. (GTCH:CSE; GGLDF:OTCQB) whose 2,059,000 ounces of gold in Nevada and 43101-compliant is valued at an incredible US$9.60 per ounce.
The sellers do not care about the “value-per-ounce,” nor do the prospective buyers because since the stock is not found on any of the “accepted websites” or featured in any of the “authorized podcasts,” it is not a stock that qualifies in the hearts and minds of the millions upon millions of Millennial and Gen-X traders that have a totally different set of investment rules.
That all changes when the underlying drivers that lead to a change in perception percolate down to the influencers who then bestow their blessings upon the deal, whatever that might be and whatever the reason. Just as gold bullion has seen investors and traders ignore all of the inputs in the last twenty years that would and should have driven gold to US$3,500/ounce, junior miners have to be ignored despite compelling results and impressive resource growth, typically the catalysts for higher prices. The juniors will change when it becomes commonplace for the kiddies to actually make money trading them, which means visibility and volumes have to increase.
No more grey-haired old men giving out key chains and calendars for business cards and referral leads as in a chapter of the classic Glengarry Glen Ross, a must-watch for the aspiring stock promoter in any era. . .
Important Disclosures:
- As of the date of this article, officers and/or employees of Streetwise Reports LLC (including members of their household) own securities of Getchell Gold Corp.,
- Michael Ballanger: I, or members of my immediate household or family, own securities of: Getchell Gold Corp. I determined which companies would be included in this article based on my research and understanding of the sector.
- Statements and opinions expressed are the opinions of the author and not of Streetwise Reports or its officers. The author is wholly responsible for the validity of the statements. The author was not paid by Streetwise Reports for this article. Streetwise Reports was not paid by the author to publish or syndicate this article. Streetwise Reports requires contributing authors to disclose any shareholdings in, or economic relationships with, companies that they write about. Streetwise Reports relies upon the authors to accurately provide this information and Streetwise Reports has no means of verifying its accuracy.
- This article does not constitute investment advice. Each reader is encouraged to consult with his or her individual financial professional. By opening this page, each reader accepts and agrees to Streetwise Reports’ terms of use and full legal disclaimer. This article is not a solicitation for investment. Streetwise Reports does not render general or specific investment advice and the information on Streetwise Reports should not be considered a recommendation to buy or sell any security. Streetwise Reports does not endorse or recommend the business, products, services or securities of any company.
For additional disclosures, please click here.
Michael Ballanger Disclosures
This letter makes no guarantee or warranty on the accuracy or completeness of the data provided. Nothing contained herein is intended or shall be deemed to be investment advice, implied or otherwise. This letter represents my views and replicates trades that I am making but nothing more than that. Always consult your registered advisor to assist you with your investments. I accept no liability for any loss arising from the use of the data contained on this letter. Options and junior mining stocks contain a high level of risk that may result in the loss of part or all invested capital and therefore are suitable for experienced and professional investors and traders only. One should be familiar with the risks involved in junior mining and options trading and we recommend consulting a financial adviser if you feel you do not understand the risks involved.


