By InvestMacro
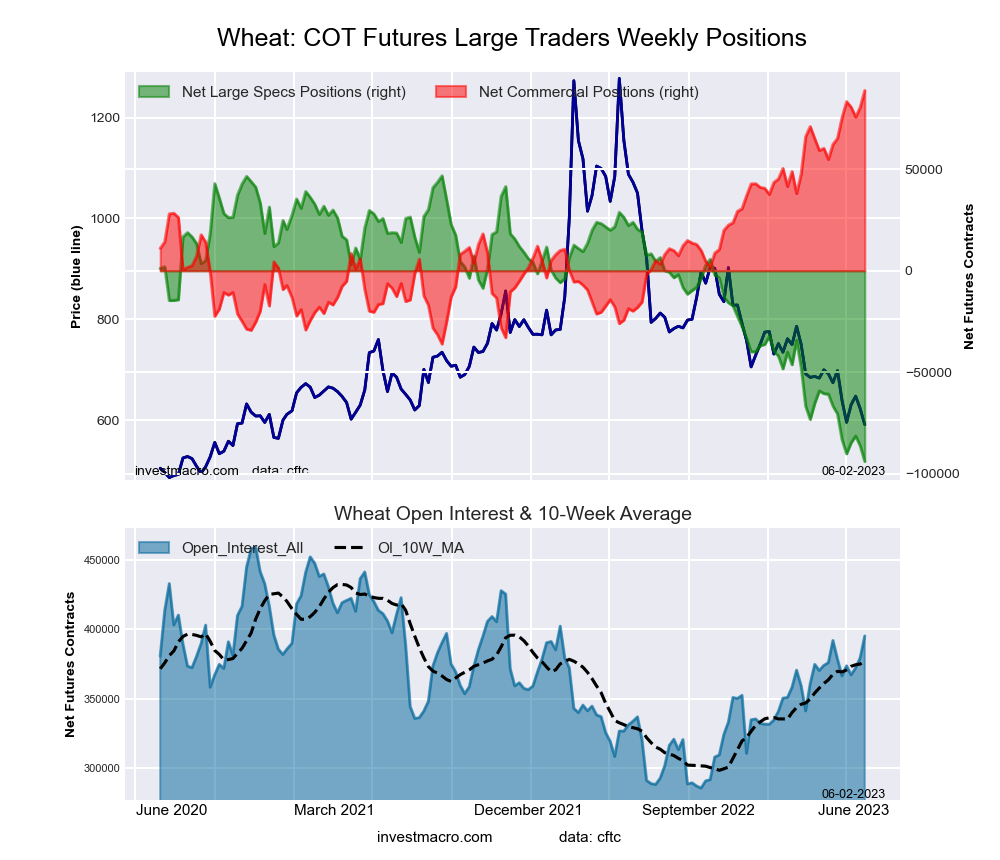
Here are the latest charts and statistics for the Commitment of Traders (COT) data published by the Commodities Futures Trading Commission (CFTC).
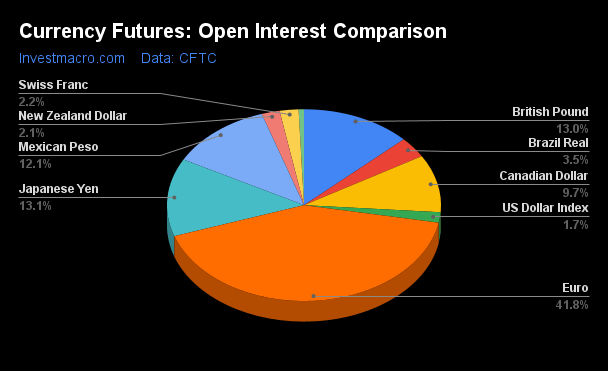
The latest COT data is updated through Tuesday May 30th and shows a quick view of how large market participants (for-profit speculators and commercial traders) were positioned in the futures markets. All currency positions are in direct relation to the US dollar where, for example, a bet for the euro is a bet that the euro will rise versus the dollar while a bet against the euro will be a bet that the euro will decline versus the dollar.
Weekly Speculator Changes led by Canadian Dollar & Australian Dollar
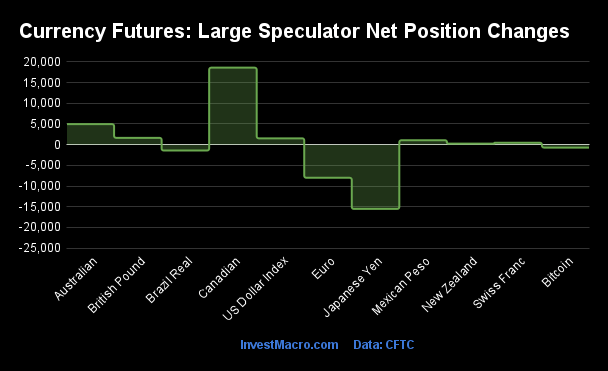
The COT currency market speculator bets were higher this week as seven out of the eleven currency markets we cover had higher positioning while the other four markets had lower speculator contracts.
Leading the gains for the currency markets was the Canadian Dollar (18,612 contracts) with the Australian Dollar (4,955 contracts), British Pound (1,646 contracts), the US Dollar Index (1,528 contracts), the New Zealand Dollar (233 contracts) and the Swiss Franc (468 contracts) also showing positive weeks.
The currencies seeing declines in speculator bets on the week were the Japanese Yen (-15,533 contracts) with the EuroFX (-8,011 contracts), the Mexican Peso (1,062 contracts), the Brazilian Real (-1,417 contracts) and Bitcoin (-706 contracts) also registering lower bets on the week.
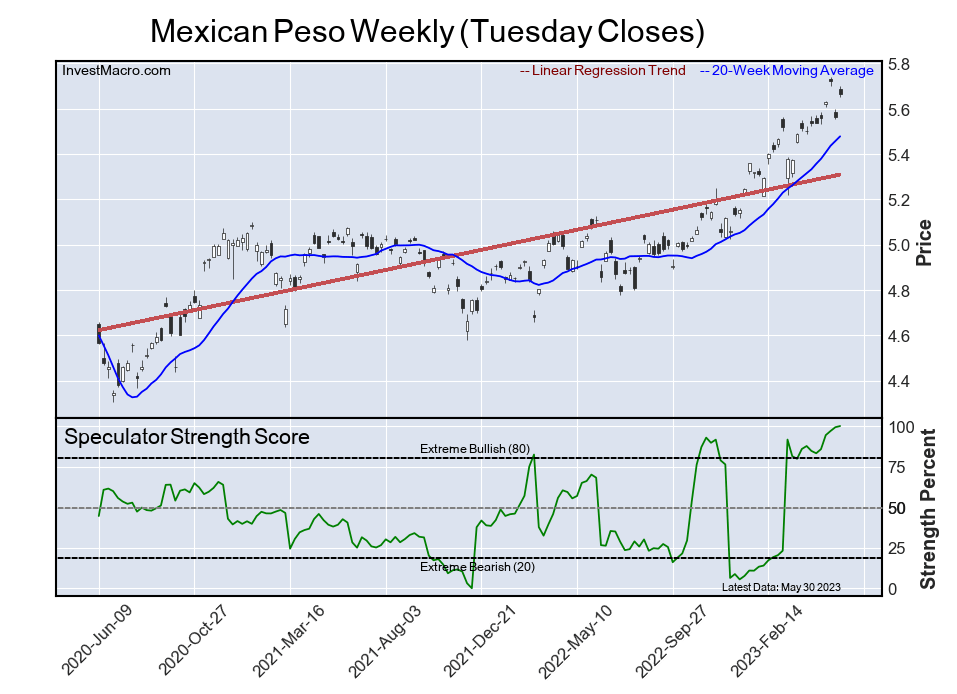
Speculators push Mexican Peso bullish bets to 168-week high
Highlighting the COT currency data this week is the continued gains for the Mexican peso positioning. Large speculators raised their bullish bets for the Mexican peso this week for the fifth straight week and for the seventh time out of the past ten weeks.
Peso bets have now improved by a total of +129,731 contracts since the beginning of 2023 (a total of 22 weeks), going from a total of -56,376 contracts on January 3rd to a total of +78,005 contracts this week. This rise in the speculator sentiment has pushed the current net position to the highest level in the past 168 weeks, dating all the way back to the height of the pandemic on March 10th of 2020.
The peso has been riding the tide of record high interest rates in Mexico that had risen to 11.25 percent level at the central bank meeting in March. However, the Mexican Central Bank, in their May meeting, held their rate steady and look to continue to do so for the time being with inflation subsiding in the latest data-points.
The Mexican peso exchange rate versus the US dollar has been surging higher this year with the MXN hitting a new 7-year high in this week’s trading. Overall, the peso is higher against the dollar in 2023 by approximately 15 percent and is trading at the best levels since 2016.
| May-30-2023 | OI | OI-Index | Spec-Net | Spec-Index | Com-Net | COM-Index | Smalls-Net | Smalls-Index |
|---|
| USD Index | 32,373 | 28 | 12,768 | 46 | -16,260 | 50 | 3,492 | 55 |
| EUR | 775,142 | 81 | 165,725 | 82 | -214,015 | 18 | 48,290 | 56 |
| GBP | 240,301 | 61 | 13,235 | 80 | -15,208 | 24 | 1,973 | 62 |
| JPY | 243,237 | 75 | -96,193 | 10 | 106,512 | 88 | -10,319 | 32 |
| CHF | 41,354 | 40 | -435 | 53 | 1,533 | 48 | -1,098 | 54 |
| CAD | 179,871 | 50 | -29,914 | 27 | 39,037 | 83 | -9,123 | 3 |
| AUD | 204,963 | 94 | -44,126 | 44 | 59,100 | 63 | -14,974 | 16 |
| NZD | 39,507 | 33 | -130 | 53 | 1,195 | 49 | -1,065 | 37 |
| MXN | 224,395 | 46 | 78,005 | 100 | -83,021 | 0 | 5,016 | 75 |
| RUB | 20,930 | 4 | 7,543 | 31 | -7,150 | 69 | -393 | 24 |
| BRL | 64,846 | 59 | 31,275 | 76 | -35,269 | 21 | 3,994 | 76 |
| Bitcoin | 11,715 | 45 | 187 | 80 | -624 | 0 | 437 | 23 |
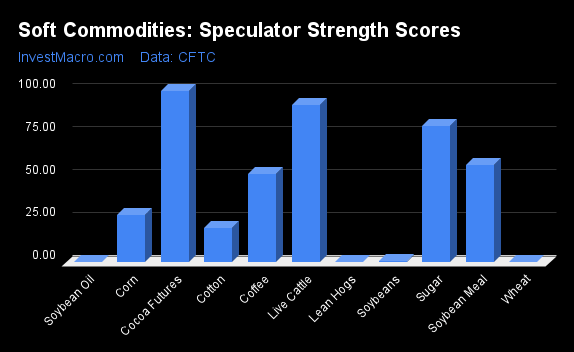
Strength Scores led by Mexican Peso & EuroFX

COT Strength Scores (a normalized measure of Speculator positions over a 3-Year range, from 0 to 100 where above 80 is Extreme-Bullish and below 20 is Extreme-Bearish) showed that the Mexican Peso (100 percent) and the EuroFX (82 percent) lead the currency markets this week. The British Pound (80 percent), Bitcoin (80 percent) and the Brazilian Real (76 percent) come in as the next highest in the weekly strength scores.
On the downside, the Japanese Yen (10 percent) comes in at the lowest strength levels currently and is in Extreme-Bearish territory (below 20 percent). The next lowest strength scores are the Canadian Dollar (27 percent), the Australian Dollar (44 percent) and the US Dollar Index (46 percent).
Strength Statistics:
US Dollar Index (46.2 percent) vs US Dollar Index previous week (43.7 percent)
EuroFX (82.3 percent) vs EuroFX previous week (85.3 percent)
British Pound Sterling (80.4 percent) vs British Pound Sterling previous week (79.0 percent)
Japanese Yen (9.6 percent) vs Japanese Yen previous week (19.2 percent)
Swiss Franc (53.5 percent) vs Swiss Franc previous week (52.2 percent)
Canadian Dollar (26.7 percent) vs Canadian Dollar previous week (9.3 percent)
Australian Dollar (43.9 percent) vs Australian Dollar previous week (39.3 percent)
New Zealand Dollar (53.2 percent) vs New Zealand Dollar previous week (52.6 percent)
Mexican Peso (100.0 percent) vs Mexican Peso previous week (99.3 percent)
Brazilian Real (75.6 percent) vs Brazilian Real previous week (77.4 percent)
Bitcoin (80.2 percent) vs Bitcoin previous week (92.5 percent)
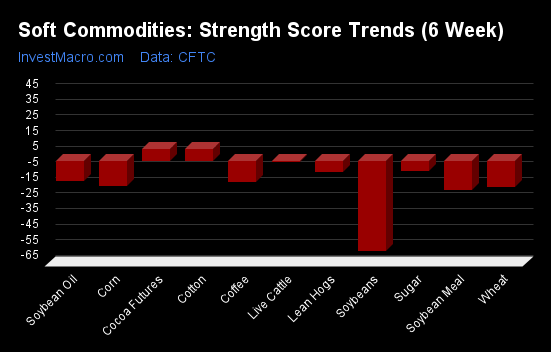
Brazilian Real & Canadian Dollar top the 6-Week Strength Trends
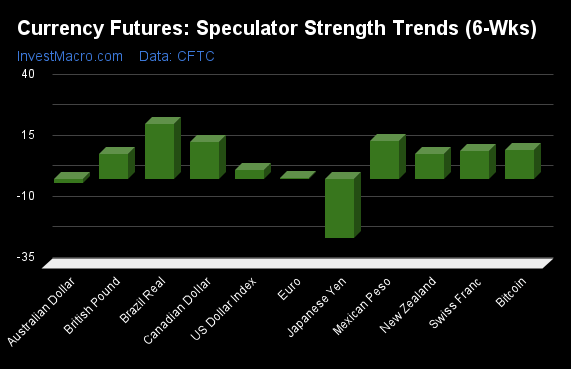
COT Strength Score Trends (or move index, calculates the 6-week changes in strength scores) showed that the Brazilian Real (22 percent) and the Canadian Dollar (15 percent) lead the past six weeks trends for the currencies. The Mexican Peso (15 percent), the Bitcoin (12 percent) and the Swiss Franc (11 percent) are the next highest positive movers in the latest trends data.
The Japanese Yen (-24 percent) leads the downside trend scores currently with the Australian Dollar (-2 percent), EuroFX (1 percent) and the US Dollar Index (4 percent) following next with lower trend scores.
Strength Trend Statistics:
US Dollar Index (3.8 percent) vs US Dollar Index previous week (-3.4 percent)
EuroFX (0.5 percent) vs EuroFX previous week (4.0 percent)
British Pound Sterling (10.2 percent) vs British Pound Sterling previous week (12.0 percent)
Japanese Yen (-24.2 percent) vs Japanese Yen previous week (-14.4 percent)
Swiss Franc (11.3 percent) vs Swiss Franc previous week (15.4 percent)
Canadian Dollar (15.2 percent) vs Canadian Dollar previous week (7.5 percent)
Australian Dollar (-1.6 percent) vs Australian Dollar previous week (-10.3 percent)
New Zealand Dollar (10.2 percent) vs New Zealand Dollar previous week (11.2 percent)
Mexican Peso (15.4 percent) vs Mexican Peso previous week (11.6 percent)
Brazilian Real (22.5 percent) vs Brazilian Real previous week (25.1 percent)
Bitcoin (11.8 percent) vs Bitcoin previous week (35.1 percent)
Individual COT Forex Markets:
US Dollar Index Futures:
 The US Dollar Index large speculator standing this week came in at a net position of 12,768 contracts in the data reported through Tuesday. This was a weekly increase of 1,528 contracts from the previous week which had a total of 11,240 net contracts.
This week’s current strength score (the trader positioning range over the past three years, measured from 0 to 100) shows the speculators are currently Bearish with a score of 46.2 percent. The commercials are Bearish with a score of 49.9 percent and the small traders (not shown in chart) are Bullish with a score of 54.7 percent.
| US DOLLAR INDEX Statistics | SPECULATORS | COMMERCIALS | SMALL TRADERS |
| – Percent of Open Interest Longs: | 73.9 | 2.5 | 18.3 |
| – Percent of Open Interest Shorts: | 34.5 | 52.8 | 7.5 |
| – Net Position: | 12,768 | -16,260 | 3,492 |
| – Gross Longs: | 23,927 | 819 | 5,936 |
| – Gross Shorts: | 11,159 | 17,079 | 2,444 |
| – Long to Short Ratio: | 2.1 to 1 | 0.0 to 1 | 2.4 to 1 |
| NET POSITION TREND: | | | |
| – Strength Index Score (3 Year Range Pct): | 46.2 | 49.9 | 54.7 |
| – Strength Index Reading (3 Year Range): | Bearish | Bearish | Bullish |
| NET POSITION MOVEMENT INDEX: | | | |
| – 6-Week Change in Strength Index: | 3.8 | -6.8 | 22.4 |
Euro Currency Futures:
 The Euro Currency large speculator standing this week came in at a net position of 165,725 contracts in the data reported through Tuesday. This was a weekly decrease of -8,011 contracts from the previous week which had a total of 173,736 net contracts.
This week’s current strength score (the trader positioning range over the past three years, measured from 0 to 100) shows the speculators are currently Bullish-Extreme with a score of 82.3 percent. The commercials are Bearish-Extreme with a score of 18.2 percent and the small traders (not shown in chart) are Bullish with a score of 56.0 percent.
| EURO Currency Statistics | SPECULATORS | COMMERCIALS | SMALL TRADERS |
| – Percent of Open Interest Longs: | 31.2 | 53.7 | 12.1 |
| – Percent of Open Interest Shorts: | 9.8 | 81.3 | 5.9 |
| – Net Position: | 165,725 | -214,015 | 48,290 |
| – Gross Longs: | 241,817 | 415,872 | 93,836 |
| – Gross Shorts: | 76,092 | 629,887 | 45,546 |
| – Long to Short Ratio: | 3.2 to 1 | 0.7 to 1 | 2.1 to 1 |
| NET POSITION TREND: | | | |
| – Strength Index Score (3 Year Range Pct): | 82.3 | 18.2 | 56.0 |
| – Strength Index Reading (3 Year Range): | Bullish-Extreme | Bearish-Extreme | Bullish |
| NET POSITION MOVEMENT INDEX: | | | |
| – 6-Week Change in Strength Index: | 0.5 | -0.2 | -1.0 |
British Pound Sterling Futures:
 The British Pound Sterling large speculator standing this week came in at a net position of 13,235 contracts in the data reported through Tuesday. This was a weekly increase of 1,646 contracts from the previous week which had a total of 11,589 net contracts.
This week’s current strength score (the trader positioning range over the past three years, measured from 0 to 100) shows the speculators are currently Bullish-Extreme with a score of 80.4 percent. The commercials are Bearish with a score of 23.8 percent and the small traders (not shown in chart) are Bullish with a score of 61.9 percent.
| BRITISH POUND Statistics | SPECULATORS | COMMERCIALS | SMALL TRADERS |
| – Percent of Open Interest Longs: | 29.3 | 51.6 | 12.3 |
| – Percent of Open Interest Shorts: | 23.8 | 57.9 | 11.5 |
| – Net Position: | 13,235 | -15,208 | 1,973 |
| – Gross Longs: | 70,320 | 124,002 | 29,613 |
| – Gross Shorts: | 57,085 | 139,210 | 27,640 |
| – Long to Short Ratio: | 1.2 to 1 | 0.9 to 1 | 1.1 to 1 |
| NET POSITION TREND: | | | |
| – Strength Index Score (3 Year Range Pct): | 80.4 | 23.8 | 61.9 |
| – Strength Index Reading (3 Year Range): | Bullish-Extreme | Bearish | Bullish |
| NET POSITION MOVEMENT INDEX: | | | |
| – 6-Week Change in Strength Index: | 10.2 | -4.9 | -9.3 |
Japanese Yen Futures:
 The Japanese Yen large speculator standing this week came in at a net position of -96,193 contracts in the data reported through Tuesday. This was a weekly lowering of -15,533 contracts from the previous week which had a total of -80,660 net contracts.
This week’s current strength score (the trader positioning range over the past three years, measured from 0 to 100) shows the speculators are currently Bearish-Extreme with a score of 9.6 percent. The commercials are Bullish-Extreme with a score of 87.6 percent and the small traders (not shown in chart) are Bearish with a score of 32.5 percent.
| JAPANESE YEN Statistics | SPECULATORS | COMMERCIALS | SMALL TRADERS |
| – Percent of Open Interest Longs: | 16.7 | 68.6 | 12.0 |
| – Percent of Open Interest Shorts: | 56.3 | 24.8 | 16.3 |
| – Net Position: | -96,193 | 106,512 | -10,319 |
| – Gross Longs: | 40,736 | 166,931 | 29,299 |
| – Gross Shorts: | 136,929 | 60,419 | 39,618 |
| – Long to Short Ratio: | 0.3 to 1 | 2.8 to 1 | 0.7 to 1 |
| NET POSITION TREND: | | | |
| – Strength Index Score (3 Year Range Pct): | 9.6 | 87.6 | 32.5 |
| – Strength Index Reading (3 Year Range): | Bearish-Extreme | Bullish-Extreme | Bearish |
| NET POSITION MOVEMENT INDEX: | | | |
| – 6-Week Change in Strength Index: | -24.2 | 21.9 | -11.3 |
Swiss Franc Futures:
 The Swiss Franc large speculator standing this week came in at a net position of -435 contracts in the data reported through Tuesday. This was a weekly lift of 468 contracts from the previous week which had a total of -903 net contracts.
This week’s current strength score (the trader positioning range over the past three years, measured from 0 to 100) shows the speculators are currently Bullish with a score of 53.5 percent. The commercials are Bearish with a score of 47.5 percent and the small traders (not shown in chart) are Bullish with a score of 53.8 percent.
| SWISS FRANC Statistics | SPECULATORS | COMMERCIALS | SMALL TRADERS |
| – Percent of Open Interest Longs: | 20.5 | 44.9 | 32.7 |
| – Percent of Open Interest Shorts: | 21.6 | 41.2 | 35.3 |
| – Net Position: | -435 | 1,533 | -1,098 |
| – Gross Longs: | 8,482 | 18,560 | 13,516 |
| – Gross Shorts: | 8,917 | 17,027 | 14,614 |
| – Long to Short Ratio: | 1.0 to 1 | 1.1 to 1 | 0.9 to 1 |
| NET POSITION TREND: | | | |
| – Strength Index Score (3 Year Range Pct): | 53.5 | 47.5 | 53.8 |
| – Strength Index Reading (3 Year Range): | Bullish | Bearish | Bullish |
| NET POSITION MOVEMENT INDEX: | | | |
| – 6-Week Change in Strength Index: | 11.3 | -3.1 | -8.2 |
Canadian Dollar Futures:
 The Canadian Dollar large speculator standing this week came in at a net position of -29,914 contracts in the data reported through Tuesday. This was a weekly boost of 18,612 contracts from the previous week which had a total of -48,526 net contracts.
This week’s current strength score (the trader positioning range over the past three years, measured from 0 to 100) shows the speculators are currently Bearish with a score of 26.7 percent. The commercials are Bullish-Extreme with a score of 82.7 percent and the small traders (not shown in chart) are Bearish-Extreme with a score of 2.5 percent.
| CANADIAN DOLLAR Statistics | SPECULATORS | COMMERCIALS | SMALL TRADERS |
| – Percent of Open Interest Longs: | 20.9 | 59.6 | 15.2 |
| – Percent of Open Interest Shorts: | 37.5 | 37.9 | 20.3 |
| – Net Position: | -29,914 | 39,037 | -9,123 |
| – Gross Longs: | 37,619 | 107,243 | 27,430 |
| – Gross Shorts: | 67,533 | 68,206 | 36,553 |
| – Long to Short Ratio: | 0.6 to 1 | 1.6 to 1 | 0.8 to 1 |
| NET POSITION TREND: | | | |
| – Strength Index Score (3 Year Range Pct): | 26.7 | 82.7 | 2.5 |
| – Strength Index Reading (3 Year Range): | Bearish | Bullish-Extreme | Bearish-Extreme |
| NET POSITION MOVEMENT INDEX: | | | |
| – 6-Week Change in Strength Index: | 15.2 | -2.1 | -29.2 |
Australian Dollar Futures:
 The Australian Dollar large speculator standing this week came in at a net position of -44,126 contracts in the data reported through Tuesday. This was a weekly lift of 4,955 contracts from the previous week which had a total of -49,081 net contracts.
This week’s current strength score (the trader positioning range over the past three years, measured from 0 to 100) shows the speculators are currently Bearish with a score of 43.9 percent. The commercials are Bullish with a score of 63.0 percent and the small traders (not shown in chart) are Bearish-Extreme with a score of 15.9 percent.
| AUSTRALIAN DOLLAR Statistics | SPECULATORS | COMMERCIALS | SMALL TRADERS |
| – Percent of Open Interest Longs: | 33.6 | 53.4 | 9.5 |
| – Percent of Open Interest Shorts: | 55.2 | 24.6 | 16.8 |
| – Net Position: | -44,126 | 59,100 | -14,974 |
| – Gross Longs: | 68,969 | 109,462 | 19,509 |
| – Gross Shorts: | 113,095 | 50,362 | 34,483 |
| – Long to Short Ratio: | 0.6 to 1 | 2.2 to 1 | 0.6 to 1 |
| NET POSITION TREND: | | | |
| – Strength Index Score (3 Year Range Pct): | 43.9 | 63.0 | 15.9 |
| – Strength Index Reading (3 Year Range): | Bearish | Bullish | Bearish-Extreme |
| NET POSITION MOVEMENT INDEX: | | | |
| – 6-Week Change in Strength Index: | -1.6 | 6.4 | -16.5 |
New Zealand Dollar Futures:
 The New Zealand Dollar large speculator standing this week came in at a net position of -130 contracts in the data reported through Tuesday. This was a weekly boost of 233 contracts from the previous week which had a total of -363 net contracts.
This week’s current strength score (the trader positioning range over the past three years, measured from 0 to 100) shows the speculators are currently Bullish with a score of 53.2 percent. The commercials are Bearish with a score of 49.3 percent and the small traders (not shown in chart) are Bearish with a score of 37.3 percent.
| NEW ZEALAND DOLLAR Statistics | SPECULATORS | COMMERCIALS | SMALL TRADERS |
| – Percent of Open Interest Longs: | 40.7 | 47.1 | 9.3 |
| – Percent of Open Interest Shorts: | 41.0 | 44.1 | 12.0 |
| – Net Position: | -130 | 1,195 | -1,065 |
| – Gross Longs: | 16,081 | 18,608 | 3,670 |
| – Gross Shorts: | 16,211 | 17,413 | 4,735 |
| – Long to Short Ratio: | 1.0 to 1 | 1.1 to 1 | 0.8 to 1 |
| NET POSITION TREND: | | | |
| – Strength Index Score (3 Year Range Pct): | 53.2 | 49.3 | 37.3 |
| – Strength Index Reading (3 Year Range): | Bullish | Bearish | Bearish |
| NET POSITION MOVEMENT INDEX: | | | |
| – 6-Week Change in Strength Index: | 10.2 | -5.9 | -14.9 |
Mexican Peso Futures:
 The Mexican Peso large speculator standing this week came in at a net position of 78,005 contracts in the data reported through Tuesday. This was a weekly rise of 1,062 contracts from the previous week which had a total of 76,943 net contracts.
This week’s current strength score (the trader positioning range over the past three years, measured from 0 to 100) shows the speculators are currently Bullish-Extreme with a score of 100.0 percent. The commercials are Bearish-Extreme with a score of 0.0 percent and the small traders (not shown in chart) are Bullish with a score of 75.3 percent.
| MEXICAN PESO Statistics | SPECULATORS | COMMERCIALS | SMALL TRADERS |
| – Percent of Open Interest Longs: | 51.5 | 44.1 | 3.5 |
| – Percent of Open Interest Shorts: | 16.7 | 81.1 | 1.3 |
| – Net Position: | 78,005 | -83,021 | 5,016 |
| – Gross Longs: | 115,535 | 98,971 | 7,942 |
| – Gross Shorts: | 37,530 | 181,992 | 2,926 |
| – Long to Short Ratio: | 3.1 to 1 | 0.5 to 1 | 2.7 to 1 |
| NET POSITION TREND: | | | |
| – Strength Index Score (3 Year Range Pct): | 100.0 | 0.0 | 75.3 |
| – Strength Index Reading (3 Year Range): | Bullish-Extreme | Bearish-Extreme | Bullish |
| NET POSITION MOVEMENT INDEX: | | | |
| – 6-Week Change in Strength Index: | 15.4 | -14.9 | 3.4 |
Brazilian Real Futures:
 The Brazilian Real large speculator standing this week came in at a net position of 31,275 contracts in the data reported through Tuesday. This was a weekly lowering of -1,417 contracts from the previous week which had a total of 32,692 net contracts.
This week’s current strength score (the trader positioning range over the past three years, measured from 0 to 100) shows the speculators are currently Bullish with a score of 75.6 percent. The commercials are Bearish with a score of 21.3 percent and the small traders (not shown in chart) are Bullish with a score of 75.8 percent.
| BRAZIL REAL Statistics | SPECULATORS | COMMERCIALS | SMALL TRADERS |
| – Percent of Open Interest Longs: | 54.3 | 29.1 | 15.4 |
| – Percent of Open Interest Shorts: | 6.1 | 83.5 | 9.3 |
| – Net Position: | 31,275 | -35,269 | 3,994 |
| – Gross Longs: | 35,223 | 18,861 | 9,998 |
| – Gross Shorts: | 3,948 | 54,130 | 6,004 |
| – Long to Short Ratio: | 8.9 to 1 | 0.3 to 1 | 1.7 to 1 |
| NET POSITION TREND: | | | |
| – Strength Index Score (3 Year Range Pct): | 75.6 | 21.3 | 75.8 |
| – Strength Index Reading (3 Year Range): | Bullish | Bearish | Bullish |
| NET POSITION MOVEMENT INDEX: | | | |
| – 6-Week Change in Strength Index: | 22.5 | -25.2 | 22.4 |
Bitcoin Futures:
 The Bitcoin large speculator standing this week came in at a net position of 187 contracts in the data reported through Tuesday. This was a weekly fall of -706 contracts from the previous week which had a total of 893 net contracts.
This week’s current strength score (the trader positioning range over the past three years, measured from 0 to 100) shows the speculators are currently Bullish-Extreme with a score of 80.2 percent. The commercials are Bearish with a score of 35.2 percent and the small traders (not shown in chart) are Bearish with a score of 22.9 percent.
| BITCOIN Statistics | SPECULATORS | COMMERCIALS | SMALL TRADERS |
| – Percent of Open Interest Longs: | 77.2 | 2.1 | 10.1 |
| – Percent of Open Interest Shorts: | 75.6 | 7.5 | 6.3 |
| – Net Position: | 187 | -624 | 437 |
| – Gross Longs: | 9,040 | 251 | 1,178 |
| – Gross Shorts: | 8,853 | 875 | 741 |
| – Long to Short Ratio: | 1.0 to 1 | 0.3 to 1 | 1.6 to 1 |
| NET POSITION TREND: | | | |
| – Strength Index Score (3 Year Range Pct): | 80.2 | 35.2 | 22.9 |
| – Strength Index Reading (3 Year Range): | Bullish-Extreme | Bearish | Bearish |
| NET POSITION MOVEMENT INDEX: | | | |
| – 6-Week Change in Strength Index: | 11.8 | -18.8 | -5.2 |
Article By InvestMacro – Receive our weekly COT Newsletter
*COT Report: The COT data, released weekly to the public each Friday, is updated through the most recent Tuesday (data is 3 days old) and shows a quick view of how large speculators or non-commercials (for-profit traders) were positioned in the futures markets.
The CFTC categorizes trader positions according to commercial hedgers (traders who use futures contracts for hedging as part of the business), non-commercials (large traders who speculate to realize trading profits) and nonreportable traders (usually small traders/speculators) as well as their open interest (contracts open in the market at time of reporting). See CFTC criteria here.


 EU consumers are familiar making payments with traditional coins and bills, but soon they could be joined by an ‘e-euro”.

 Business deals by foreign countries in the U.S. can be reviewed by the government for national security risks.
