Archive for Opinions – Page 34

Gold prices rise again as demand for safe-haven assets increases

By RoboForex Analytical Department 

Gold stabilised around 2,940 USD per troy ounce on Tuesday, remaining close to record highs. The metal continues to benefit from strong demand for safe-haven assets amid growing concerns over US President Donald Trump’s tariff policies.

Key factors driving Gold prices

On Monday, Trump confirmed that tariffs on Canadian and Mexican imports will proceed as planned. This triggered fresh market concerns over inflation risks, which could influence the Federal Reserve’s future monetary policy.

In addition to geopolitical tensions, Gold is receiving support from the SPDR Gold Trust, the world’s largest gold-backed exchange-traded fund. The fund reported increased assets to 904.38, marking the highest level since August 2023.

Investors focus now shifts to Friday’s Personal Consumption Expenditures (PCE) report, the Fed’s preferred inflation gauge. The data is expected to show the slowest price growth since June 2024. However, persistent inflationary pressures may keep the Fed cautious about cutting interest rates too soon.

Technical analysis of XAU/USD

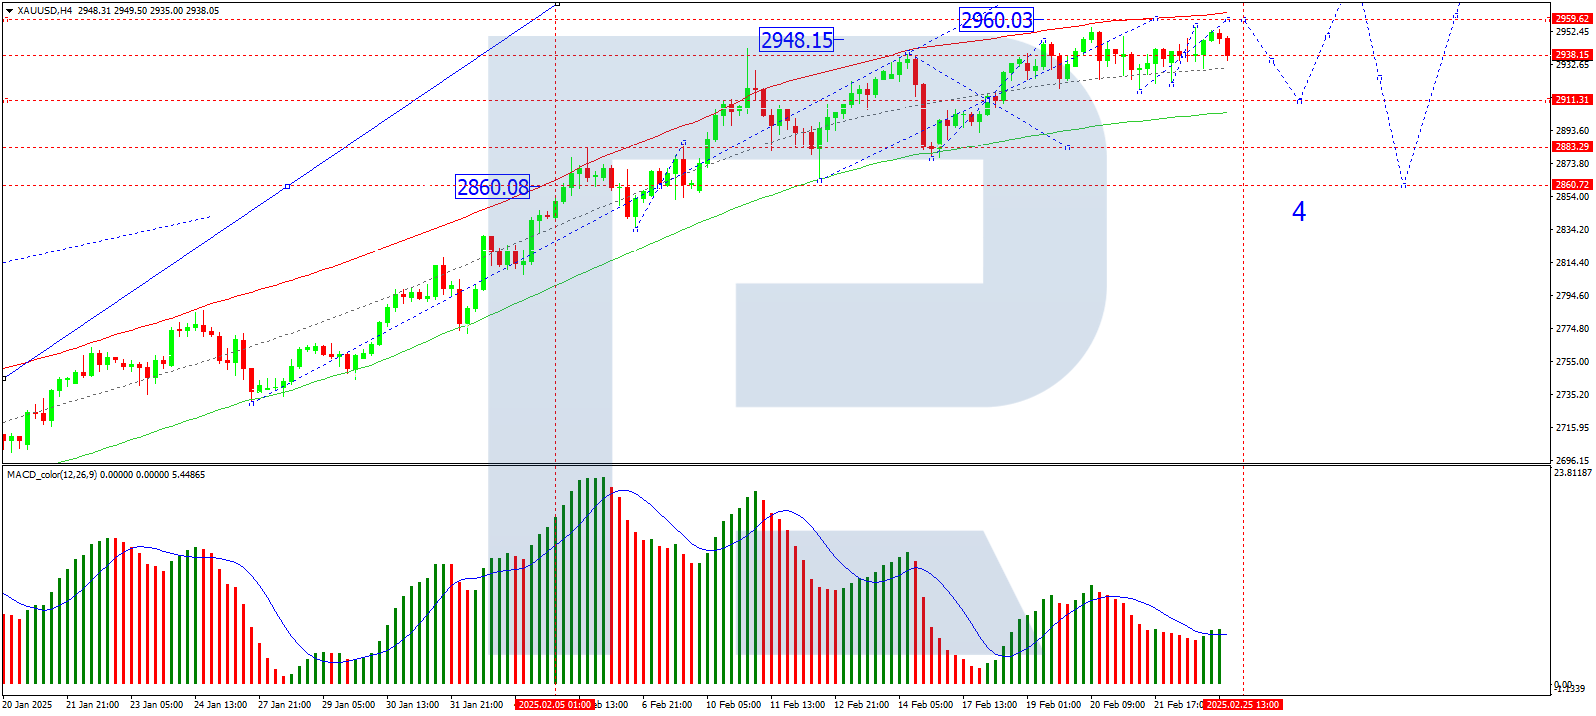
On the H4 chart, XAU/USD is consolidating around 2,938. A potential downward move towards 2,911 (a test from above) is likely before a renewed growth wave targets 2,960 as a local high. Once this level is reached, a corrective decline towards 2,860 could begin. The MACD indicator confirms this outlook, with its signal line above the zero level and pointing decisively upwards.

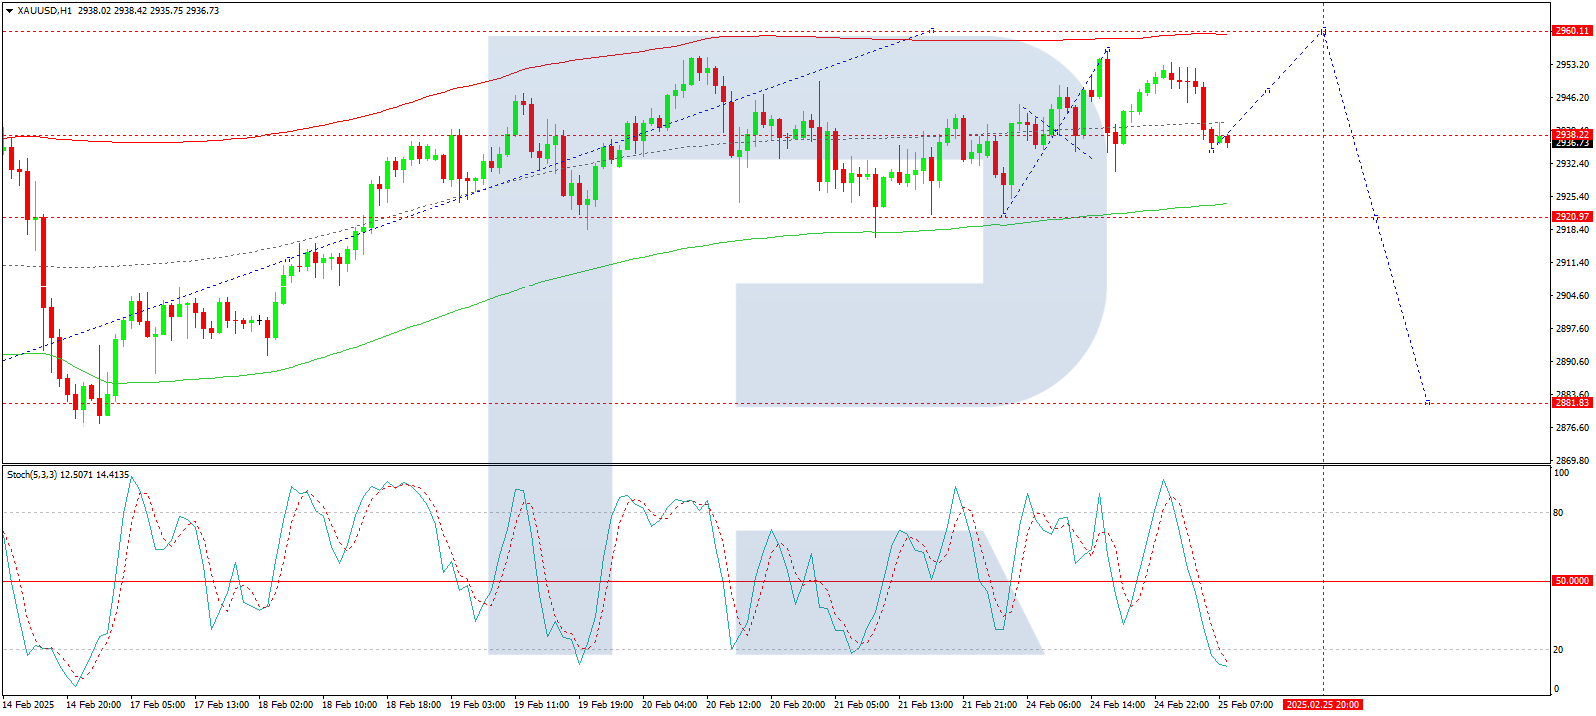
On the H1 chart, Gold recently formed a growth wave to 2,956 before correcting back to 2,938. A consolidation range is expected to develop around this level. If the price breaks downwards, a move towards 2,920 could occur before another upward impulse targets 2,960. The Stochastic oscillator supports this scenario, with its signal line below 20, indicating an imminent rise towards 80.

Conclusion

Gold remains in a strong uptrend, supported by safe-haven demand, geopolitical uncertainties, and increased holdings in gold-backed ETFs. Technical indicators suggest a potential short-term dip before another move higher towards 2,960. However, investors should watch upcoming inflation data, which could influence the Fed’s rate outlook and Gold’s trajectory.


Disclaimer

Any forecasts contained herein are based on the author’s particular opinion. This analysis may not be treated as trading advice. RoboForex bears no responsibility for trading results based on trading recommendations and reviews contained herein.

COT Speculator Extremes: Steel & US Treasury Bonds lead Bullish Positions

By InvestMacro

The latest update for the weekly Commitment of Traders (COT) report was released by the Commodity Futures Trading Commission (CFTC) on Friday for data ending on February 18th.

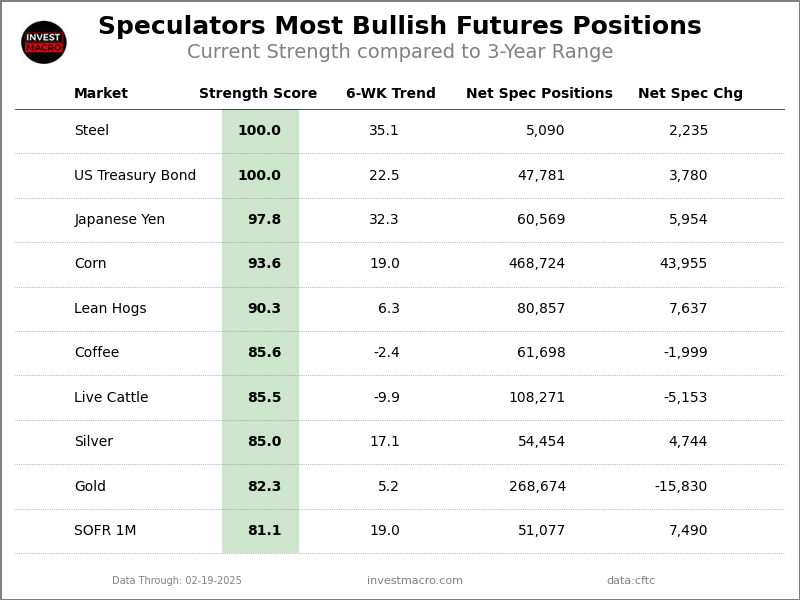
This weekly Extreme Positions report highlights the Most Bullish and Most Bearish Positions for the speculator category. Extreme positioning in these markets can foreshadow strong moves in the underlying market.

To signify an extreme position, we use the Strength Index (also known as the COT Index) of each instrument, a common method of measuring COT data. The Strength Index is simply a comparison of current trader positions against the range of positions over the previous 3 years. We use over 80 percent as extremely bullish and under 20 percent as extremely bearish. (Compare Strength Index scores across all markets in the data table or cot leaders table)


Here Are This Week’s Most Bullish Speculator Positions:

Steel


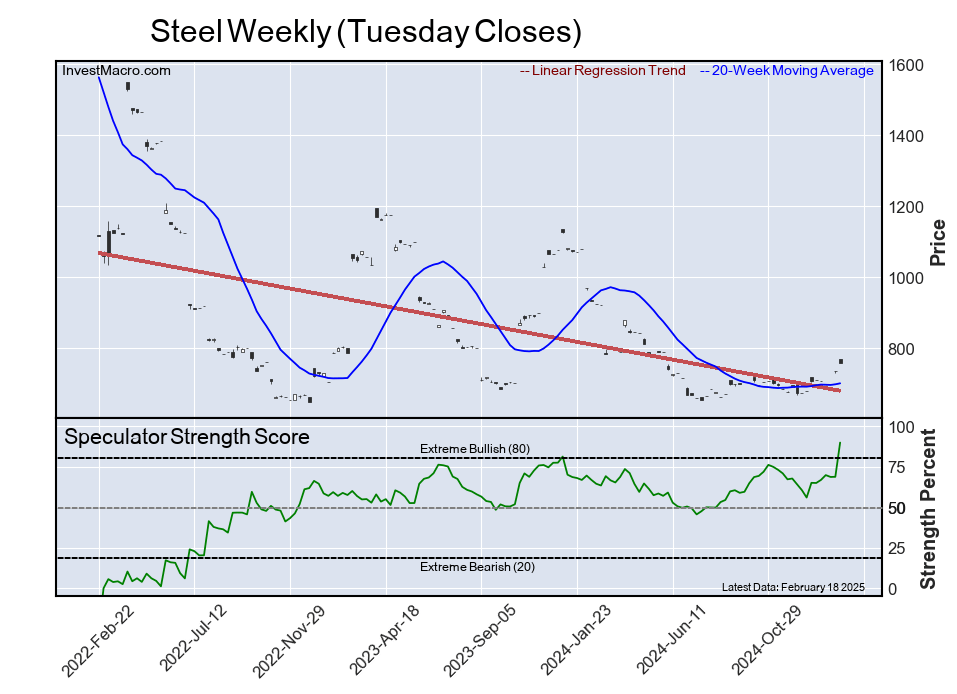
The Steel speculator position comes in as the most bullish extreme standing this week. The Steel speculator level is currently at a 100.0 percent score of its 3-year range.

The six-week trend for the percent strength score totaled 35.1 this week. The overall net speculator position was a total of 5,090 net contracts this week with a gain of 2,235 contract in the weekly speculator bets.


Speculators or Non-Commercials Notes:

Speculators, classified as non-commercial traders by the CFTC, are made up of large commodity funds, hedge funds and other significant for-profit participants. The Specs are generally regarded as trend-followers in their behavior towards price action – net speculator bets and prices tend to go in the same directions. These traders often look to buy when prices are rising and sell when prices are falling. To illustrate this point, many times speculator contracts can be found at their most extremes (bullish or bearish) when prices are also close to their highest or lowest levels.

These extreme levels can be dangerous for the large speculators as the trade is most crowded, there is less trading ammunition still sitting on the sidelines to push the trend further and prices have moved a significant distance. When the trend becomes exhausted, some speculators take profits while others look to also exit positions when prices fail to continue in the same direction. This process usually plays out over many months to years and can ultimately create a reverse effect where prices start to fall and speculators start a process of selling when prices are falling.


US Treasury Bond


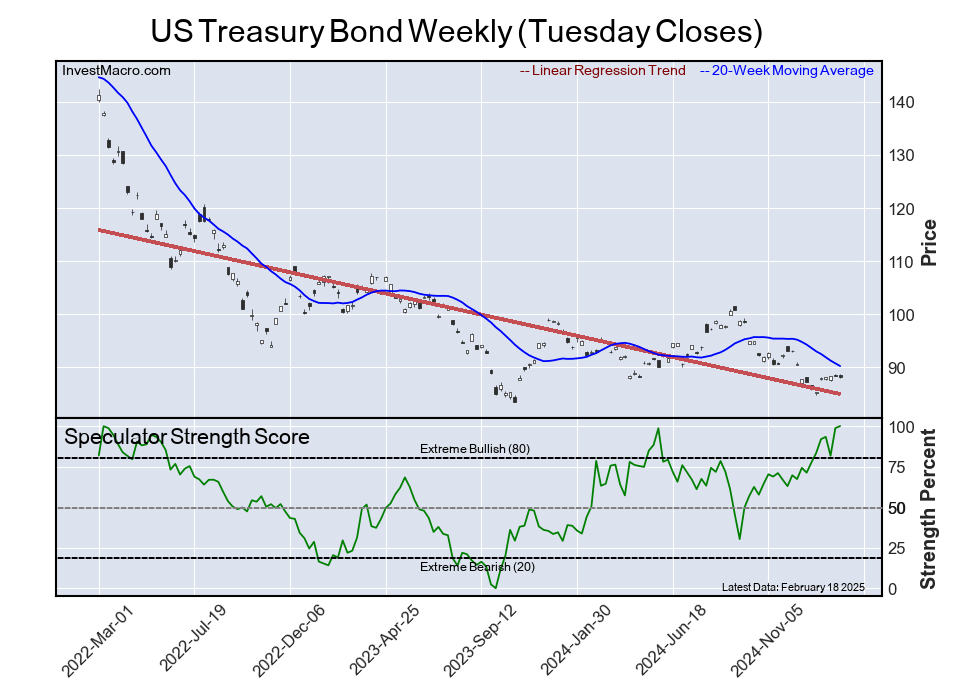
The US Treasury Bond speculator position comes next and tied for the most bullish lead in the extreme standings this week. The US Treasury Bond speculator level is now at a 100.0 percent score of its 3-year range.

The six-week trend for the percent strength score was 22.5 this week. The speculator position registered 47,781 net contracts this week with a weekly rise by 3,780 contracts in speculator bets.


Japanese Yen


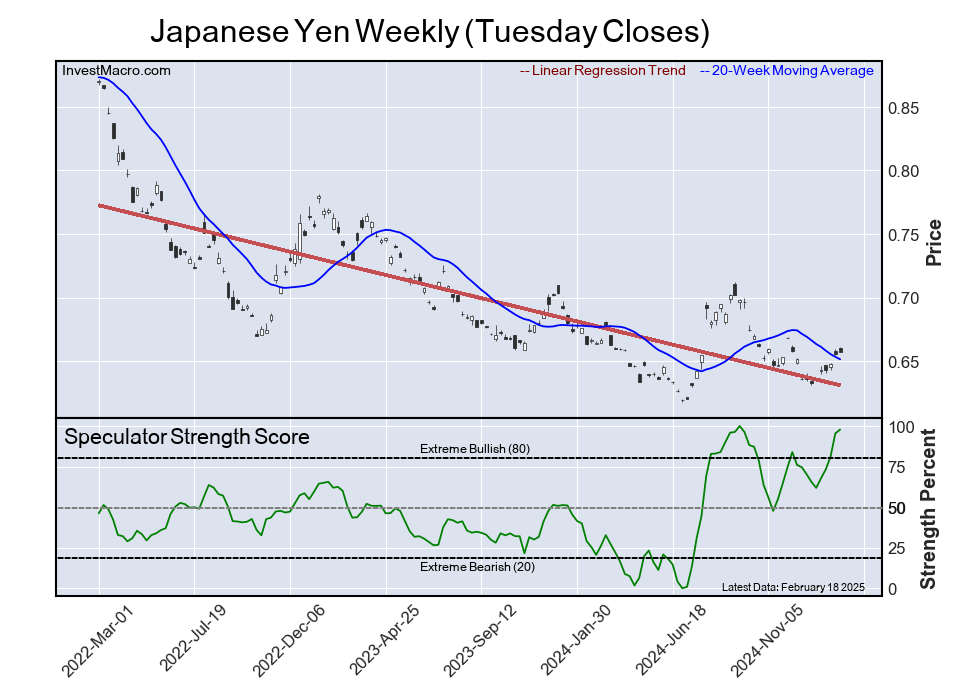
The Japanese Yen speculator position comes in next this week in the extreme standings as the yen sentiment has turned around positively. The Japanese Yen speculator level resides at a 97.8 percent score of its 3-year range.

The six-week trend for the speculator strength score came in at 32.3 this week. The overall speculator position was 60,569 net contracts this week with an increase by 5,954 contracts in the weekly speculator bets.


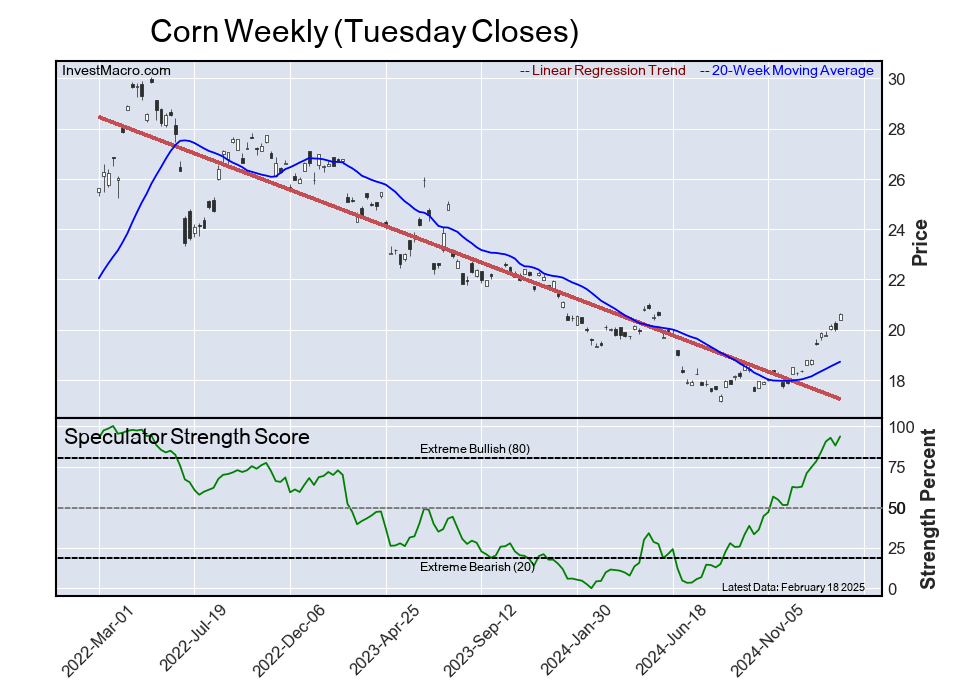
Corn


The Corn speculator position comes up number four in the extreme standings this week as Corn’s sentiment has also turned around sharply in the past months. The Corn speculator level is currently at a 93.6 percent score of its 3-year range.

The six-week trend for the speculator strength score totaled a change of 19.0 this week. The overall speculator position was 468,724 net contracts this week with a jump by 43,955 contracts in the speculator bets.


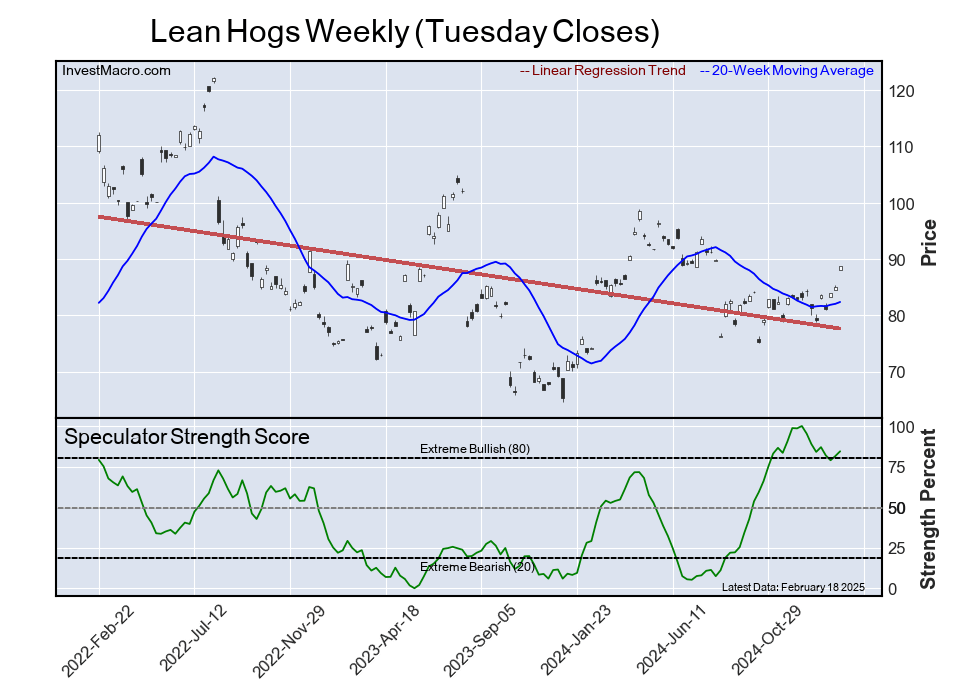
Lean Hogs


The Lean Hogs speculator position rounds out the top five in this week’s bullish extreme standings. The Lean Hogs speculator level sits at a 90.3 percent score of its 3-year range. The six-week trend for the speculator strength score was 6.3 this week.

The speculator position was 80,857 net contracts this week with an advance by 7,637 contracts in the weekly speculator bets.


This Week’s Most Bearish Speculator Positions:

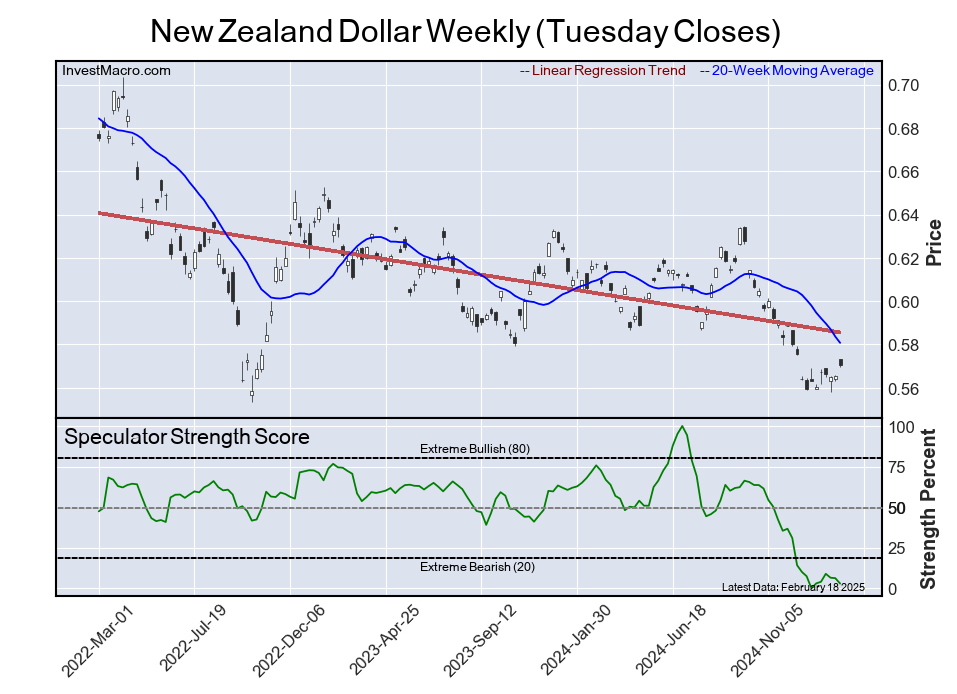
New Zealand Dollar


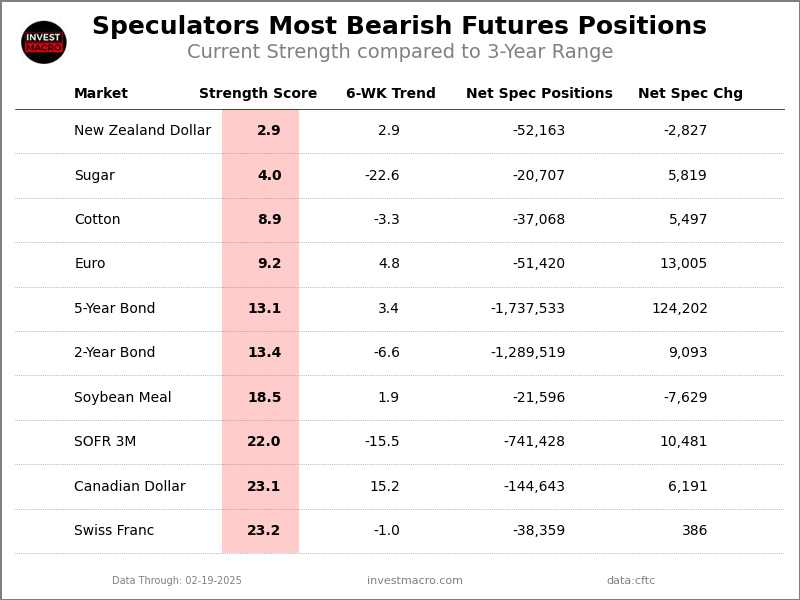
The New Zealand Dollar speculator position comes in as the most bearish extreme standing this week. The New Zealand Dollar speculator level is at a 2.9 percent score of its 3-year range.

The six-week trend for the speculator strength score was also 2.9 this week. The overall speculator position was -52,163 net contracts this week with a decline of -2,827 contracts in the speculator bets.


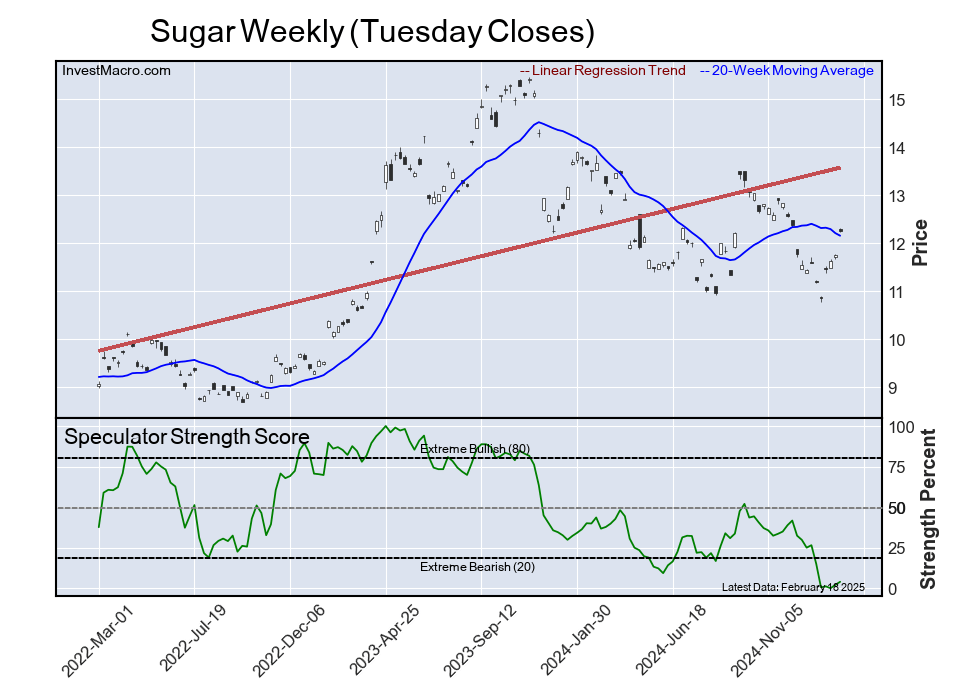
Sugar


The Sugar speculator position comes in next for the most bearish extreme standing on the week. The Sugar speculator level is at a 4.0 percent score of its 3-year range.

The six-week trend for the speculator strength score was -22.6 this week. The speculator position was -20,707 net contracts this week with a rise of 5,819 contracts in the weekly speculator bets.


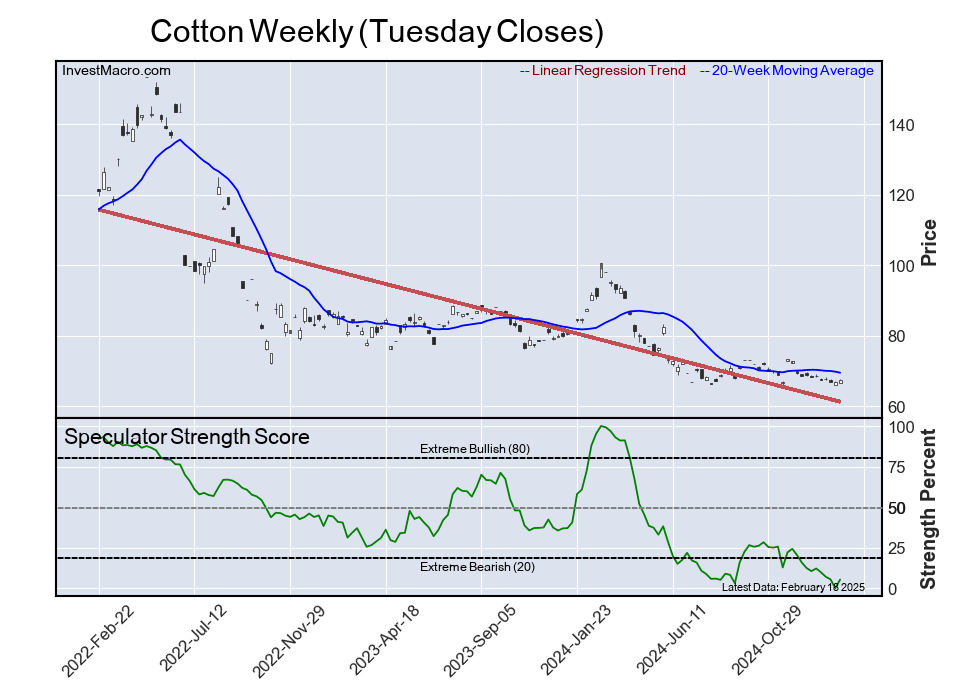
Cotton


The Cotton speculator position comes in as third most bearish extreme standing of the week. The Cotton speculator level resides at a 8.9 percent score of its 3-year range.

The six-week trend for the speculator strength score was -3.3 this week. The overall speculator position was -37,068 net contracts this week with an increase by 5,497 contracts in the speculator bets.


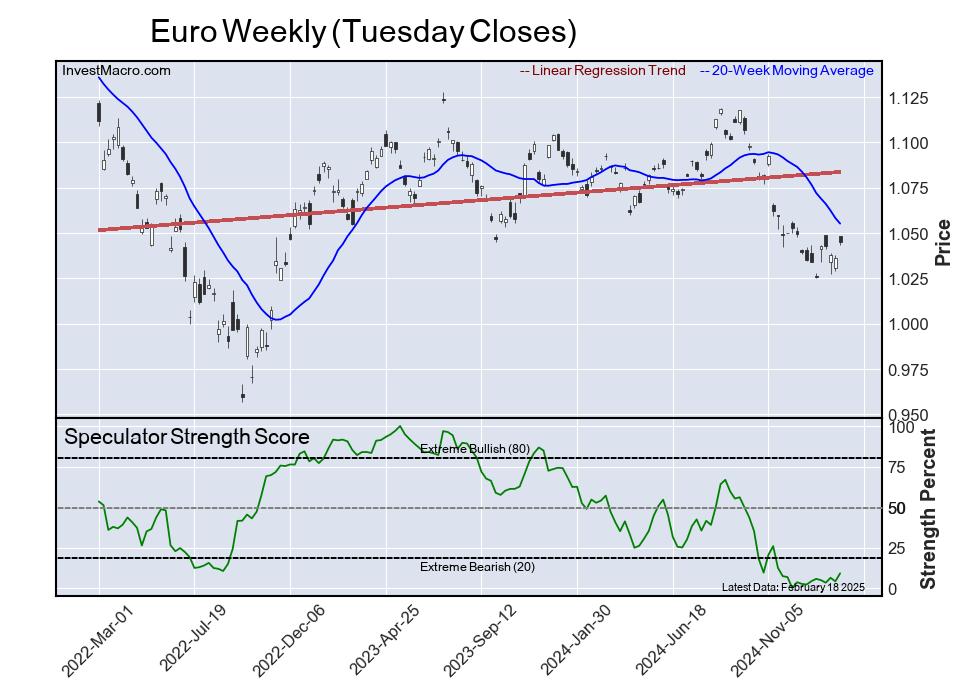
Euro


The Euro speculator position comes in as this week’s fourth most bearish extreme standing. The Euro speculator level is at a 9.2 percent score of its 3-year range.

The six-week trend for the speculator strength score was 4.8 this week. The speculator position was -51,420 net contracts this week with a gain of 13,005 contracts in the weekly speculator bets.


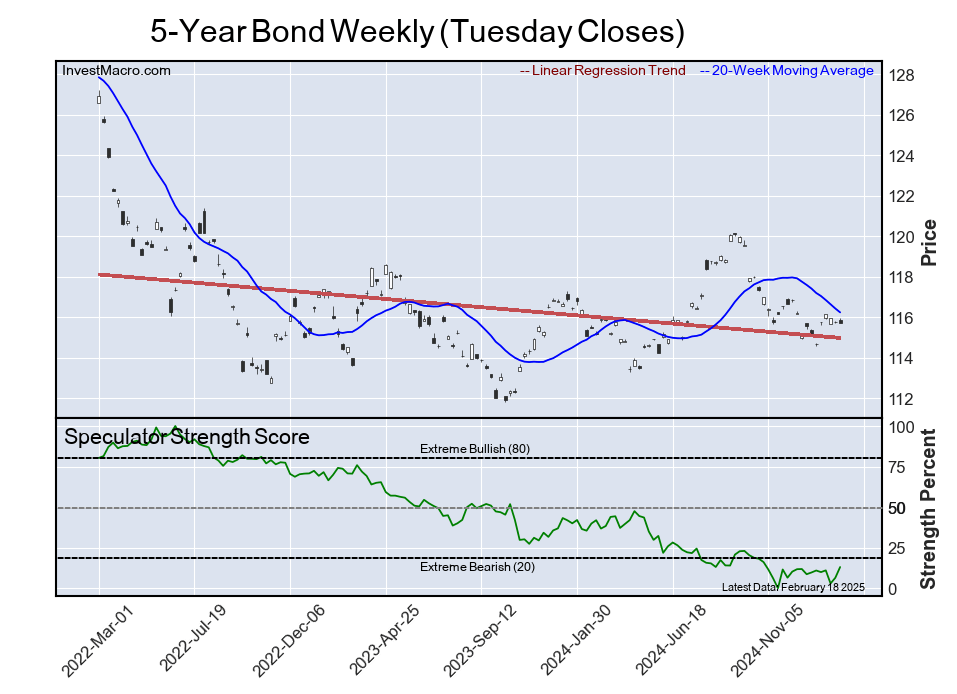
5-Year Bond


Finally, the 5-Year Bond speculator position comes in as the fifth most bearish extreme standing for this week. The 5-Year Bond speculator level is at a 13.1 percent score of its 3-year range.

The six-week trend for the speculator strength score was 3.4 this week. The speculator position was -1,737,533 net contracts this week with a rise by 124,202 contracts in the weekly speculator bets.


Article By InvestMacroReceive our weekly COT Newsletter

*COT Report: The COT data, released weekly to the public each Friday, is updated through the most recent Tuesday (data is 3 days old) and shows a quick view of how large speculators or non-commercials (for-profit traders) were positioned in the futures markets.

The CFTC categorizes trader positions according to commercial hedgers (traders who use futures contracts for hedging as part of the business), non-commercials (large traders who speculate to realize trading profits) and nonreportable traders (usually small traders/speculators) as well as their open interest (contracts open in the market at time of reporting). See CFTC criteria here.


A fiscal crisis is looming for many US cities

By John Rennie Short, University of Maryland, Baltimore County 

Five years after the start of the COVID-19 pandemic, many U.S. cities are still adjusting to a new normal, with more people working remotely and less economic activity in city centers. Other factors, such as underfunded pension plans for municipal employees, are pushing many city budgets into the red.

Urban fiscal struggles are not new, but historically they have mainly affected U.S. cities that are small, poor or saddled with incompetent managers. Today, however, even large cities, including Chicago, Houston and San Francisco, are under serious financial stress.

This is a looming nationwide threat, driven by factors that include climate change, declining downtown activity, loss of federal funds and large pension and retirement commitments.

Spending cuts abound in many U.S. cities as inflation lingers and pandemic-era stimulus dries up.

Why cities struggle

Many U.S. cities have faced fiscal crises over the past century, for diverse reasons. Most commonly, stress occurs after an economic downturn or sharp fall in tax revenues.

Florida municipalities began to default in 1926 after the collapse of a land boom. Municipal defaults were common across the nation in the 1930s during the Great Depression: As unemployment rose, relief burdens swelled and tax collections dwindled.

In 1934 Congress amended the U.S. bankruptcy code to allow municipalities to file formally for bankruptcy. Subsequently, 27 states enacted laws that authorized cities to become debtors and seek bankruptcy protection.

Declaring bankruptcy was not a cure-all. It allowed cities to refinance debt or stretch out payment schedules, but it also could lead to higher taxes and fees for residents, and lower pay and benefits for city employees. And it could stigmatize a city for many years afterward.

In the 1960s and 1970s, many urban residents and businesses left cities for adjoining suburbs. Many cities, including New York, Cleveland and Philadelphia, found it difficult to repay debts as their tax bases shrank.

A tabloid newspaper with a photo of President Gerald Ford and the headline 'Ford to City: Drop Dead'
The New York Daily News, Oct. 30, 1975, after U.S. President Gerald Ford ruled out providing federal aid to save the city from bankruptcy. Several months later, Ford signed legislation authorizing federal loans.
Edward Stojakovic/Flickr, CC BY

In the wake of the 2008-2009 housing market collapse, cities including Detroit, San Bernardino, California, and Stockton, California, filed for bankruptcy. Other cities faced similar difficulties but were located in states that did not allow municipalities to declare bankruptcy.

Even large, affluent jurisdictions could go off the financial rails. For example, Orange County, California, went bankrupt in 2002 after its treasurer, Robert Citron, pursued a risky investment strategy of complex leveraging deals, losing some $1.65 billion in taxpayer funds.

Today, cities face a convergence of rising costs and decreasing revenues in many places. As I see it, the urban fiscal crisis is now a pervasive national challenge.

Climate-driven disasters

Climate change and its attendant increase in major disasters are putting financial pressure on municipalities across the country.

Events like wildfires and flooding have twofold effects on city finances. First, money has to be spent on rebuilding damaged infrastructure, such as roads, water lines and public buildings. Second, after the disaster, cities may either act on their own or be required under state or federal law to make expensive investments in preparation for the next storm or wildfire.

In Houston, for example, court rulings after multiple years of severe flooding are forcing the city to spend $100 million on street repairs and drainage by mid-2025. This requirement will expand the deficit in Houston’s annual budget to $330 million.

In Massachusetts, towns on Cape Cod are spending millions of dollars to switch from septic systems to public sewer lines and upgrade wastewater treatment plants. Population growth has sharply increased water pollution on the Cape, and climate change is promoting blooms of toxic algae that feed on nutrients in wastewater.

Increasing uncertainty about the total costs of mitigating and adapting to climate change will inevitably lead rating agencies to downgrade municipal credit ratings. This raises cities’ costs to borrow money for climate-related projects like protecting shorelines and improving wastewater treatment.

Underfunded pensions

Cities also spend a lot of money on employees, and many large cities are struggling to fund pensions and health benefits for their workforces. As municipal retirees live longer and require more health care, the costs are mounting.

For example, Chicago currently faces a budget deficit of nearly $1 billion, which stems partly from underfunded retirement benefits for nearly 30,000 public employees. The city has $35 billion in unfunded pension liabilities and almost $2 billion in unfunded retiree health benefits. Chicago’s teachers are owed $14 billion in unfunded benefits.

Policy studies have shown for years that politicians tend to underfund retirement and pension benefits for public employees. This approach offloads the real cost of providing police, fire protection and education onto future taxpayers.

Struggling downtowns and less federal support

Cities aren’t just facing rising costs – they’re also losing revenues. In many U.S. cities, retail and commercial office economies are declining. Developers have overbuilt commercial properties, creating an excess supply. More unleased properties will mean lower tax revenues.

At the same time, pandemic-related federal aid that cushioned municipal finances from 2020 through 2024 is dwindling.

State and local governments received $150 billion through the 2020 Coronavirus Aid, Relief, and Economic Security (CARES) Act and an additional $130 billion through the 2021 American Rescue Plan Act. Now, however, this federal largesse – which some cities used to fill mounting fiscal cracks – is at an end.

In my view, President Donald Trump’s administration is highly unlikely to bail out urban areas – especially more liberal cities like Detroit, Philadelphia and San Francisco. Trump has portrayed large cities governed by Democrats in the darkest terms – for example, calling Baltimore a “rodent-infested mess” and Washington, D.C., a “dirty, crime-ridden death trap.” I expect that Trump’s animus against big cities, which was a staple of his 2024 campaign, could become a hallmark of his second term.

Detroit officials respond to disparaging remarks about the city by Donald Trump during a campaign speech in Detroit, Oct. 10, 2024.

Resistance to new taxes

Cities can generate revenue from taxes on sales, businesses, property and utilities. However, increasing municipal taxes – particularly property taxes – can be very difficult.

In 1978, California adopted Proposition 13 – a ballot measure that limited property tax increases to the rate of inflation or 2% per year, whichever is lower. This high-profile campaign created a widespread narrative that property taxes were out of control and made it very hard for local officials to support property tax increases.

Thanks to caps like Prop 13, a persistent public view that taxes are too high and political resistance, property taxes have tended to lag behind inflation in many parts of the country.

The crunch

Taking these factors together, I see a fiscal crunch coming for U.S. cities. Small cities with low budgets are particularly vulnerable. But so are larger, more affluent cities, such as San Francisco with its collapsing downtown office market, or Houston, New York and Miami, which face growing costs from climate change.

One city manager who runs an affluent municipality in the Pacific Northwest told me that in these difficult circumstances, politicians need to be more frank and open with their constituents and explain convincingly and compellingly how and why taxpayer money is being spent.

Efforts to balance city budgets are opportunities to build consensus with the public about what municipalities can do, and at what cost. The coming months will show whether politicians and city residents are ready for these hard conversations.The Conversation

About the Author:

John Rennie Short, Professor Emeritus of Public Policy, University of Maryland, Baltimore County

This article is republished from The Conversation under a Creative Commons license. Read the original article.

Investors value corporate tax responsibility – at least when the company is based somewhere with a lot of inequality, research shows

By Erica Neuman, University of Dayton and Curtis Farnsel, University of Dayton 

When corporations based in areas of above-average income inequality pay more taxes, it’s not just the public that appreciates it – investors do, too. That’s the key finding of our recent research published in the journal Accounting and the Public Interest.

Our finding challenges traditional economic theory holding that investors see corporate taxes as a transfer of wealth from shareholders to the state. That would suggest investors value only strategies that minimize taxes. The reality isn’t so simple.

As accounting professors at the University of Dayton, we study the intersection of corporate taxes and corporate social responsibility. We wanted to better understand how corporate taxes affect firm value and stock prices, and whether that relationship changes if a company is headquartered in an area with high income inequality.

So we looked at financial data from over 1,500 firms over a 10-year period between 2011 and 2019, as well as the income inequality in the metro areas where they’re headquartered. For the latter point, we used the Gini coefficient, a measure of income distribution in a given place. This is a particularly useful context for looking at corporate taxes, since one of the key functions of taxation is to counter inequality.

We found that there’s a negative relationship between corporate taxes and firm value for companies headquartered in areas of average inequality. In other words, paying more corporate taxes lowers firm value. That’s in line with previous research and traditional economic theory.

However, we found that when local income inequality rises above the average, the relationship between corporate taxes and firm value flips. This flip suggests that some companies actually receive a financial benefit from paying corporate taxes.

Why? We found that these companies enjoy a reputational benefit for being socially responsible taxpayers. Indeed, our results were driven by businesses that are are otherwise widely viewed as good corporate citizens. For those companies, paying taxes represents one of many socially responsible behaviors.

Why it matters

Our research offers evidence that investors view corporate taxes positively when they’re consistent with other socially responsible behaviors. Given that corporations have a fiduciary duty to their shareholders, this finding suggests that corporate taxes can play a role in a company’s corporate social responsibility, or CSR, efforts.

Our findings also align with a 2023 KPMG survey of more than 300 chief tax officers that found more than half said they cared more about looking like good corporate citizens than reducing their tax burdens.

An extensive body of research has shown that companies’ investments in CSR activities aren’t just selfless – they’re linked with improved operational and financial outcomes. There’s evidence that businesses that prioritize CSR are better able to attract quality employees; have improved corporate reputations; and are more profitable as judged by return on assets, return on equity and return on sales.

While work on tax responsibility has lagged behind other CSR research, evidence is mounting that paying corporate taxes has positive effects. Much of this research indicates that companies that aggressively minimize tax payments and gain a reputation as “tax avoiders” face harm to their reputation – and therefore, the bottom line.

Our study dovetails this research and identifies a specific context in which investors view corporate taxes favorably. At a time of tax reform both globally and in the U.S., and as lawmakers and pundits continue to call for greater tax transparency, companies should be aware of the role of corporate tax responsibility in their overall CSR portfolio.

What’s next

Corporate tax responsibility is complex and not yet well defined. Our current research examines other circumstances that lead investors to value corporate taxes, which will help companies to quantify the value of including taxes in their CSR portfolios.

The Research Brief is a short take about interesting academic work.The Conversation

About the Author:

Erica Neuman, Assistant Professor of Accounting, University of Dayton and Curtis Farnsel, Assistant Professor of Accounting, University of Dayton

This article is republished from The Conversation under a Creative Commons license. Read the original article.


EUR/USD poised to renew two-month highs as buying momentum builds

By RoboForex Analytical Department 

The EUR/USD pair is hovering around 1.0503, extending its rally since midweek. The major currency pair has climbed to a two-month high, with market sentiment favouring further gains.

Key drivers behind EUR/USD’s rise

A decline in US Treasury bond yields has weighed on the US dollar, following a series of weaker-than-expected US economic reports and dovish remarks from Federal Reserve officials.

Austan Goolsbee, President of the Federal Reserve Bank of Chicago, stated that he does not expect the Core Personal Consumption Expenditures (PCE) index to be as concerning as the recent Consumer Price Index (CPI) data. As a key inflation measure for the Federal Reserve, the Core PCE significantly influences monetary policy expectations.

Meanwhile, St. Louis Fed President Alberto Musalem warned of stagflation risks and the potential challenges in setting future policy.

The latest US jobless claims data further raised concerns, showing an increase to 219,000 from the previous 213,000, exceeding the forecast of 214,000.

In the eurozone, the euro could see further upside if the German election outcome triggers additional short-covering in EUR/USD.

Technical analysis of EUR/USD

On the H4 chart, EUR/USD has completed a growth wave to 1.0470, forming a consolidation range around this level. The market has since broken higher, paving the way for further gains towards 1.0544. A correction towards 1.0385 may follow after reaching this level. The MACD indicator supports this scenario, with its signal line above zero and pointing upwards, indicating continued bullish momentum.

On the H1 chart, the pair executed a growth wave to 1.0470, followed by a narrow consolidation range around this level. The likelihood of an upward breakout towards 1.0520 remains high. After reaching this level, a correction to 1.0470 could occur before the growth wave resumes towards 1.0544. The Stochastic oscillator confirms this outlook, with its signal line above 80 and trending towards 20, suggesting a possible pullback before further gains.


Conclusion

EUR/USD remains in an uptrend, supported by weakening US Treasury yields and a cautious Fed outlook. If bullish momentum continues, the pair may extend gains towards 1.0544. However, a corrective move could follow before further upside. The outcome of the German election could also influence short-term price action, potentially driving additional volatility.


Disclaimer

Any forecasts contained herein are based on the author’s particular opinion. This analysis may not be treated as trading advice. RoboForex bears no responsibility for trading results based on trading recommendations and reviews contained herein.

How AI can help in the creative design process

By Tilanka Chandrasekera, Oklahoma State University 

Generative artificial intelligence tools can help design students by making hard tasks easier, cutting down on stress, and allowing the students more time to explore innovative ideas, according to new research I published with my colleagues in the International Journal of Architectural Computing.

I study how people think about design and use technology, and my research focuses on how tools such as AI can help make the design process more efficient and creative.

A student works on a design in a fashion merchandising lab.
Fashion Merchandising Labs at Oklahoma State University, CC BY-ND

Why it matters

Our study found that AI design tools didn’t just make the designs better – they also made the process easier and less stressful for students.

Imagine trying to come up with a cool idea in response to a design assignment, but it’s hard to picture it in your head. These tools step in and quickly show what your idea could look like, so you can focus on being creative instead of worrying about little details. This made it easier for students to brainstorm and come up with new ideas. The AI tools also made more design variations by introducing new and unexpected details, such as natural shapes and textures.

Turquoise love seats surrounded by lily pads. A more polished version, with green lily pads and blue water, is juxtaposed with a sketched version of the image.
A design fueled by artificial intelligence: The left image is the result of the text-to-image technology, and the image on the right is the design completed by the student.
Oklahoma State University, CC BY-ND
A rudimentary seat design sketched on pencil and paper.
A design by a student without using artificial intelligence.
Oklahoma State University, CC BY-ND

How we did our work

My colleagues and I worked with 40 design students and split them into two groups.

One group used AI to help design urban furniture, such as benches and seating for public spaces, while the other group didn’t use AI. The AI tool created pictures of the first group’s design ideas from simple text descriptions. Both groups refined their ideas by either sketching them by hand or with design software.

Next, the two groups were given a second design task. This time, neither group was allowed to use AI. We wanted to see whether the first task helped them learn how to develop a design concept.

My colleagues and I evaluated the students’ creativity on three criteria: the novelty of their ideas, the effectiveness of their designs in solving the problem, and the level of detail and completeness in their work. We also wanted to see how hard the tasks felt for them, so we measured something called cognitive load using a well-known tool called the NASA task load index. This tool checks how much mental effort and frustration the students experienced.

The group of students who used AI in the first task had an easier time in the second task, feeling less overwhelmed compared with those who didn’t use AI.

The final designs of the AI group also showed a more creative design process in the second task, likely because they learned from using AI in the first task, which helped them think and develop better ideas.

What’s next

Future research will look at how AI tools can be used in more parts of design education and how they might affect the way professionals work.

One challenge is making sure students don’t rely too much on AI, which could hurt their ability to think critically and solve problems on their own.

Another goal is to make sure as many design students as possible have access to these tools.

The Research Brief is a short take on interesting academic work.The Conversation

About the Author:

Tilanka Chandrasekera, Professor of Interior Design, Oklahoma State University

This article is republished from The Conversation under a Creative Commons license. Read the original article.


AI datasets have human values blind spots − new research

By Ike Obi, Purdue University 

My colleagues and I at Purdue University have uncovered a significant imbalance in the human values embedded in AI systems. The systems were predominantly oriented toward information and utility values and less toward prosocial, well-being and civic values.

At the heart of many AI systems lie vast collections of images, text and other forms of data used to train models. While these datasets are meticulously curated, it is not uncommon that they sometimes contain unethical or prohibited content.

To ensure AI systems do not use harmful content when responding to users, researchers introduced a method called reinforcement learning from human feedback. Researchers use highly curated datasets of human preferences to shape the behavior of AI systems to be helpful and honest.

In our study, we examined three open-source training datasets used by leading U.S. AI companies. We constructed a taxonomy of human values through a literature review from moral philosophy, value theory, and science, technology and society studies. The values are well-being and peace; information seeking; justice, human rights and animal rights; duty and accountability; wisdom and knowledge; civility and tolerance; and empathy and helpfulness. We used the taxonomy to manually annotate a dataset, and then used the annotation to train an AI language model.

Our model allowed us to examine the AI companies’ datasets. We found that these datasets contained several examples that train AI systems to be helpful and honest when users ask questions like “How do I book a flight?” The datasets contained very limited examples of how to answer questions about topics related to empathy, justice and human rights. Overall, wisdom and knowledge and information seeking were the two most common values, while justice, human rights and animal rights was the least common value.

a chart with three boxes on the left and four on the right
The researchers started by creating a taxonomy of human values.
Obi et al, CC BY-ND

Why it matters

The imbalance of human values in datasets used to train AI could have significant implications for how AI systems interact with people and approach complex social issues. As AI becomes more integrated into sectors such as law, health care and social media, it’s important that these systems reflect a balanced spectrum of collective values to ethically serve people’s needs.

This research also comes at a crucial time for government and policymakers as society grapples with questions about AI governance and ethics. Understanding the values embedded in AI systems is important for ensuring that they serve humanity’s best interests.

What other research is being done

Many researchers are working to align AI systems with human values. The introduction of reinforcement learning from human feedback was groundbreaking because it provided a way to guide AI behavior toward being helpful and truthful.

Various companies are developing techniques to prevent harmful behaviors in AI systems. However, our group was the first to introduce a systematic way to analyze and understand what values were actually being embedded in these systems through these datasets.

What’s next

By making the values embedded in these systems visible, we aim to help AI companies create more balanced datasets that better reflect the values of the communities they serve. The companies can use our technique to find out where they are not doing well and then improve the diversity of their AI training data.

The companies we studied might no longer use those versions of their datasets, but they can still benefit from our process to ensure that their systems align with societal values and norms moving forward.The Conversation

About the Author:

Ike Obi, Ph.D. student in Computer and Information Technology, Purdue University

This article is republished from The Conversation under a Creative Commons license. Read the original article.

5 Large Cap Stocks are latest to be added to Watchlist in Q1 2025

By InvestMacro Research

The first quarter of 2025 is underway and we wanted to highlight some of the top companies that have been added to our Cosmic Rays Watchlist in the past week. The Cosmic Rays Watchlist is the output from our proprietary fundamental analysis algorithm.

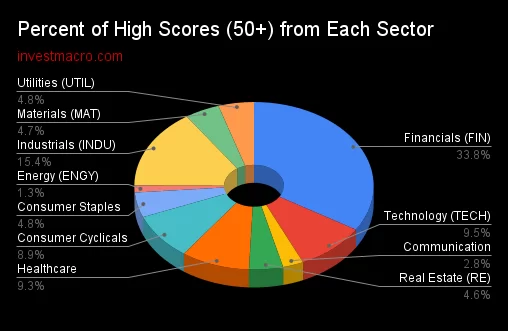
The algo examines company fundamental metrics, earnings trends and overall sector strength trends. The aim is identify quality dividend-paying companies on the NYSE and Nasdaq stock exchanges. If a company scores over 50, it gets added to our Watchlist for further analysis.

We use this system as a stock market ideas generator and to update our Watchlist every quarter. However, be aware the fundamental system does not take the stock price as a direct element in our rating so one must compare each idea with their current stock prices (this is not a timing tool).

Many studies are consistently showing overvalued markets and that has to be taken into consideration with any stock market idea.

As with all investment ideas, past performance does not guarantee future results. A stock added to our list is not a recommendation to buy or sell the security.

Here we go with 5 of our Top Stocks scored in Q1 2025:


The Hartford Financial Services Group, Inc. (HIG):

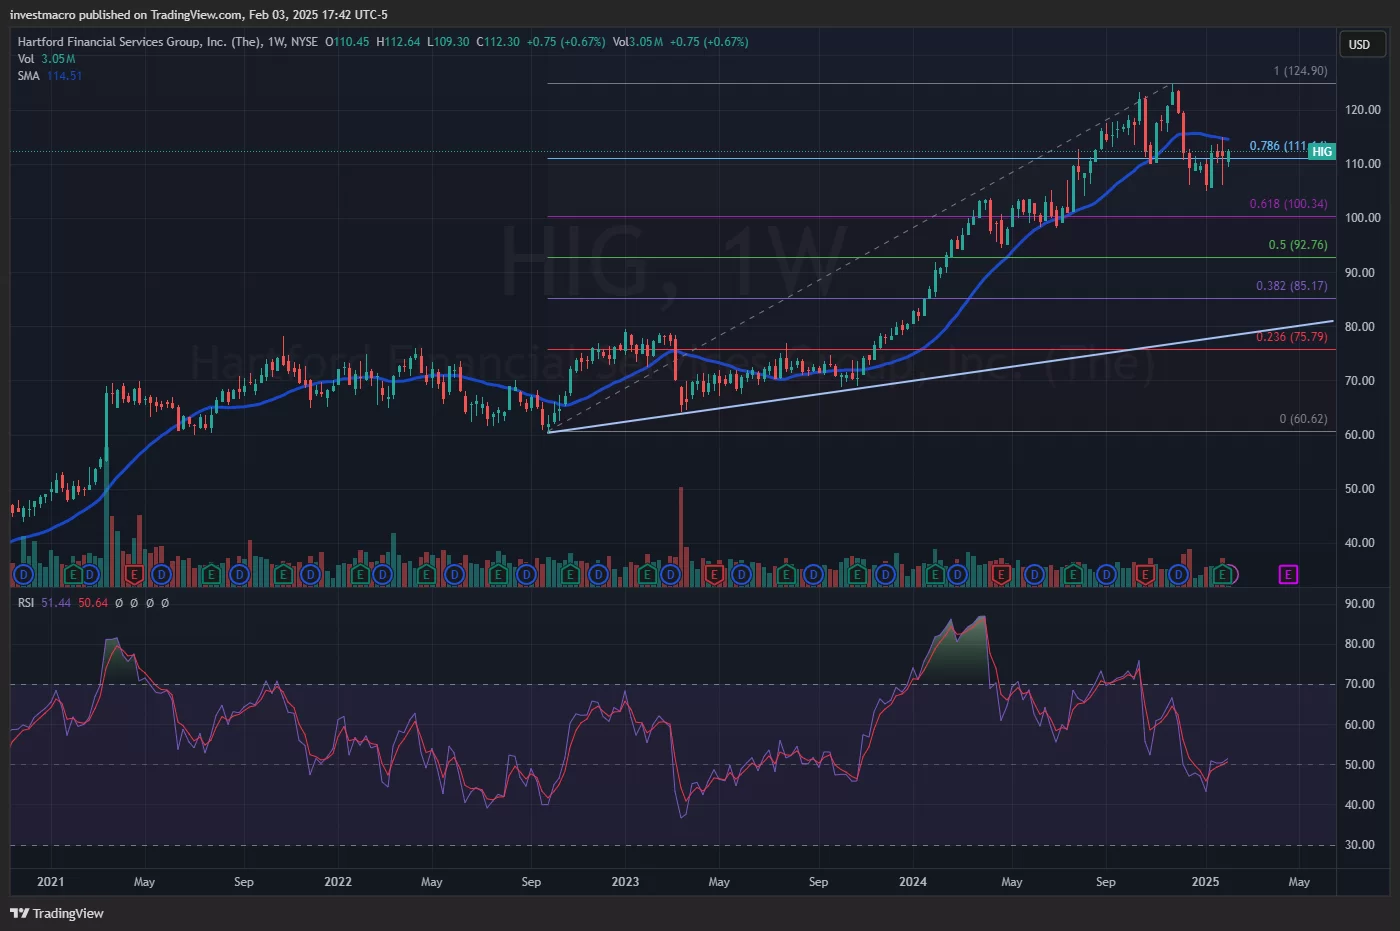
The Hartford Financial Services Group, Inc. (Symbol: HIG) was recently added to our Cosmic Rays WatchList. HIG scored a 66 in our fundamental rating system on February 3rd.

At time of writing, only 4.67% of stocks have scored a 60 or better out of a total of 11,112 scores in our earnings database. HIG has been a staple on our list, making the Watchlist a total of 7 times and the company’s score rose by 1 point from our last update. HIG is a Large Cap stock and part of the Financial Services sector. The industry focus for HIG is Insurance – Diversified.

HIG has beat earnings-per-share expectations two out of the past three quarters and has a dividend of close to 1.85 percent with a payout ratio near 20 percent. The HIG stock price has slightly under-performed the Financial Sector benchmark over the past 52 weeks with a 27.61 percent rise compared to the 31.35 benchmark return.

Company Description (courtesy of SEC.gov):

The Hartford Financial Services Group, Inc. provides insurance and financial services to individual and business customers in the United States, the United Kingdom, and internationally.

Company Website: https://www.thehartford.com


Asset vs Sector Benchmark:*P/E Ratio (TTM)*52-Week Price Return*Beta (S&P500)
– Stock: The Hartford Financial Services Group, Inc. (HIG)10.927.610.94
– Benchmark Symbol: XLF18.131.351.0


* Data through February 03, 2025


Northrop Grumman Corporation (NOC):

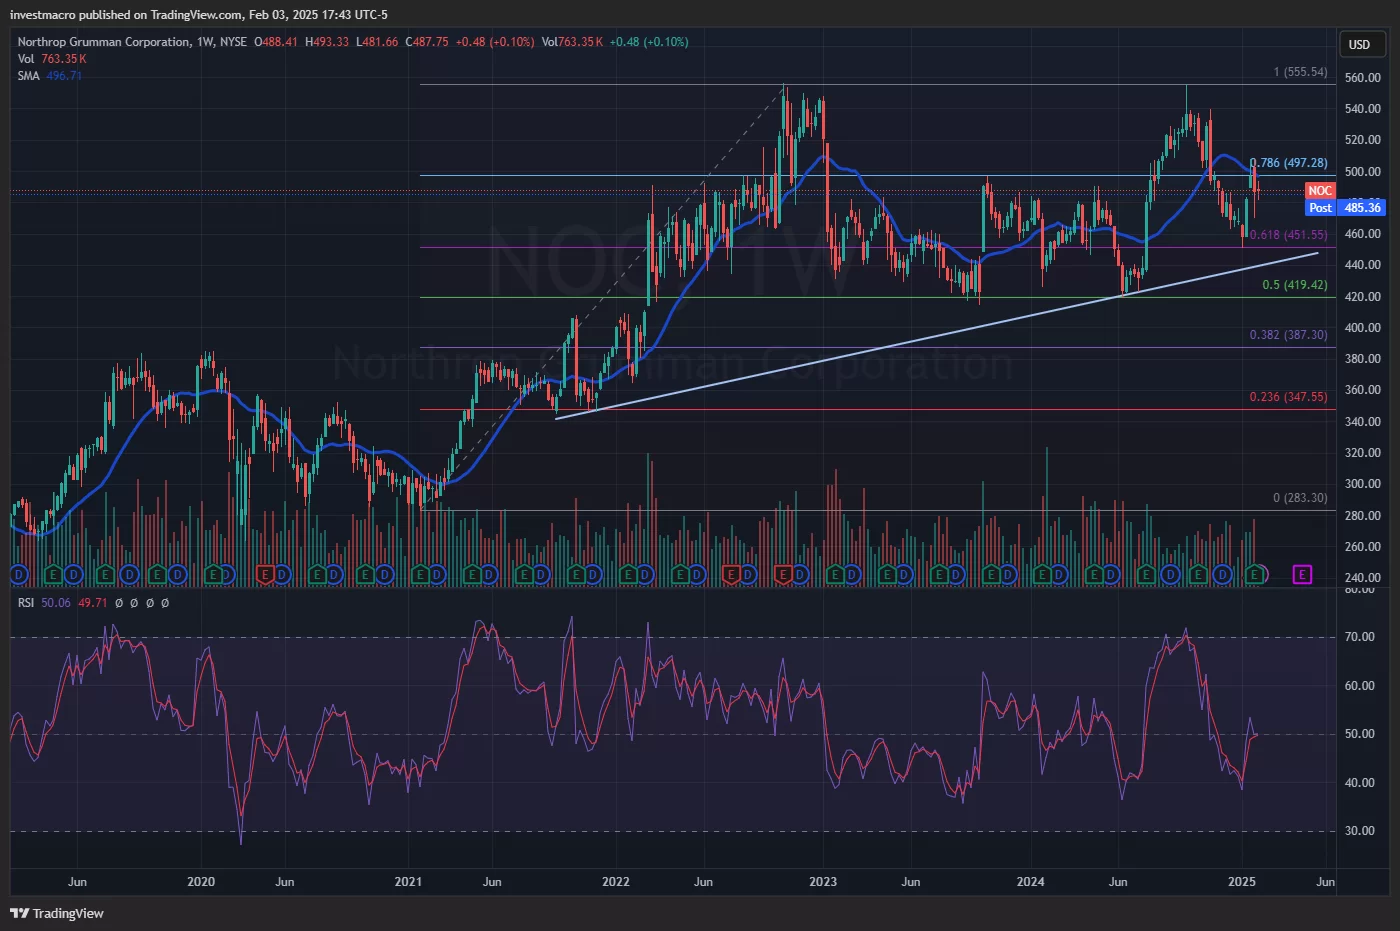
Northrop Grumman Corporation (Symbol: NOC) was recently added to our Cosmic Rays WatchList. NOC scored a 58 in our fundamental rating system on February 3rd.

At time of writing, only 8.03% of stocks have scored a 50 or better out of a total of 11,112 scores in our earnings database. This stock has made our Watchlist a total of 2 times and jumped by 113 system points from our last update. NOC is a Large Cap stock and part of the Industrials sector. The industry focus for NOC is Aerospace & Defense.

NOC has beat the earnings-per-share expectations in the past four quarters. Northrop’s dividend is currently at 1.68 percent and has a payout ratio around 30 percent at time of writing. The stock price has under-performed the Industrials Sector benchmark over the past 52 weeks with a 11.27 percent gain compared to the 21.27 benchmark return.

Company Description (courtesy of SEC.gov):

Northrop Grumman Corporation operates as an aerospace and defense company worldwide. The company’s Aeronautics Systems segment designs, develops, manufactures, integrates, and sustains aircraft systems.

Company Website: https://www.northropgrumman.com


Asset vs Sector Benchmark:*P/E Ratio (TTM)*52-Week Price Return*Beta (S&P500)
– Stock: Northrop Grumman Corporation (NOC)17.211.270.35
– Benchmark Symbol: XLI26.121.271.1


* Data through February 03, 2025


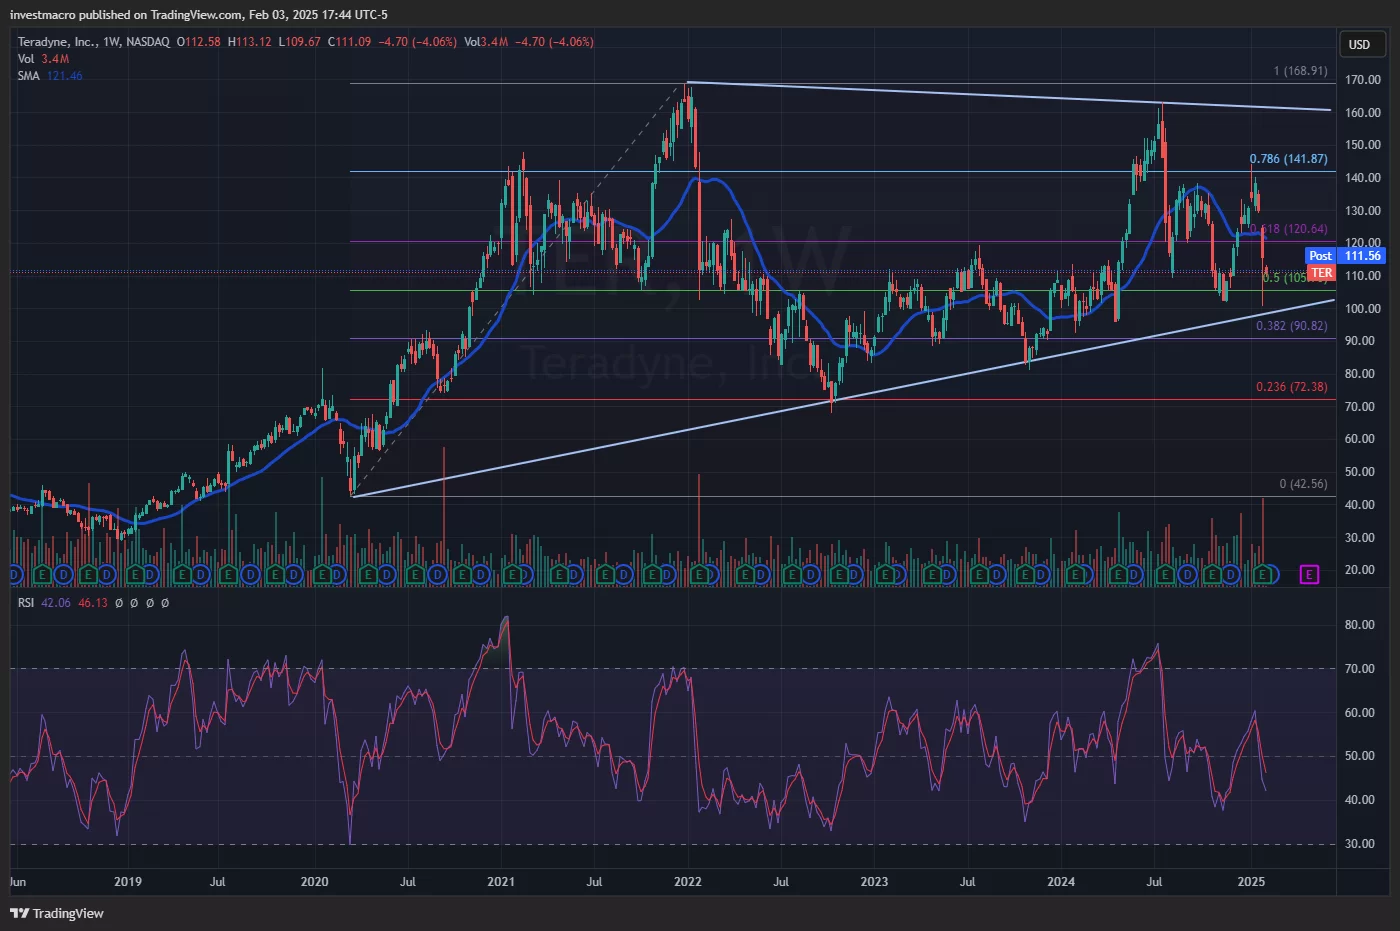
Teradyne, Inc. (TER):

Teradyne, Inc. (Symbol: TER) was recently added to our Cosmic Rays WatchList. TER scored a 50 in our fundamental rating system on January 31st.

At time of writing, only 8.03% of stocks have scored a 50 or better out of a total of 11,112 scores in our earnings database. This stock has never been on our Watchlist previously and rose by 76 system points from our last update. TER is a Large Cap stock and part of the Technology sector. The industry focus for TER is Semiconductors.

Teradyne has beat the earnings-per-share expectations in each of the past four quarters. TER’s dividend is currently a modest 0.43 percent and has a payout ratio of around just 14 percent at time of writing. The stock price has under-performed the Technology Sector benchmark over the past 52 weeks with a 10.71 percent gain compared to the 14.25 benchmark return.

Company Description (courtesy of SEC.gov):

Teradyne, Inc. designs, develops, manufactures, sells, and supports automatic test equipment worldwide. The company operates through Semiconductor Test, System Test, Industrial Automation, and Wireless Test segments.

Company Website: https://www.teradyne.com


Asset vs Sector Benchmark:*P/E Ratio (TTM)*52-Week Price Return*Beta (S&P500)
– Stock: Teradyne, Inc. (TER)33.510.711.52
– Benchmark Symbol: XLK36.914.251.2


* Data through February 03, 2025


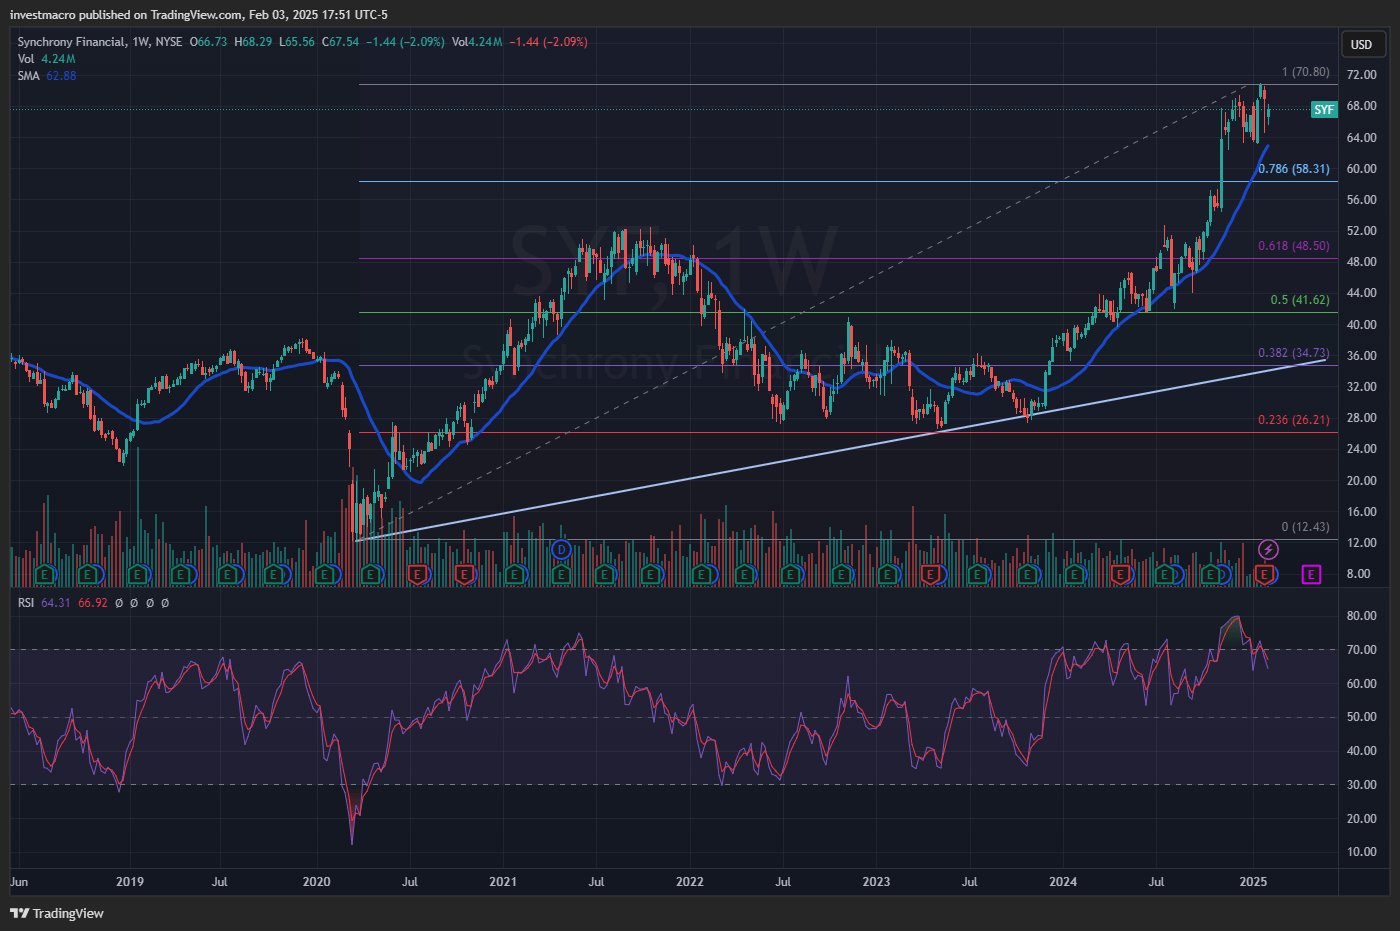
Synchrony Financial (SYF):

Synchrony Financial (Symbol: SYF) was recently added to our Cosmic Rays WatchList. SYF scored a 68 in our fundamental rating system on January 30th.

At time of writing, only 4.67% of stocks have scored a 60 or better out of a total of 11,112 scores in our earnings database. This stock has been on our Watchlist a total of 7 times and rose by 6 system points from our last update. SYF is a Large Cap stock and part of the Financial Services sector. The industry focus for SYF is Financial – Credit Services.

SYF missed their earnings-per-share expectations this quarter after beating expectations in the previous three quarters. Synchrony’s dividend is currently at approximately 1.50 percent and has a payout ratio of around just 12 percent at time of writing. The stock price has outperformed the Financial Sector benchmark over the past 52 weeks with a whopping 74.13 percent gain compared to the 31.35 percent benchmark return. SYF is currently trading near the top of its range with a recent overbought level on the weekly relative strength index (RSI).

Company Description (courtesy of SEC.gov):

Synchrony Financial, together with its subsidiaries, operates as a consumer financial services company in the United States. It provides credit products, such as credit cards, commercial credit products, and consumer installment loans.

Company Website: https://www.synchrony.com


Asset vs Sector Benchmark:*P/E Ratio (TTM)*52-Week Price Return*Beta (S&P500)
– Stock: Synchrony Financial (SYF)7.974.131.59
– Benchmark Symbol: XLF18.131.351.0


* Data through February 03, 2025


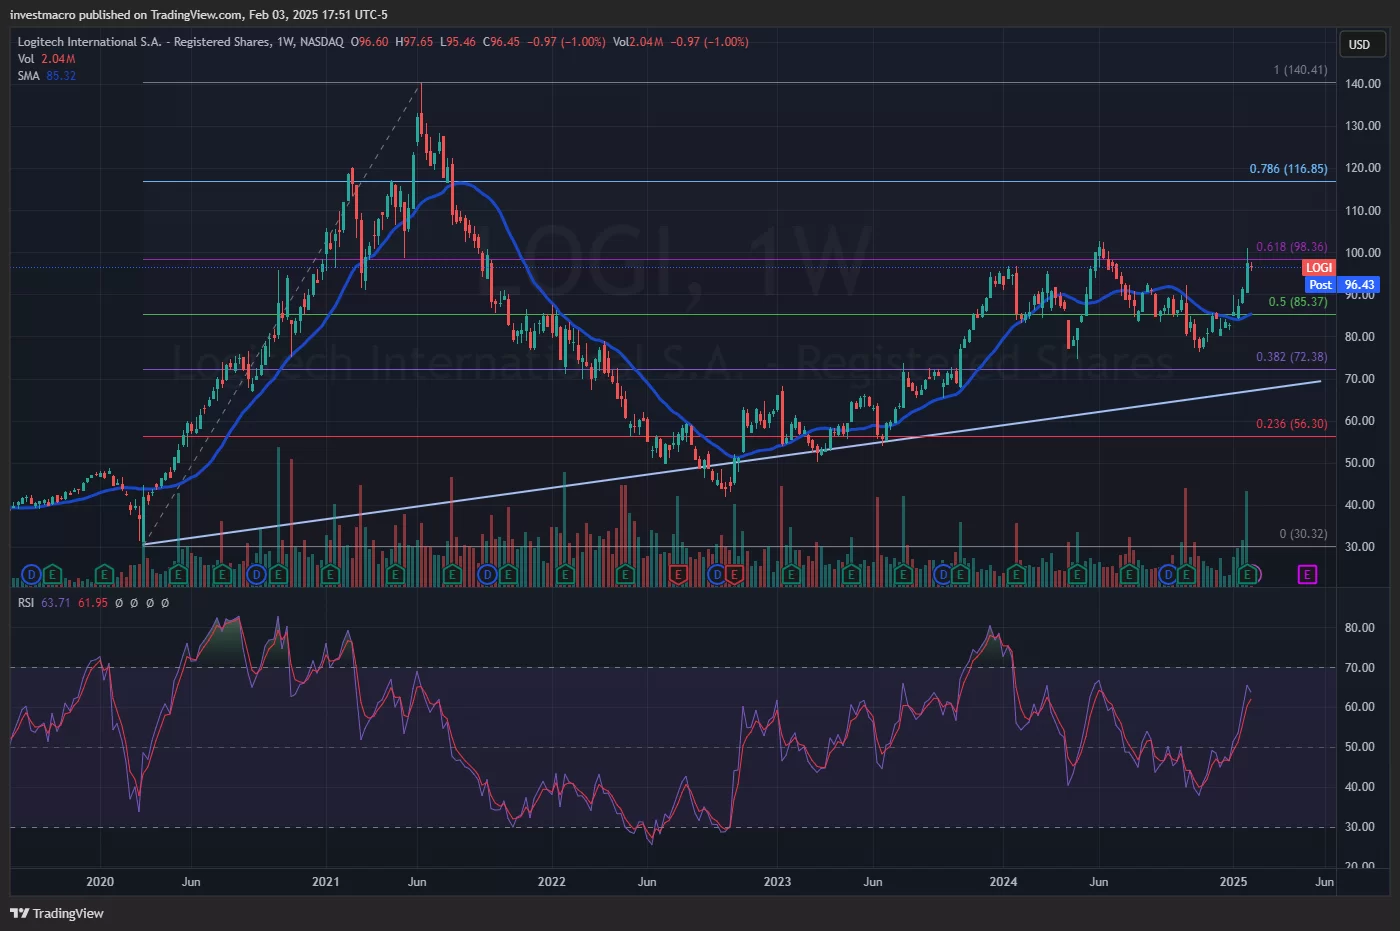
Logitech International S.A. (LOGI):

Logitech International S.A. (Symbol: LOGI) was recently added to our Cosmic Rays WatchList. LOGI scored a 65 in our fundamental rating system on January 30th.

At time of writing, only 4.67% of stocks have scored a 60 or better out of a total of 11,112 scores in our earnings database. This stock has made our Watchlist a total of 3 times and rose by 48 system points from our last update. LOGI is a Large Cap stock and part of the Technology sector. The industry focus for LOGI is Computer Hardware.

Logitech has beaten the earnings-per-share expectations for each of the past four quarters and has a dividend of close to 1.40 percent with a payout ratio currently near 28 percent. The LOGI stock price has ever-so-slightly outperformed the Technology Sector benchmark over the past 52 weeks with a 15.37 percent rise compared to the 14.25 percent benchmark return.

Company Description (courtesy of SEC.gov):

Logitech International S.A., through its subsidiaries, designs, manufactures, and markets products that connect people to digital and cloud experiences worldwide. The company offers pointing devices, such as wireless mouse; corded and cordless keyboards, living room keyboards, and keyboard-and-mouse combinations; PC webcams; and keyboards for tablets and smartphones, as well as other accessories for mobile devices.

Company Website: https://www.logitech.com


Asset vs Sector Benchmark:*P/E Ratio (TTM)*52-Week Price Return*Beta (S&P500)
– Stock: Logitech International S.A. (LOGI)22.715.370.56
– Benchmark Symbol: XLK36.914.251.2


* Data through February 03, 2025


By InvestMacro – Be sure to join our stock market newsletter to get our updates and to see more top companies we add to our stock watch list.

All information, stock ideas and opinions on this website are for general informational purposes only and do not constitute investment advice. Stock scores are a data driven process through company fundamentals and are not a recommendation to buy or sell a security. Company descriptions provided by sec.gov.

AI gives nonprogrammers a boost in writing computer code

By Leo Porter, University of California, San Diego and Daniel Zingaro, University of Toronto 

What do you think there are more of: professional computer programmers or computer users who do a little programming?

It’s the second group. There are millions of so-called end-user programmers. They’re not going into a career as a professional programmer or computer scientist. They’re going into business, teaching, law, or any number of professions – and they just need a little programming to be more efficient. The days of programmers being confined to software development companies are long gone.

If you’ve written formulas in Excel, filtered your email based on rules, modded a game, written a script in Photoshop, used R to analyze some data, or automated a repetitive work process, you’re an end-user programmer.

As educators who teach programming, we want to help students in fields other than computer science achieve their goals. But learning how to program well enough to write finished programs can be hard to accomplish in a single course because there is so much to learn about the programming language itself. Artificial intelligence can help.

Lost in the weeds

Learning the syntax of a programming language – for example, where to place colons and where indentation is required – takes a lot of time for many students. Spending time at the level of syntax is a waste for students who simply want to use coding to help solve problems rather than learn the skill of programming.

As a result, we feel our existing classes haven’t served these students well. Indeed, many students end up barely able to write small functions – short, discrete pieces of code – let alone write a full program that can help make their lives better.

Tools built on large language models such as GitHub Copilot may allow us to change these outcomes. These tools have already changed how professionals program, and we believe we can use them to help future end-user programmers write software that is meaningful to them.

These AIs almost always write syntactically correct code and can often write small functions based on prompts in plain English. Because students can use these tools to handle some of the lower-level details of programming, it frees them to focus on bigger-picture questions that are at the heart of writing software programs. Numerous universities now offer programming courses that use Copilot.

At the University of California, San Diego, we’ve created an introductory programming course primarily for those who are not computer science students that incorporates Copilot. In this course, students learn how to program with Copilot as their AI assistant, following the curriculum from our book. In our course, students learn high-level skills such as decomposing large tasks into smaller tasks, testing code to ensure its correctness, and reading and fixing buggy code.

Freed to solve problems

In this course, we’ve been giving students large, open-ended projects and couldn’t be happier with what they have created.

For example, in a project where students had to find and analyze online datasets, we had a neuroscience major create a data visualization tool that illustrated how age and other factors affected stroke risk. Or, for example, in another project, students were able to integrate their personal art into a collage, after applying filters that they had created using the programming language Python. These projects were well beyond the scope of what we could ask students to do before the advent of large language model AIs.

Given the rhetoric about how AI is ruining education by writing papers for students and doing their homework, you might be surprised to hear educators like us talking about its benefits. AI, like any other tool people have created, can be helpful in some circumstances and unhelpful in others.

In our introductory programming course with a majority of students who are not computer science majors, we see firsthand how AI can empower students in specific ways – and promises to expand the ranks of end-user programmers.The Conversation

About the Author:

Leo Porter, Teaching Professor of Computer Science and Engineering, University of California, San Diego and Daniel Zingaro, Associate Professor of Mathematical and Computational Sciences, University of Toronto

This article is republished from The Conversation under a Creative Commons license. Read the original article.


US Dollar Speculator bets continue to shine vs major currencies

By InvestMacro

Here are the latest charts and statistics for the Commitment of Traders (COT) data published by the Commodities Futures Trading Commission (CFTC).

The latest COT data is updated through Tuesday January 28th and shows a quick view of how large market participants (for-profit speculators and commercial traders) were positioned in the futures markets. All currency positions are in direct relation to the US dollar where, for example, a bet for the euro is a bet that the euro will rise versus the dollar while a bet against the euro will be a bet that the euro will decline versus the dollar.

Weekly Speculator Bets led by Japanese Yen & Mexican Peso
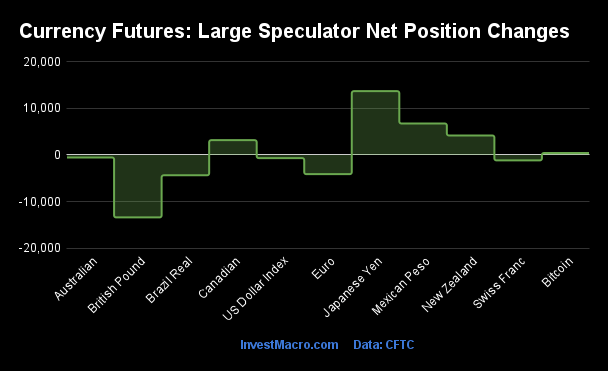
The COT currency market speculator bets were overall lower this week as five out of the eleven currency markets we cover had higher positioning while the other six markets had lower speculator contracts.

Leading the gains for the currency markets was the Japanese Yen (13,714 contracts), the Mexican Peso (6,768 contracts), the New Zealand Dollar (4,192 contracts), the Canadian Dollar (3,186 contracts) and with Bitcoin (426 contracts) also showing positive weeks.

The currencies seeing declines in speculator bets on the week were the British Pound (-13,415 contracts), the EuroFX (-4,118 contracts), the Brazilian Real (-4,363 contracts), the Swiss Franc (-1,163 contracts), the US Dollar Index (-672 contracts) and the Australian Dollar (-535 contracts) also registering lower bets on the week.

US Dollar Speculator bets continue to shine vs major currencies

Highlighting the COT currency’s data this week is current positioning for the US Dollar against the major currencies. Despite a small dip in the US Dollar Index positioning this week, the other major currencies are overwhelmingly in negative or bearish net positions versus the US Dollar. All major currency positions in the COT markets are in direct relation to the US Dollar and, currently, eight out of the nine foreign currency levels are in bearish territory.

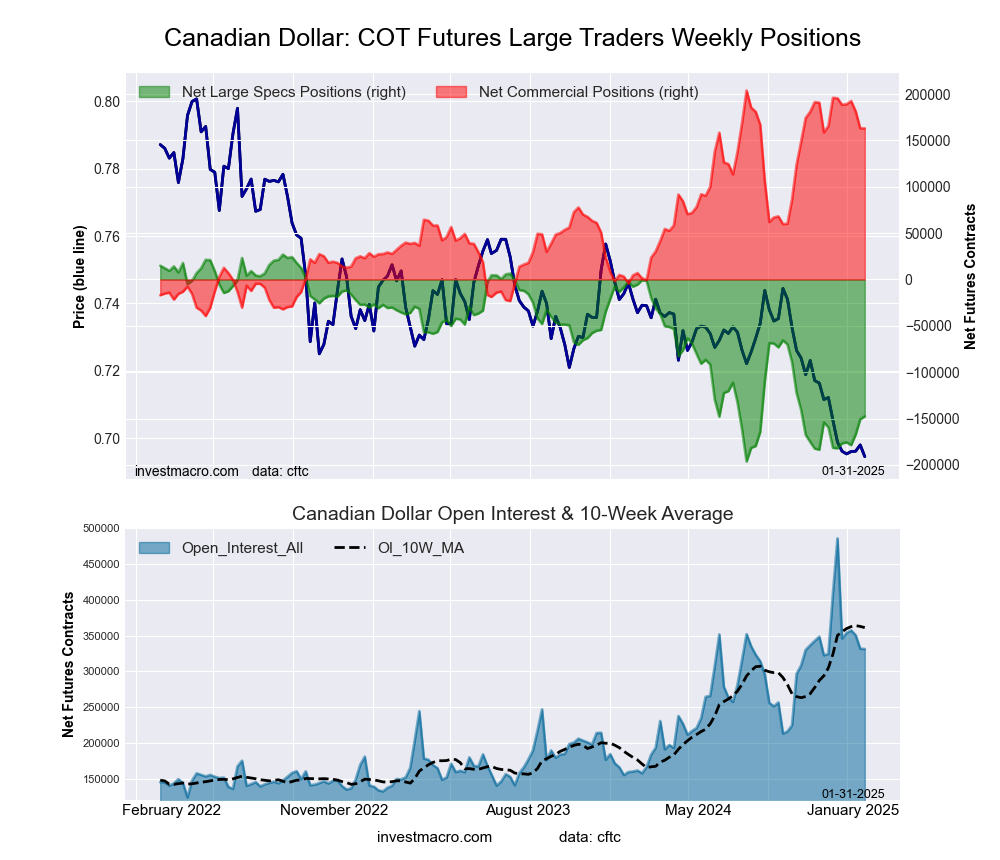
The most bearish position at the moment is the Canadian dollar at a total of -147,601 contracts. The CAD position has been over the -100,000 contract threshold for sixteen straight weeks and in twenty-eight out of the past thirty-four weeks. Overall, the CAD positioning has been in a continuous bearish level for seventy-eight straight weeks. The Canadian dollar exchange rate versus the Dollar has been falling sharply is currently at the lowest level since March of 2020 at the 0.6905 price.

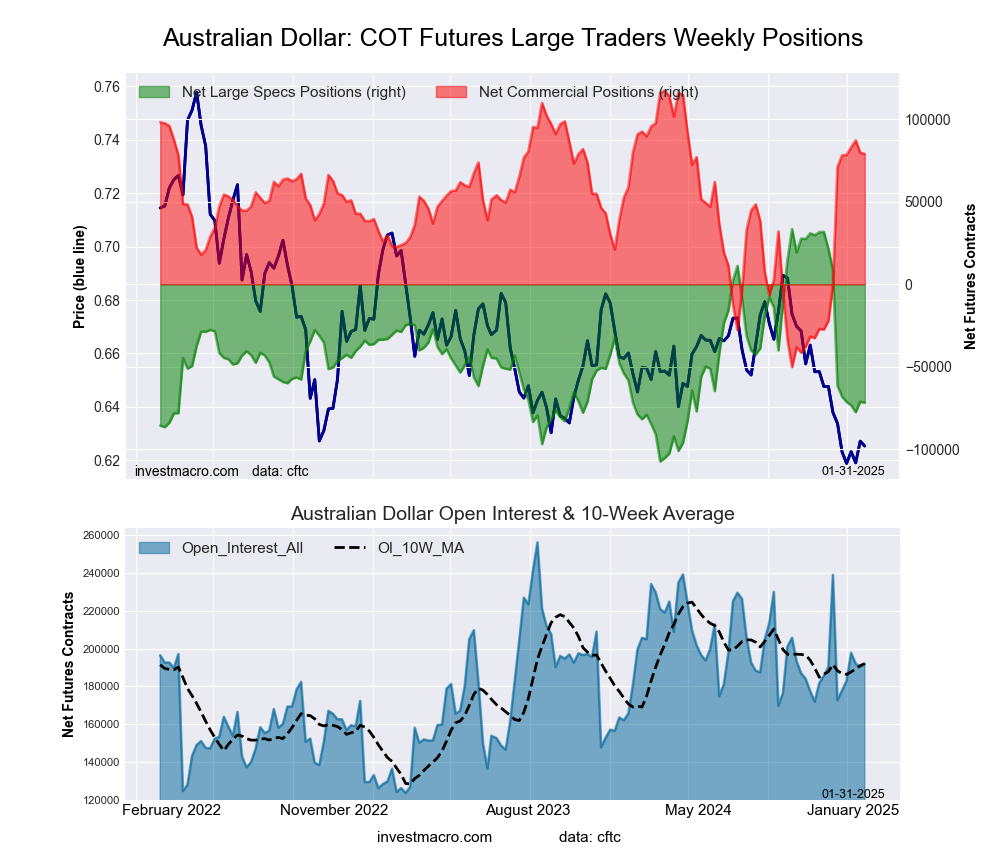
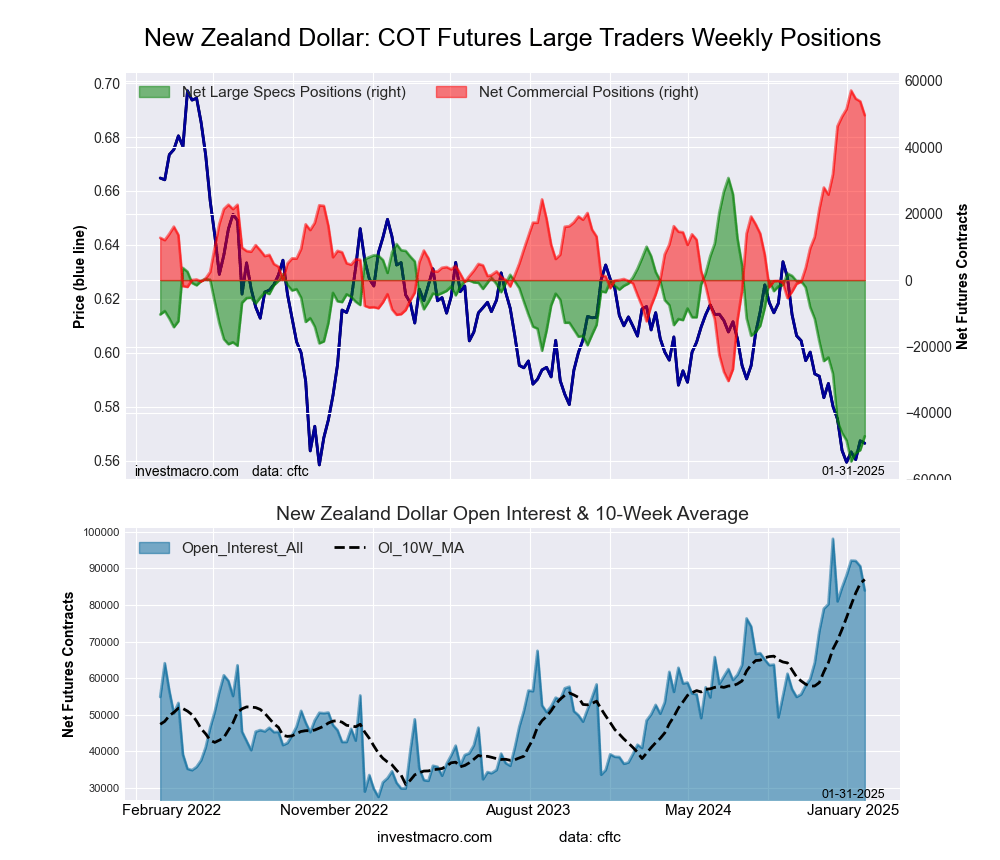
The Australian dollar, New Zealand dollar, Swiss franc, Brazilian real and the Euro positions are all between -38,000 and -71,000 net speculator contracts this week. All of these currencies are in extreme bearish readings in the speculator strength scores which compares their current level to the past three years. The exchange rates for these currencies have all been in multi-year low-points as well over the past month except for the Swiss franc which has been trading around its 200-week moving average and the lowest level since May 2024.

The British pound sterling is not quite in an extreme bearish level but does remain in an overall bearish net standing at -21,672 contracts. The GBP exchange rate versus the Dollar is right under the 1.2400 threshold currently and recently touched the lowest level since 2023 near the 1.2100 exchange.

The Japanese yen which has seen its exchange rate at multi-decade lows for the past couple of years but is faring better than most of the other major currencies in speculator positioning. The JPY speculator bets are just at -959 contracts this week. The exchange rate does remain near the bottom of the range of the multi-decade lows but the speculator sentiment has come off the extremely negative levels from the past couple of years and has been helped out by the Bank of Japan’s latest monetary move of an interest rate increase.

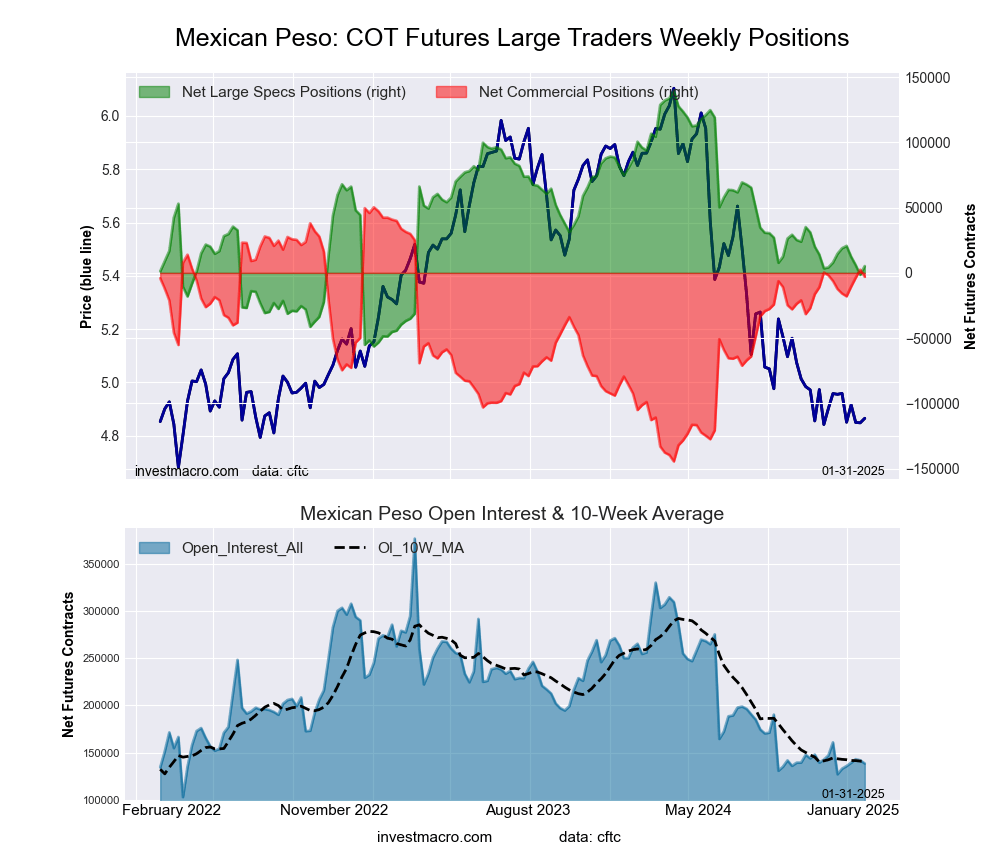
The only major currency with a bullish speculator position this week versus the Dollar is the Mexican peso. The peso has been the one currency with strong speculator positions over the past few years with positive or bullish levels dating back to March of 2023. Last week, on January 21st, the position dipped into a small bearish level but bounced back this week into a small bullish standing. The exchange rate for the peso has been on the decline from last summer and has fallen to the lowest levels since 2022 at the 0.4801 exchange rate price.


Currencies Net Speculators Leaderboard
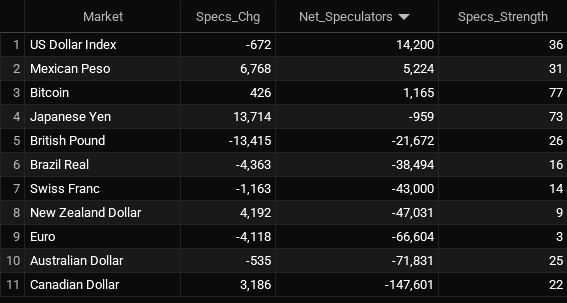
Legend: Weekly Speculators Change | Speculators Current Net Position | Speculators Strength Score compared to last 3-Years (0-100 range)


Strength Scores led by Bitcoin & Japanese Yen
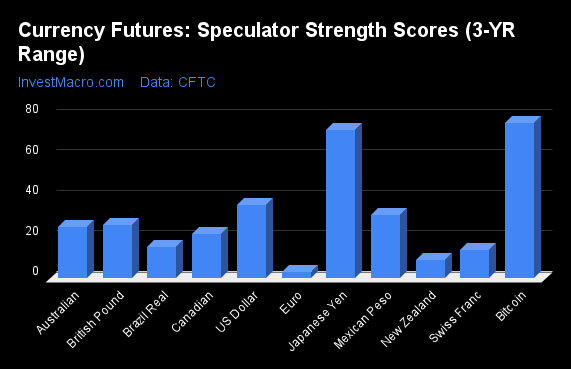
COT Strength Scores (a normalized measure of Speculator positions over a 3-Year range, from 0 to 100 where above 80 is Extreme-Bullish and below 20 is Extreme-Bearish) showed that Bitcoin (77 percent) and the Japanese Yen (73 percent) lead the currency markets this week.

On the downside, the EuroFX (3 percent), the New Zealand Dollar (9 percent), the Swiss Franc (14 percent) and the Brazilian Real (16 percent) come in at the lowest strength levels currently and are in Extreme-Bearish territory (below 20 percent).

3-Year Strength Statistics:
US Dollar Index (36.1 percent) vs US Dollar Index previous week (37.5 percent)
EuroFX (3.4 percent) vs EuroFX previous week (5.0 percent)
British Pound Sterling (26.4 percent) vs British Pound Sterling previous week (32.4 percent)
Japanese Yen (73.2 percent) vs Japanese Yen previous week (67.8 percent)
Swiss Franc (13.8 percent) vs Swiss Franc previous week (16.1 percent)
Canadian Dollar (21.8 percent) vs Canadian Dollar previous week (20.4 percent)
Australian Dollar (25.3 percent) vs Australian Dollar previous week (25.7 percent)
New Zealand Dollar (8.9 percent) vs New Zealand Dollar previous week (4.0 percent)
Mexican Peso (31.4 percent) vs Mexican Peso previous week (28.0 percent)
Brazilian Real (15.6 percent) vs Brazilian Real previous week (19.7 percent)
Bitcoin (76.7 percent) vs Bitcoin previous week (67.4 percent)


Bitcoin & US Dollar Index top the 6-Week Strength Trends
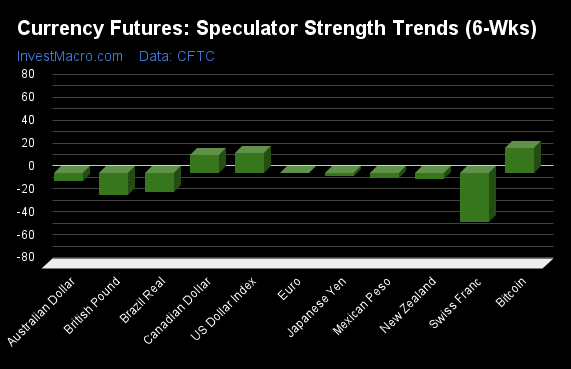
COT Strength Score Trends (or move index, calculates the 6-week changes in strength scores) showed that the Bitcoin (22 percent) and the US Dollar Index (18 percent) lead the past six weeks trends for the currencies. The Canadian Dollar (15 percent) is the next highest positive mover in the 3-Year trends data.

The Swiss Franc (-43 percent) leads the downside trend scores currently with the British Pound (-20 percent), Brazilian Real (-17 percent) and the Australian Dollar (-7 percent) following next with lower trend scores.

3-Year Strength Trends:
US Dollar Index (17.7 percent) vs US Dollar Index previous week (37.5 percent)
EuroFX (-0.3 percent) vs EuroFX previous week (5.0 percent)
British Pound Sterling (-19.5 percent) vs British Pound Sterling previous week (-15.9 percent)
Japanese Yen (-2.8 percent) vs Japanese Yen previous week (-16.2 percent)
Swiss Franc (-43.0 percent) vs Swiss Franc previous week (-13.9 percent)
Canadian Dollar (15.4 percent) vs Canadian Dollar previous week (13.8 percent)
Australian Dollar (-7.3 percent) vs Australian Dollar previous week (-56.6 percent)
New Zealand Dollar (-5.3 percent) vs New Zealand Dollar previous week (-27.0 percent)
Mexican Peso (-4.8 percent) vs Mexican Peso previous week (-4.8 percent)
Brazilian Real (-16.7 percent) vs Brazilian Real previous week (-16.8 percent)
Bitcoin (21.7 percent) vs Bitcoin previous week (31.8 percent)


Individual COT Forex Markets:

US Dollar Index Futures:
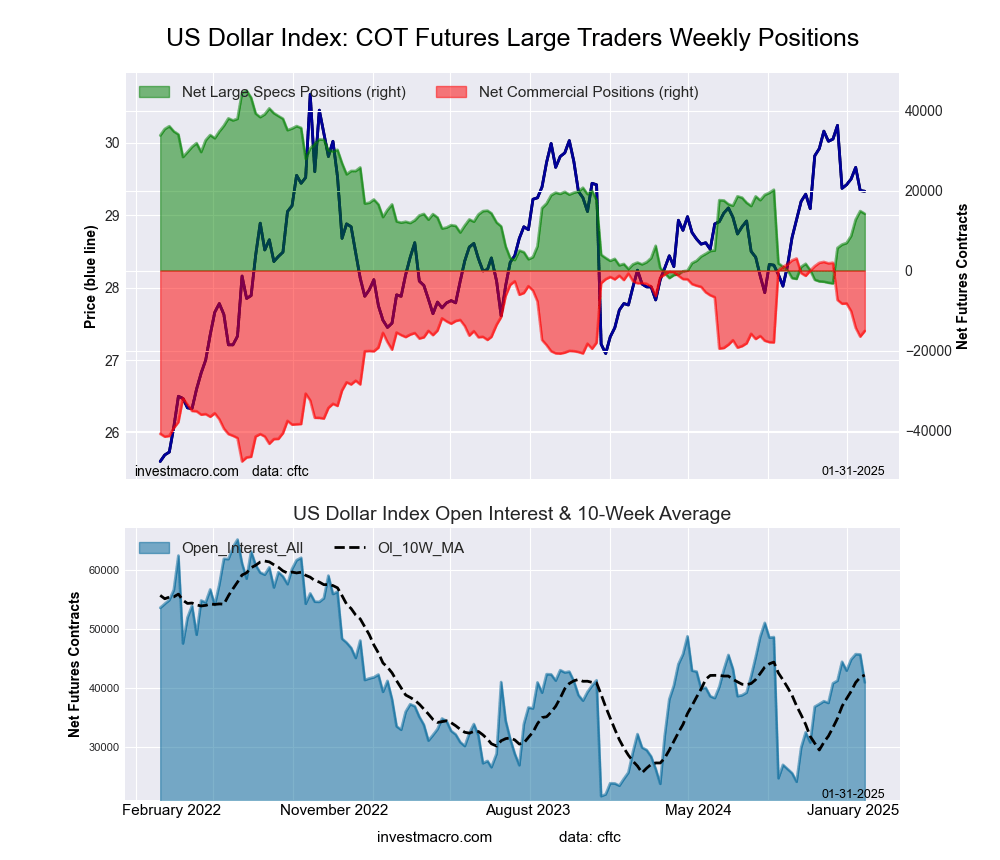
US Dollar Index Forex Futures COT ChartThe US Dollar Index large speculator standing this week was a net position of 14,200 contracts in the data reported through Tuesday. This was a weekly fall of -672 contracts from the previous week which had a total of 14,872 net contracts.

This week’s current strength score (the trader positioning range over the past three years, measured from 0 to 100) shows the speculators are currently Bearish with a score of 36.1 percent. The commercials are Bullish with a score of 64.3 percent and the small traders (not shown in chart) are Bearish with a score of 33.8 percent.

Price Trend-Following Model: Uptrend

Our weekly trend-following model classifies the current market price position as: Uptrend.

US DOLLAR INDEX StatisticsSPECULATORSCOMMERCIALSSMALL TRADERS
– Percent of Open Interest Longs:61.925.69.5
– Percent of Open Interest Shorts:27.362.47.3
– Net Position:14,200-15,106906
– Gross Longs:25,37210,4843,888
– Gross Shorts:11,17225,5902,982
– Long to Short Ratio:2.3 to 10.4 to 11.3 to 1
NET POSITION TREND:
– Strength Index Score (3 Year Range Pct):36.164.333.8
– Strength Index Reading (3 Year Range):BearishBullishBearish
NET POSITION MOVEMENT INDEX:
– 6-Week Change in Strength Index:17.7-15.3-8.6


Euro Currency Futures:

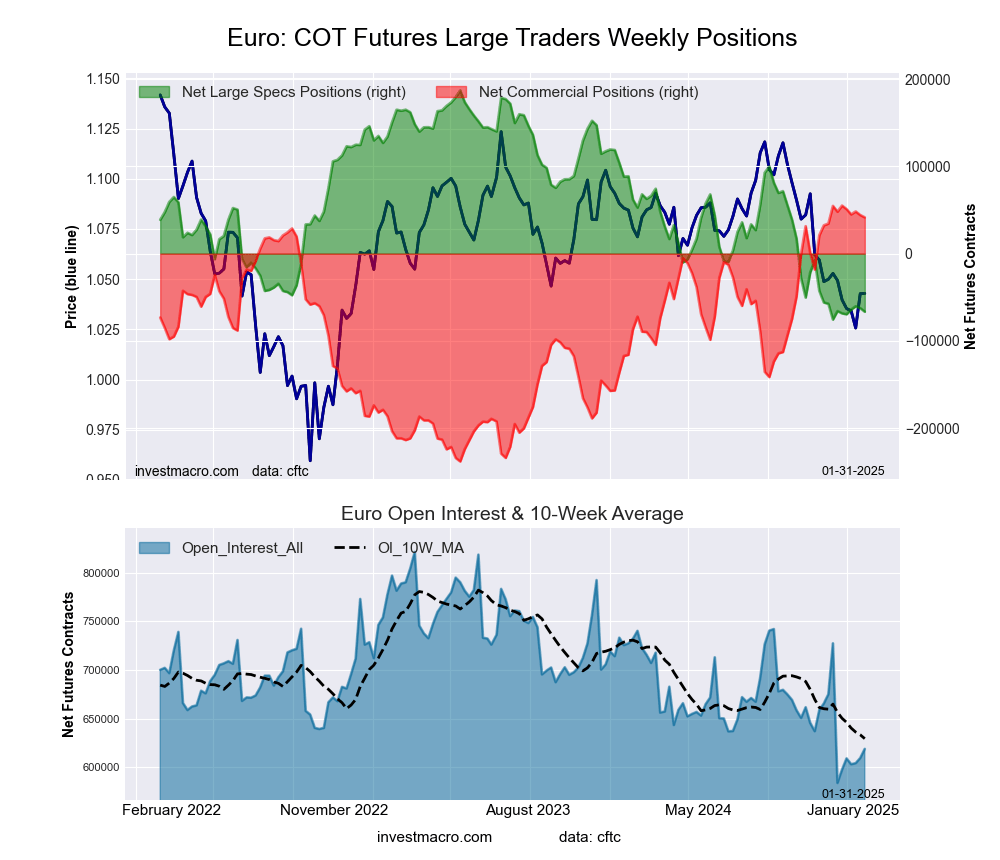
Euro Currency Futures COT ChartThe Euro Currency large speculator standing this week was a net position of -66,604 contracts in the data reported through Tuesday. This was a weekly lowering of -4,118 contracts from the previous week which had a total of -62,486 net contracts.

This week’s current strength score (the trader positioning range over the past three years, measured from 0 to 100) shows the speculators are currently Bearish-Extreme with a score of 3.4 percent. The commercials are Bullish-Extreme with a score of 95.4 percent and the small traders (not shown in chart) are Bearish with a score of 28.8 percent.

Price Trend-Following Model: Downtrend

Our weekly trend-following model classifies the current market price position as: Downtrend.

EURO Currency StatisticsSPECULATORSCOMMERCIALSSMALL TRADERS
– Percent of Open Interest Longs:24.857.312.3
– Percent of Open Interest Shorts:35.650.68.2
– Net Position:-66,60441,59525,009
– Gross Longs:153,660354,83075,982
– Gross Shorts:220,264313,23550,973
– Long to Short Ratio:0.7 to 11.1 to 11.5 to 1
NET POSITION TREND:
– Strength Index Score (3 Year Range Pct):3.495.428.8
– Strength Index Reading (3 Year Range):Bearish-ExtremeBullish-ExtremeBearish
NET POSITION MOVEMENT INDEX:
– 6-Week Change in Strength Index:-0.3-2.216.0


British Pound Sterling Futures:

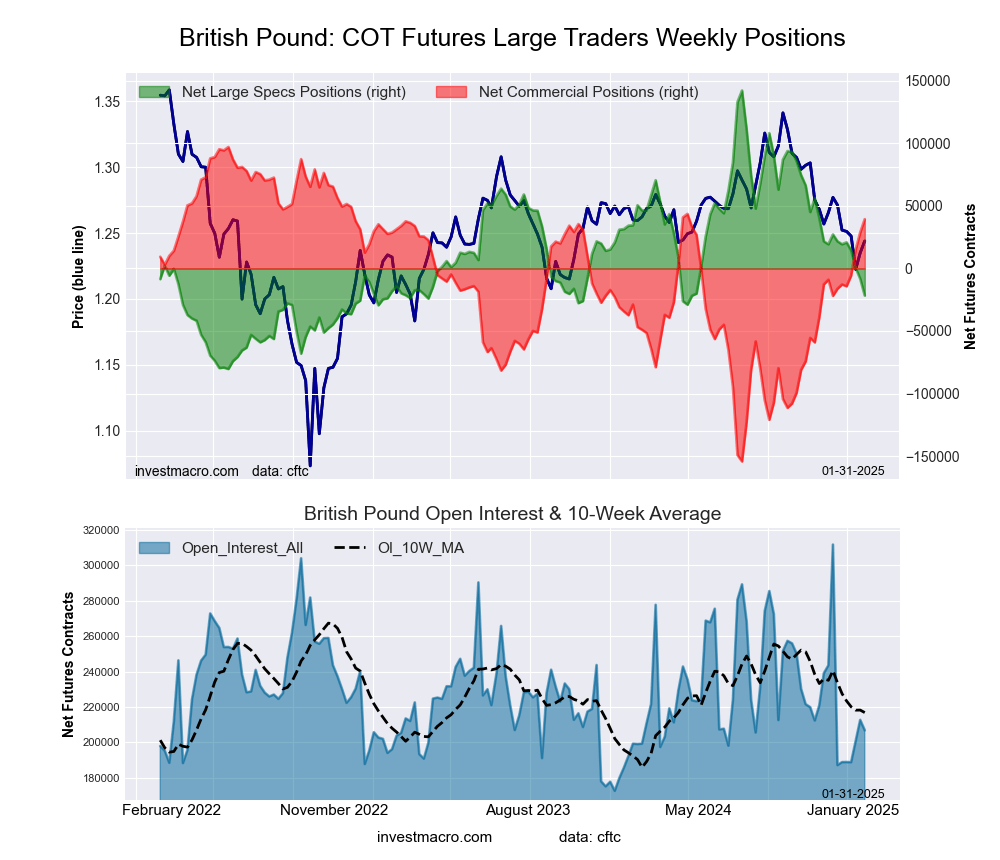
British Pound Sterling Futures COT ChartThe British Pound Sterling large speculator standing this week was a net position of -21,672 contracts in the data reported through Tuesday. This was a weekly lowering of -13,415 contracts from the previous week which had a total of -8,257 net contracts.

This week’s current strength score (the trader positioning range over the past three years, measured from 0 to 100) shows the speculators are currently Bearish with a score of 26.4 percent. The commercials are Bullish with a score of 77.0 percent and the small traders (not shown in chart) are Bearish with a score of 25.0 percent.

Price Trend-Following Model: Downtrend

Our weekly trend-following model classifies the current market price position as: Downtrend.

BRITISH POUND StatisticsSPECULATORSCOMMERCIALSSMALL TRADERS
– Percent of Open Interest Longs:28.758.710.2
– Percent of Open Interest Shorts:39.239.718.7
– Net Position:-21,67239,354-17,682
– Gross Longs:59,331121,42121,081
– Gross Shorts:81,00382,06738,763
– Long to Short Ratio:0.7 to 11.5 to 10.5 to 1
NET POSITION TREND:
– Strength Index Score (3 Year Range Pct):26.477.025.0
– Strength Index Reading (3 Year Range):BearishBullishBearish
NET POSITION MOVEMENT INDEX:
– 6-Week Change in Strength Index:-19.522.1-25.8


Japanese Yen Futures:

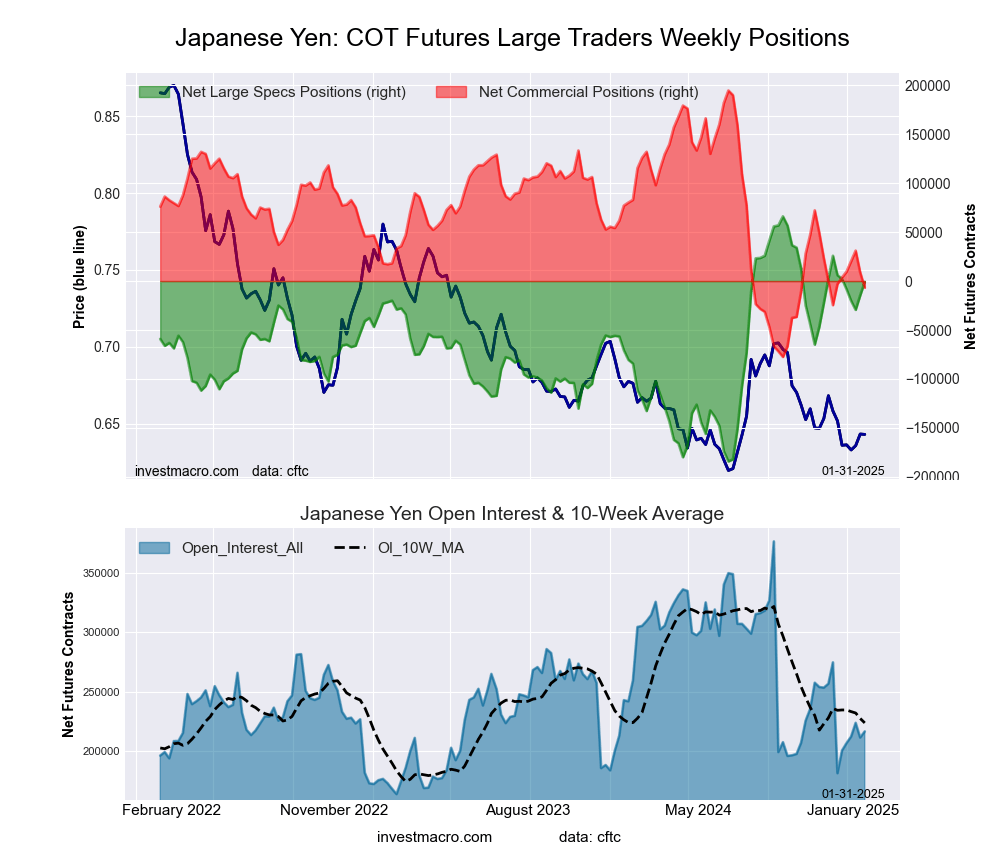
Japanese Yen Forex Futures COT ChartThe Japanese Yen large speculator standing this week was a net position of -959 contracts in the data reported through Tuesday. This was a weekly advance of 13,714 contracts from the previous week which had a total of -14,673 net contracts.

This week’s current strength score (the trader positioning range over the past three years, measured from 0 to 100) shows the speculators are currently Bullish with a score of 73.2 percent. The commercials are Bearish with a score of 26.0 percent and the small traders (not shown in chart) are Bullish-Extreme with a score of 82.3 percent.

Price Trend-Following Model: Downtrend

Our weekly trend-following model classifies the current market price position as: Downtrend.

JAPANESE YEN StatisticsSPECULATORSCOMMERCIALSSMALL TRADERS
– Percent of Open Interest Longs:44.731.720.4
– Percent of Open Interest Shorts:45.134.816.8
– Net Position:-959-6,7377,696
– Gross Longs:96,80968,68344,173
– Gross Shorts:97,76875,42036,477
– Long to Short Ratio:1.0 to 10.9 to 11.2 to 1
NET POSITION TREND:
– Strength Index Score (3 Year Range Pct):73.226.082.3
– Strength Index Reading (3 Year Range):BullishBearishBullish-Extreme
NET POSITION MOVEMENT INDEX:
– 6-Week Change in Strength Index:-2.8-1.325.6


Swiss Franc Futures:

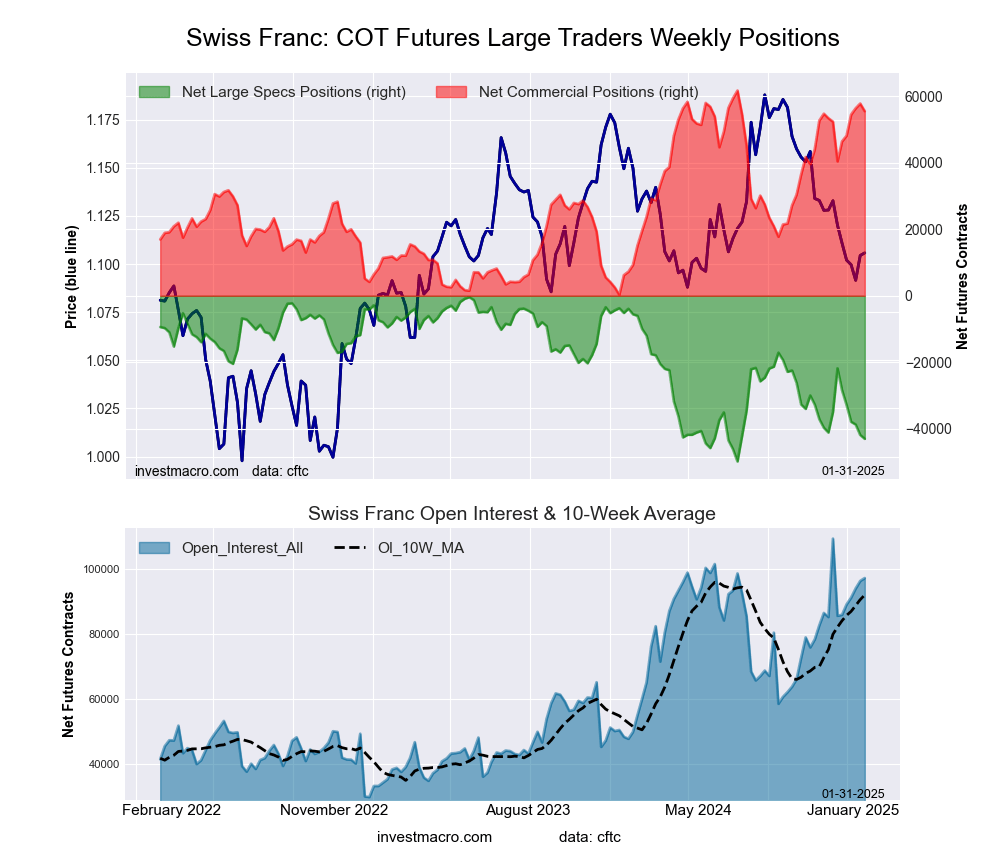
Swiss Franc Forex Futures COT ChartThe Swiss Franc large speculator standing this week was a net position of -43,000 contracts in the data reported through Tuesday. This was a weekly decline of -1,163 contracts from the previous week which had a total of -41,837 net contracts.

This week’s current strength score (the trader positioning range over the past three years, measured from 0 to 100) shows the speculators are currently Bearish-Extreme with a score of 13.8 percent. The commercials are Bullish-Extreme with a score of 89.9 percent and the small traders (not shown in chart) are Bearish with a score of 26.0 percent.

Price Trend-Following Model: Downtrend

Our weekly trend-following model classifies the current market price position as: Downtrend.

SWISS FRANC StatisticsSPECULATORSCOMMERCIALSSMALL TRADERS
– Percent of Open Interest Longs:5.185.88.7
– Percent of Open Interest Shorts:49.328.821.5
– Net Position:-43,00055,450-12,450
– Gross Longs:4,99683,4738,491
– Gross Shorts:47,99628,02320,941
– Long to Short Ratio:0.1 to 13.0 to 10.4 to 1
NET POSITION TREND:
– Strength Index Score (3 Year Range Pct):13.889.926.0
– Strength Index Reading (3 Year Range):Bearish-ExtremeBullish-ExtremeBearish
NET POSITION MOVEMENT INDEX:
– 6-Week Change in Strength Index:-43.024.526.0


Canadian Dollar Futures:

Canadian Dollar Forex Futures COT ChartThe Canadian Dollar large speculator standing this week was a net position of -147,601 contracts in the data reported through Tuesday. This was a weekly advance of 3,186 contracts from the previous week which had a total of -150,787 net contracts.

This week’s current strength score (the trader positioning range over the past three years, measured from 0 to 100) shows the speculators are currently Bearish with a score of 21.8 percent. The commercials are Bullish-Extreme with a score of 83.2 percent and the small traders (not shown in chart) are Bearish-Extreme with a score of 0.0 percent.

Price Trend-Following Model: Downtrend

Our weekly trend-following model classifies the current market price position as: Downtrend.

CANADIAN DOLLAR StatisticsSPECULATORSCOMMERCIALSSMALL TRADERS
– Percent of Open Interest Longs:6.483.48.0
– Percent of Open Interest Shorts:51.034.212.6
– Net Position:-147,601162,970-15,369
– Gross Longs:21,219276,25926,467
– Gross Shorts:168,820113,28941,836
– Long to Short Ratio:0.1 to 12.4 to 10.6 to 1
NET POSITION TREND:
– Strength Index Score (3 Year Range Pct):21.883.20.0
– Strength Index Reading (3 Year Range):BearishBullish-ExtremeBearish-Extreme
NET POSITION MOVEMENT INDEX:
– 6-Week Change in Strength Index:15.4-13.4-5.1


Australian Dollar Futures:

Australian Dollar Forex Futures COT ChartThe Australian Dollar large speculator standing this week was a net position of -71,831 contracts in the data reported through Tuesday. This was a weekly decline of -535 contracts from the previous week which had a total of -71,296 net contracts.

This week’s current strength score (the trader positioning range over the past three years, measured from 0 to 100) shows the speculators are currently Bearish with a score of 25.3 percent. The commercials are Bullish with a score of 77.0 percent and the small traders (not shown in chart) are Bearish with a score of 30.2 percent.

Price Trend-Following Model: Downtrend

Our weekly trend-following model classifies the current market price position as: Downtrend.

AUSTRALIAN DOLLAR StatisticsSPECULATORSCOMMERCIALSSMALL TRADERS
– Percent of Open Interest Longs:16.867.512.4
– Percent of Open Interest Shorts:54.226.316.2
– Net Position:-71,83179,001-7,170
– Gross Longs:32,196129,57423,866
– Gross Shorts:104,02750,57331,036
– Long to Short Ratio:0.3 to 12.6 to 10.8 to 1
NET POSITION TREND:
– Strength Index Score (3 Year Range Pct):25.377.030.2
– Strength Index Reading (3 Year Range):BearishBullishBearish
NET POSITION MOVEMENT INDEX:
– 6-Week Change in Strength Index:-7.34.76.3


New Zealand Dollar Futures:

New Zealand Dollar Forex Futures COT ChartThe New Zealand Dollar large speculator standing this week was a net position of -47,031 contracts in the data reported through Tuesday. This was a weekly lift of 4,192 contracts from the previous week which had a total of -51,223 net contracts.

This week’s current strength score (the trader positioning range over the past three years, measured from 0 to 100) shows the speculators are currently Bearish-Extreme with a score of 8.9 percent. The commercials are Bullish-Extreme with a score of 91.5 percent and the small traders (not shown in chart) are Bearish with a score of 20.1 percent.

Price Trend-Following Model: Downtrend

Our weekly trend-following model classifies the current market price position as: Downtrend.

NEW ZEALAND DOLLAR StatisticsSPECULATORSCOMMERCIALSSMALL TRADERS
– Percent of Open Interest Longs:9.486.33.8
– Percent of Open Interest Shorts:65.427.26.9
– Net Position:-47,03149,651-2,620
– Gross Longs:7,89872,4683,201
– Gross Shorts:54,92922,8175,821
– Long to Short Ratio:0.1 to 13.2 to 10.5 to 1
NET POSITION TREND:
– Strength Index Score (3 Year Range Pct):8.991.520.1
– Strength Index Reading (3 Year Range):Bearish-ExtremeBullish-ExtremeBearish
NET POSITION MOVEMENT INDEX:
– 6-Week Change in Strength Index:-5.33.815.2


Mexican Peso Futures:

Mexican Peso Futures COT ChartThe Mexican Peso large speculator standing this week was a net position of 5,224 contracts in the data reported through Tuesday. This was a weekly boost of 6,768 contracts from the previous week which had a total of -1,544 net contracts.

This week’s current strength score (the trader positioning range over the past three years, measured from 0 to 100) shows the speculators are currently Bearish with a score of 31.4 percent. The commercials are Bullish with a score of 72.6 percent and the small traders (not shown in chart) are Bearish-Extreme with a score of 10.5 percent.

Price Trend-Following Model: Downtrend

Our weekly trend-following model classifies the current market price position as: Downtrend.

MEXICAN PESO StatisticsSPECULATORSCOMMERCIALSSMALL TRADERS
– Percent of Open Interest Longs:33.761.02.8
– Percent of Open Interest Shorts:29.963.24.4
– Net Position:5,224-3,023-2,201
– Gross Longs:46,60184,3883,854
– Gross Shorts:41,37787,4116,055
– Long to Short Ratio:1.1 to 11.0 to 10.6 to 1
NET POSITION TREND:
– Strength Index Score (3 Year Range Pct):31.472.610.5
– Strength Index Reading (3 Year Range):BearishBullishBearish-Extreme
NET POSITION MOVEMENT INDEX:
– 6-Week Change in Strength Index:-4.84.80.4


Brazilian Real Futures:

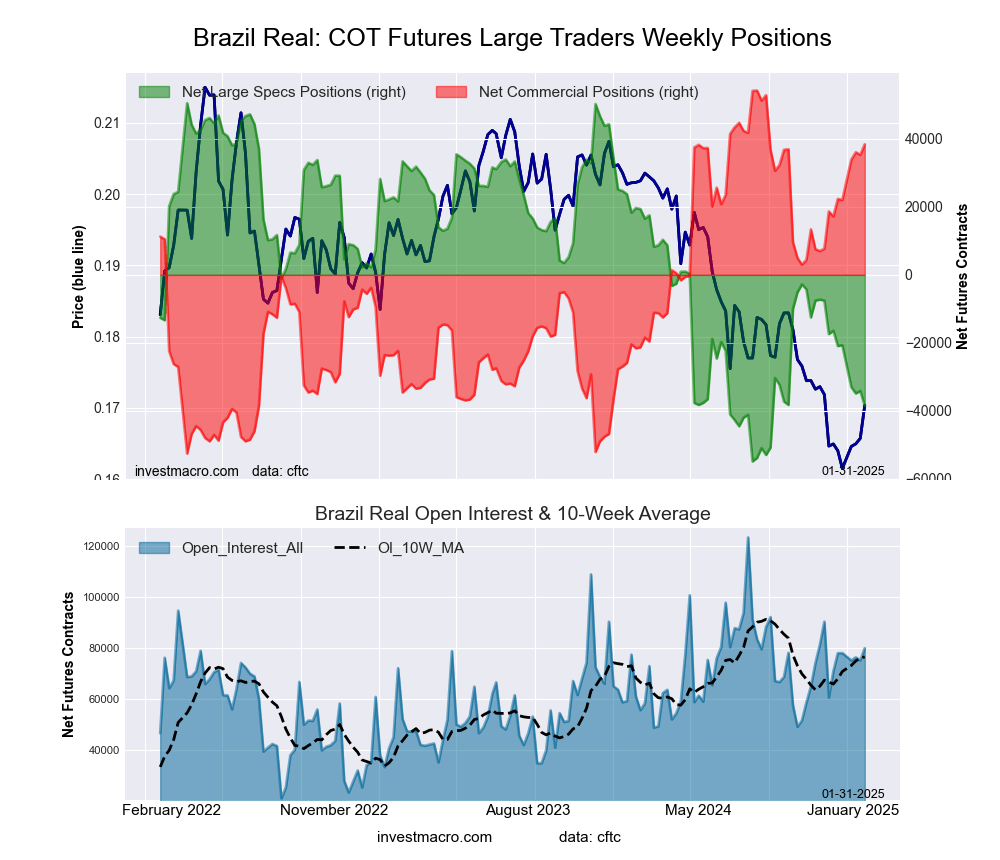
Brazil Real Futures COT ChartThe Brazilian Real large speculator standing this week was a net position of -38,494 contracts in the data reported through Tuesday. This was a weekly decline of -4,363 contracts from the previous week which had a total of -34,131 net contracts.

This week’s current strength score (the trader positioning range over the past three years, measured from 0 to 100) shows the speculators are currently Bearish-Extreme with a score of 15.6 percent. The commercials are Bullish-Extreme with a score of 85.2 percent and the small traders (not shown in chart) are Bearish with a score of 21.3 percent.

Price Trend-Following Model: Weak Downtrend

Our weekly trend-following model classifies the current market price position as: Weak Downtrend.

BRAZIL REAL StatisticsSPECULATORSCOMMERCIALSSMALL TRADERS
– Percent of Open Interest Longs:24.271.33.2
– Percent of Open Interest Shorts:72.423.23.1
– Net Position:-38,49438,40787
– Gross Longs:19,37256,9522,529
– Gross Shorts:57,86618,5452,442
– Long to Short Ratio:0.3 to 13.1 to 11.0 to 1
NET POSITION TREND:
– Strength Index Score (3 Year Range Pct):15.685.221.3
– Strength Index Reading (3 Year Range):Bearish-ExtremeBullish-ExtremeBearish
NET POSITION MOVEMENT INDEX:
– 6-Week Change in Strength Index:-16.715.18.3


Bitcoin Futures:

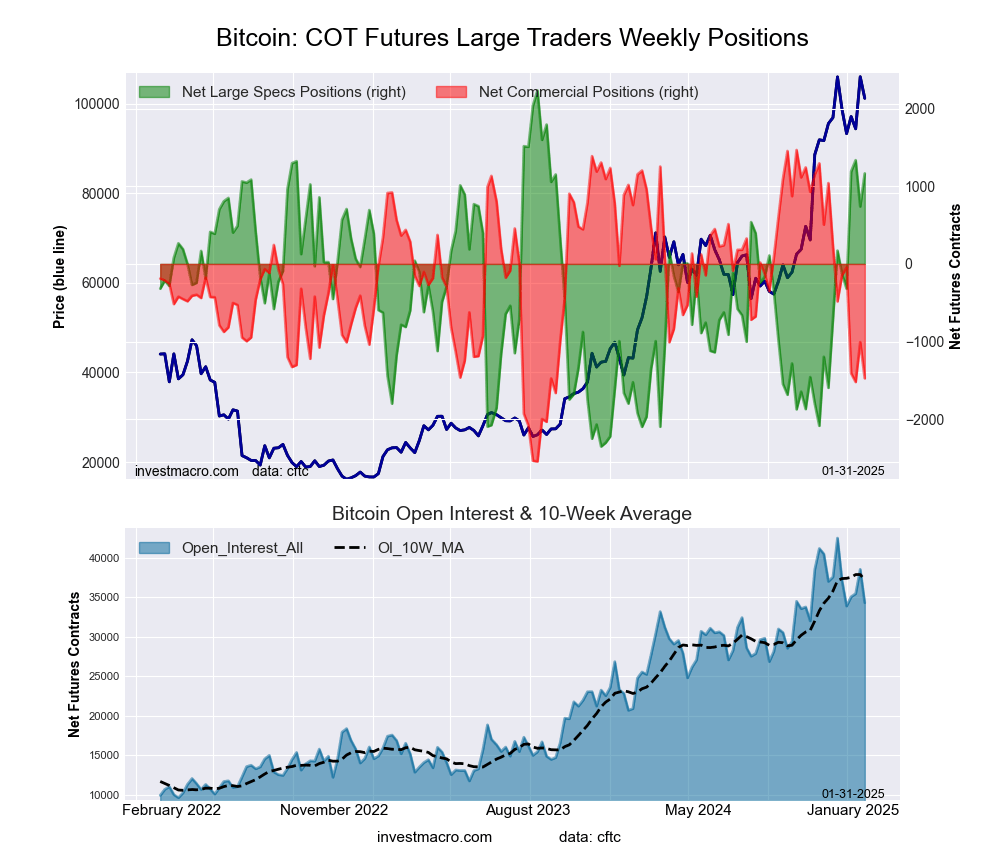
Bitcoin Crypto Futures COT ChartThe Bitcoin large speculator standing this week was a net position of 1,165 contracts in the data reported through Tuesday. This was a weekly rise of 426 contracts from the previous week which had a total of 739 net contracts.

This week’s current strength score (the trader positioning range over the past three years, measured from 0 to 100) shows the speculators are currently Bullish with a score of 76.7 percent. The commercials are Bearish with a score of 26.7 percent and the small traders (not shown in chart) are Bearish with a score of 33.1 percent.

Price Trend-Following Model: Uptrend

Our weekly trend-following model classifies the current market price position as: Uptrend.

BITCOIN StatisticsSPECULATORSCOMMERCIALSSMALL TRADERS
– Percent of Open Interest Longs:83.34.34.8
– Percent of Open Interest Shorts:79.98.63.9
– Net Position:1,165-1,473308
– Gross Longs:28,5931,4821,661
– Gross Shorts:27,4282,9551,353
– Long to Short Ratio:1.0 to 10.5 to 11.2 to 1
NET POSITION TREND:
– Strength Index Score (3 Year Range Pct):76.726.733.1
– Strength Index Reading (3 Year Range):BullishBearishBearish
NET POSITION MOVEMENT INDEX:
– 6-Week Change in Strength Index:21.7-24.7-0.3


Article By InvestMacroReceive our weekly COT Newsletter

*COT Report: The COT data, released weekly to the public each Friday, is updated through the most recent Tuesday (data is 3 days old) and shows a quick view of how large speculators or non-commercials (for-profit traders) were positioned in the futures markets.

The CFTC categorizes trader positions according to commercial hedgers (traders who use futures contracts for hedging as part of the business), non-commercials (large traders who speculate to realize trading profits) and nonreportable traders (usually small traders/speculators) as well as their open interest (contracts open in the market at time of reporting). See CFTC criteria here.