Archive for Opinions – Page 33

Technical Indicators Signal Major Breakout Potential Despite Recent Price Dip

Source: Clive Maund (3/27/25)

Technical Analyst Clive Maund explains why he thinks it now may be the time to buy or add positions of Armory Mining Corp.’s (ARMY:CSE; RMRYF:OTC; J2S:FRA).

Although the price of Armory Mining Corp.’s (ARMY:CSE; RMRYF:OTC; J2S:FRA) stock has drifted off since we first looked at it early in February, its technical condition has strengthened greatly as we will see when we come to review its latest charts which means that it is more of a buy now.

Armory Mining Corp. changed its name from Spey Resources in November and is a junior company focused on exploring for critical minerals that are vital to the future of security and military applications, such as antimony, gold, silver, lithium, and various other minerals that will be in increasing demand in the future with the prospect of much higher prices for most of them. So it’s not surprising that the company’s stock has been under accumulation for many months, and especially in recent weeks, and is completing a large base pattern from which it is set to break out into a major bull market soon.

Before we look at the stock charts, which make a clear and robust case for buying Armory Mining, we will first overview the fundamentals of the company using slides lifted from the investor deck.

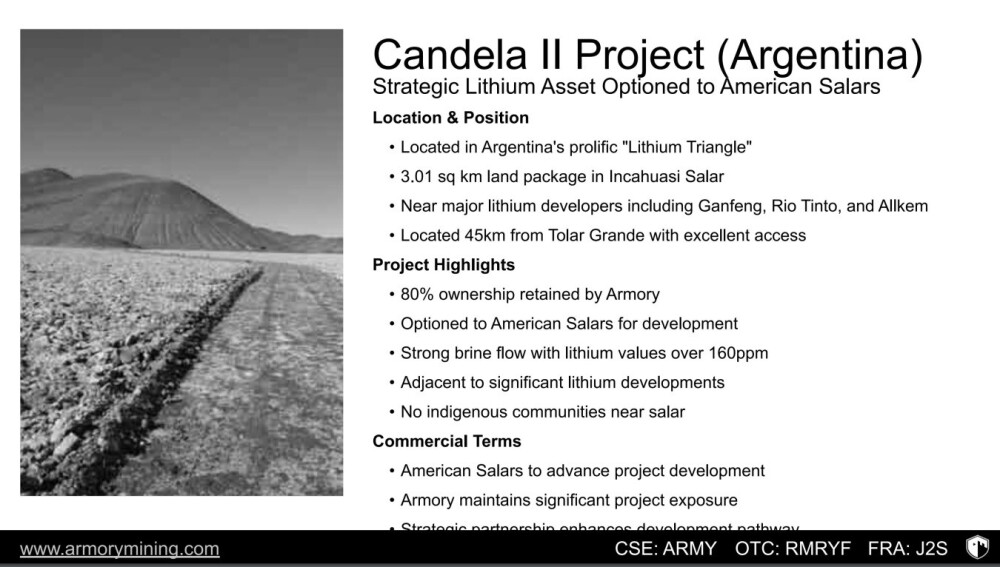
Armory Minerals has four projects situated in proven mining districts that have past-producing mines where the infrastructure is good. The approximate locations of these projects are shown on the following slide. Three of them are in Canada, with the remaining one in Argentina. The Ammo Property in Nova Scotia and the Riley Creek property in British Columbia are chiefly antimony and gold projects, while the Kaslo Silver property in British Columbia is, as its name implies, primarily silver, and Candela II in Argentina is a lithium deposit. . .
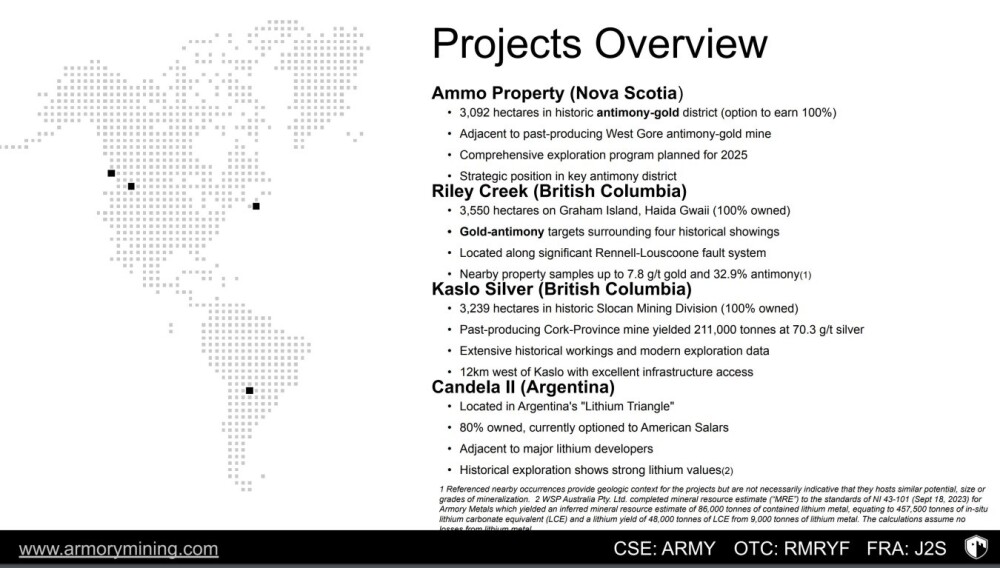
With the growing imposition of tariffs and trade barriers, the importance of producing antimony in North America is becoming increasingly clear since China is the dominant source of this semi-metal, and its price looks set to continue higher.

The following pages from the investor deck overview each of the projects in turn.
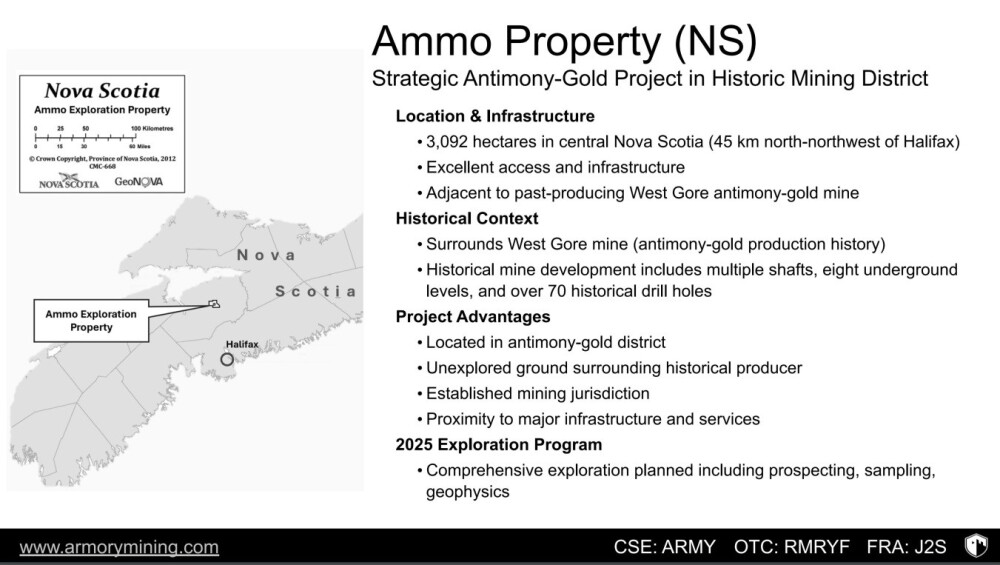
Since we last looked at Armory in February, there has been news that the company is to retain control of this lithium project because American Salars Lithium Inc. (USLI:CSE; USLIF:OTC; Z3P:FWB; A3E2NY:WKN) has relinquished its option to develop it.

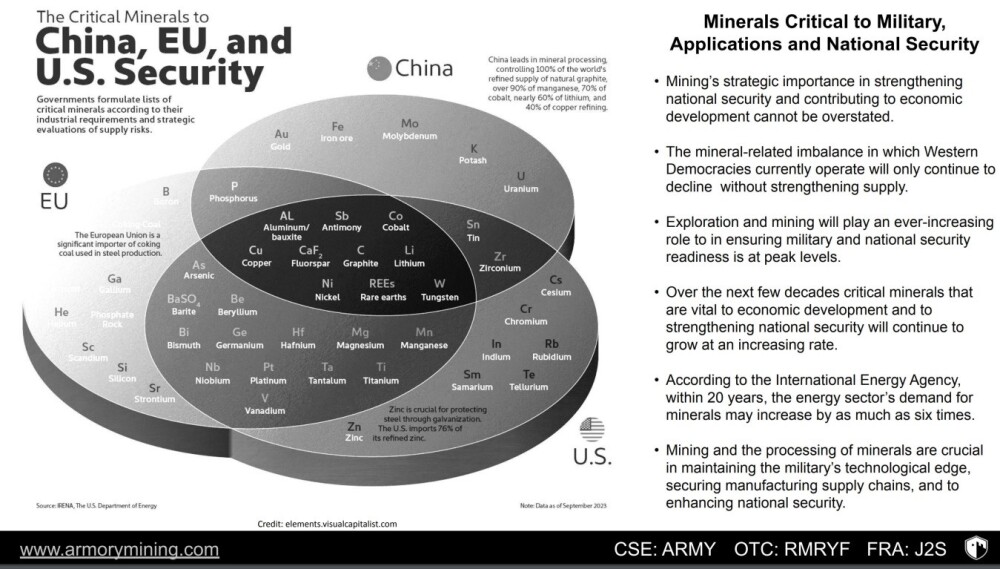
This slide details the importance of different critical minerals to the major world trading blocs.
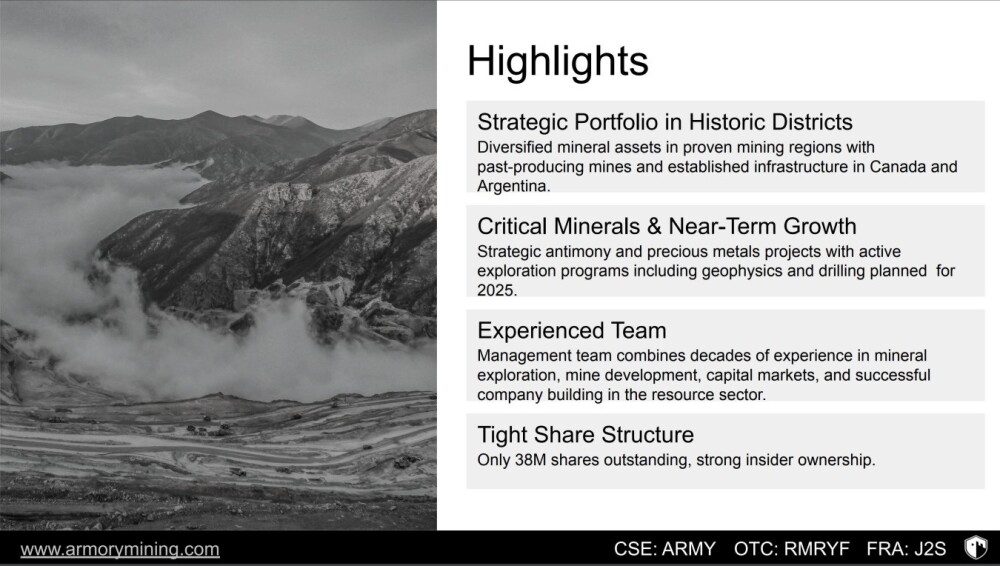
The company highlights are on the below slide.
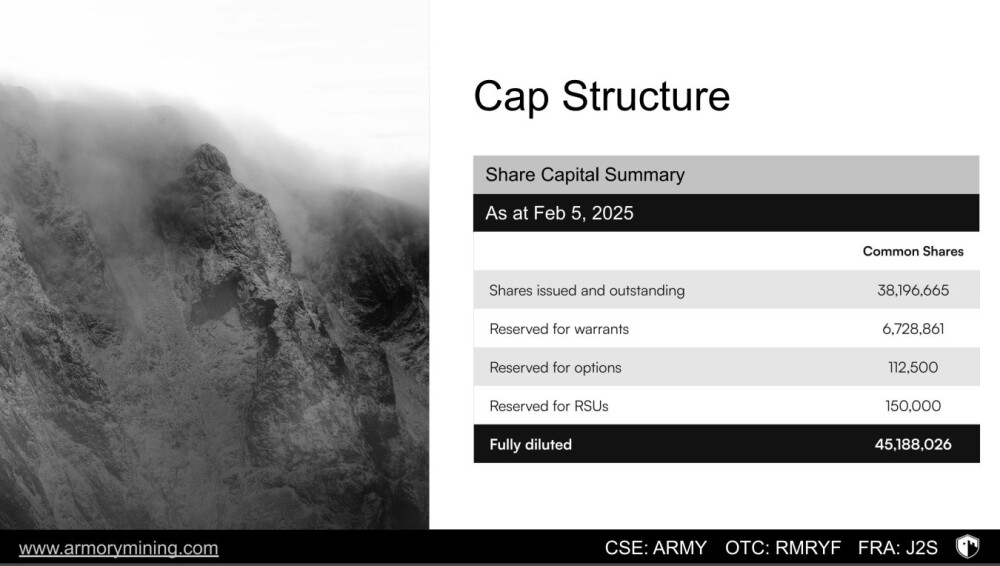
On this last slide, we see that the company has a reasonable 38.2 million shares in issue.
Now, we will review the latest charts for Armory Mining.

The situation is paradoxical — although we have taken quite a hit with this since it was recommended early in February, the charts look far more bullish than they did even then for reasons that we will now examine.

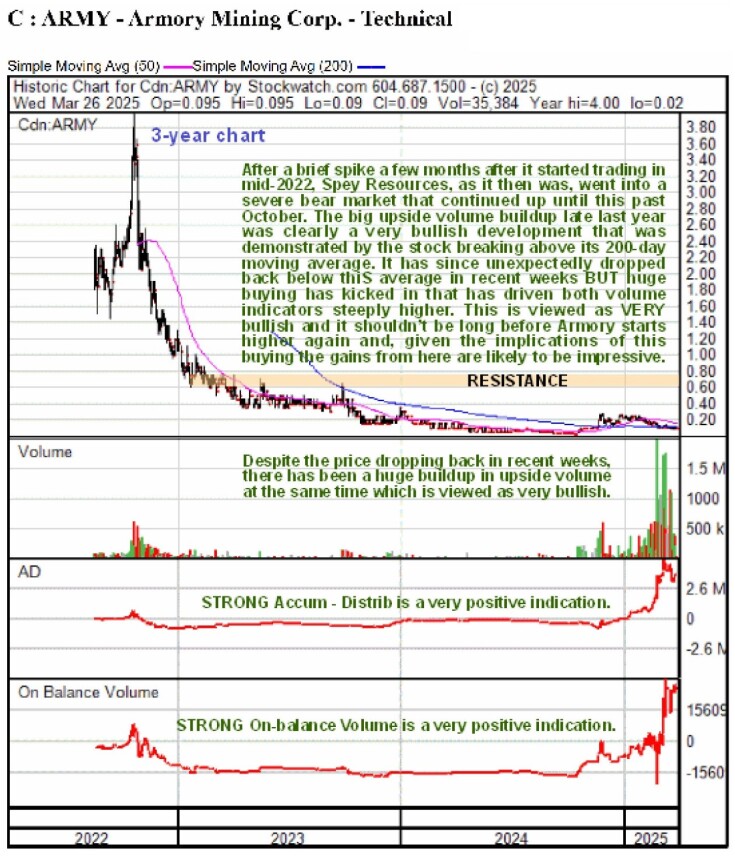
Starting with the 3-year chart we see again that Armory Mining is late in a basing process following the severe bear market from September – October of 2022 through early – mid 2024. The difference between now and when we first looked at it in February is that there has been a massive buildup in upside volume even though the price has retreated somewhat that has driven both volume indicators shown strongly higher. This is very bullish and may even be described as creating a “pressure cooker” effect.
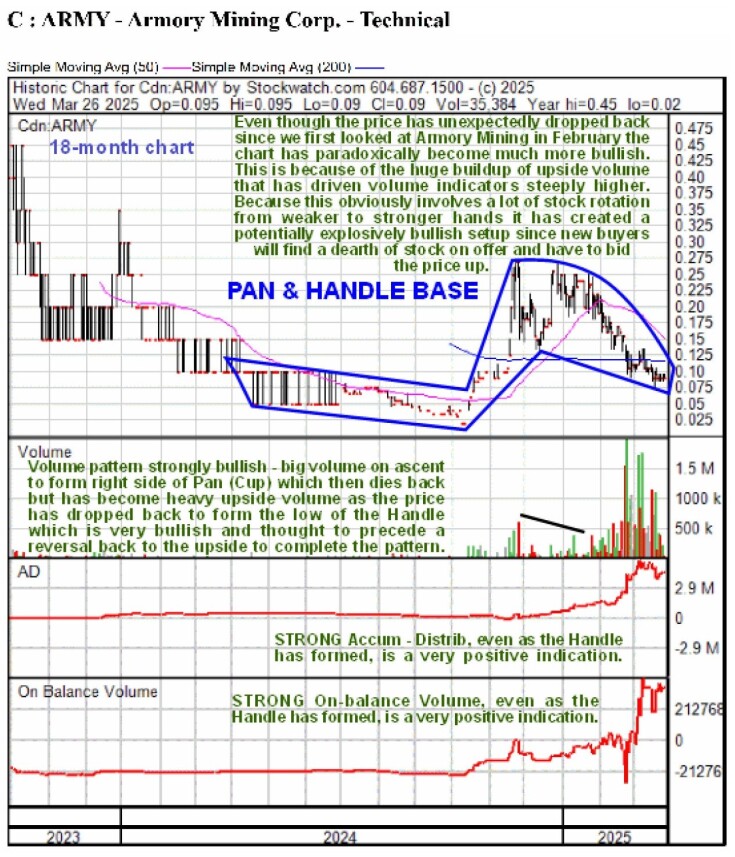
On the 18-month chart, we can see much more clearly what has been going on in the recent past. Back in February, we had thought, on the basis of the strong volume pattern and volume indicators, that the Handle part of the pattern was about to complete and that the price should advance, but instead, it broke lower and dropped back some, requiring us to adjust the boundaries of the Pan & Handle pattern.

However, although the price has lost ground, the technical picture has strengthened dramatically. This is because volume became extremely heavy with most of this volume being upside volume, as evidenced by the volume towers and also by both the volume indicators shown rising steeply. A big reason why this is so bullish is because this persistent heavy volume means that there has been a lot of stock rotation with the new buyers “locking up” a lot of stock, because they won’t be inclined to sell until they have turned a significant profit — and we can presume that they bought for a reason. What this means is that any significant influx of demand will find a market short of stock, so if they want to buy they will have to bid the price up. We will now look at the recent dip in more detail on a 6-month chart.
On the 6-month chart, we can easily see the persistent heavy upside volume as the price has drifted somewhat lower in the orderly downtrend shown and how it has driven volume indicators higher — and they have remained buoyant as the price has drifted even lower.

This downtrend has brought the price back to a zone of significant support, and we can see that the stock is already nudging a breakout from this downtrend, which looks likely to occur soon. for the reasons set out above, a breakout from this downtrend could quickly lead to a steep ascent from here.
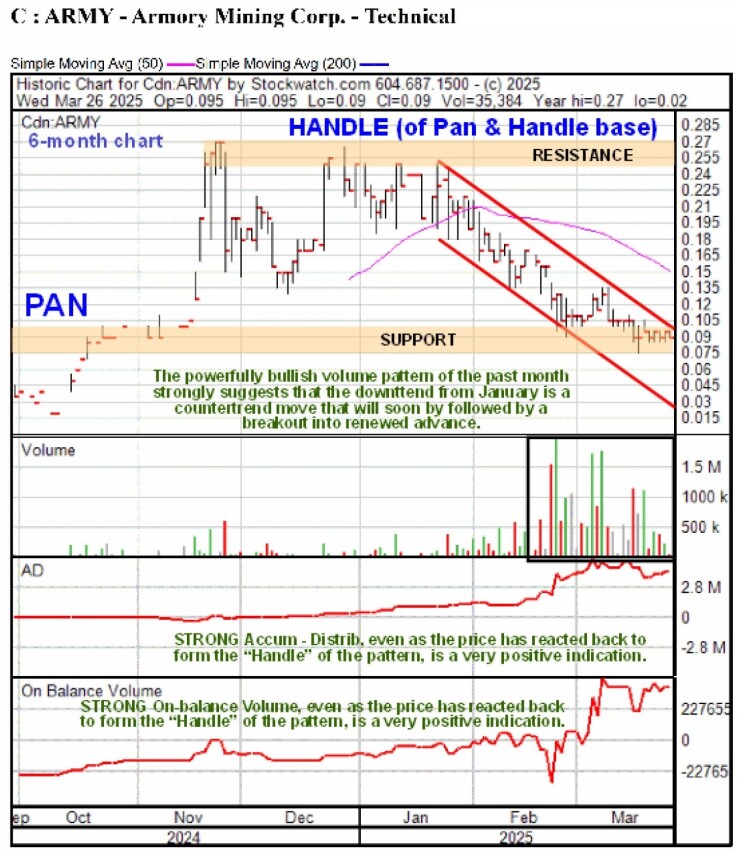
Holders of Armory Mining should therefore stay long and this is considered to be an excellent point to buy or add to positions. The first target for an advance is the resistance at the top of the Handle approaching and at CA$0.27. The second target is another band of resistance in the CA$0.60 area with higher targets possible.

Armory Mining Corp.’s website.

Armory Mining Corp.’s (ARMY:CSE; RMRYF:OTC; J2S:FRA) closed for trading at CA$0.09, US$0.0589 on March 26, 2025.


Important Disclosures:

  1. American Salars Lithium has a consulting relationship with Street Smart an affiliate of Streetwise Reports. Street Smart Clients pay a monthly consulting fee between US$8,000 and US$20,000.
  2. As of the date of this article, officers and/or employees of Streetwise Reports LLC (including members of their household) own securities of American Salars Lithium.
  3. Clive Maund: I determined which companies would be included in this article based on my research and understanding of the sector.
  4. Statements and opinions expressed are the opinions of the author and not of Streetwise Reports, Street Smart, or their officers. The author is wholly responsible for the accuracy of the statements. Streetwise Reports was not paid by the author to publish or syndicate this article. Streetwise Reports requires contributing authors to disclose any shareholdings in, or economic relationships with, companies that they write about. Any disclosures from the author can be found  below. Streetwise Reports relies upon the authors to accurately provide this information and Streetwise Reports has no means of verifying its accuracy.
  5.  This article does not constitute investment advice and is not a solicitation for any investment. Streetwise Reports does not render general or specific investment advice and the information on Streetwise Reports should not be considered a recommendation to buy or sell any security. Each reader is encouraged to consult with his or her personal financial adviser and perform their own comprehensive investment research. By opening this page, each reader accepts and agrees to Streetwise Reports’ terms of use and full legal disclaimer. Streetwise Reports does not endorse or recommend the business, products, services or securities of any company.

For additional disclosures, please click here.

Clivemaund.com Disclosures

The above represents the opinion and analysis of Mr. Maund, based on data available to him, at the time of writing. Mr. Maund’s opinions are his own, and are not a recommendation or an offer to buy or sell securities. As trading and investing in any financial markets may involve serious risk of loss, Mr. Maund recommends that you consult with a qualified investment advisor, one licensed by appropriate regulatory agencies in your legal jurisdiction, and do your own due diligence and research when making any kind of a transaction with financial ramifications. Although a qualified and experienced stock market analyst, Clive Maund is not a Registered Securities Advisor. Therefore Mr. Maund’s opinions on the market and stocks cannot be construed as a recommendation or solicitation to buy and sell securities.

CN50 index sensitive to flood of earnings this week

By ForexTime 

  • 34% of CN50 members reporting earnings this week.
  • Earnings by BYD and China Merchants Bank helped support CN50 above 21-day SMA.
  • 24% of CN50 members left to report earnings by the weekend.
  • Banking stocks carry the most weightage (23.8%) on the CN50 index.
  • CN50 bulls eager for more signs of economic resilience and support.


FXTM’s CN50 index is bracing for even more earnings announcements this week.

NOTE: FXTM’s CN50 index tracks the underlying FTSE China A50 index, which measures the overall performance of the 50 biggest A Share Chinese companies.

For the entire week, about a third (34%) of the 50 members on this stock index are set to unveil their respective financial results.

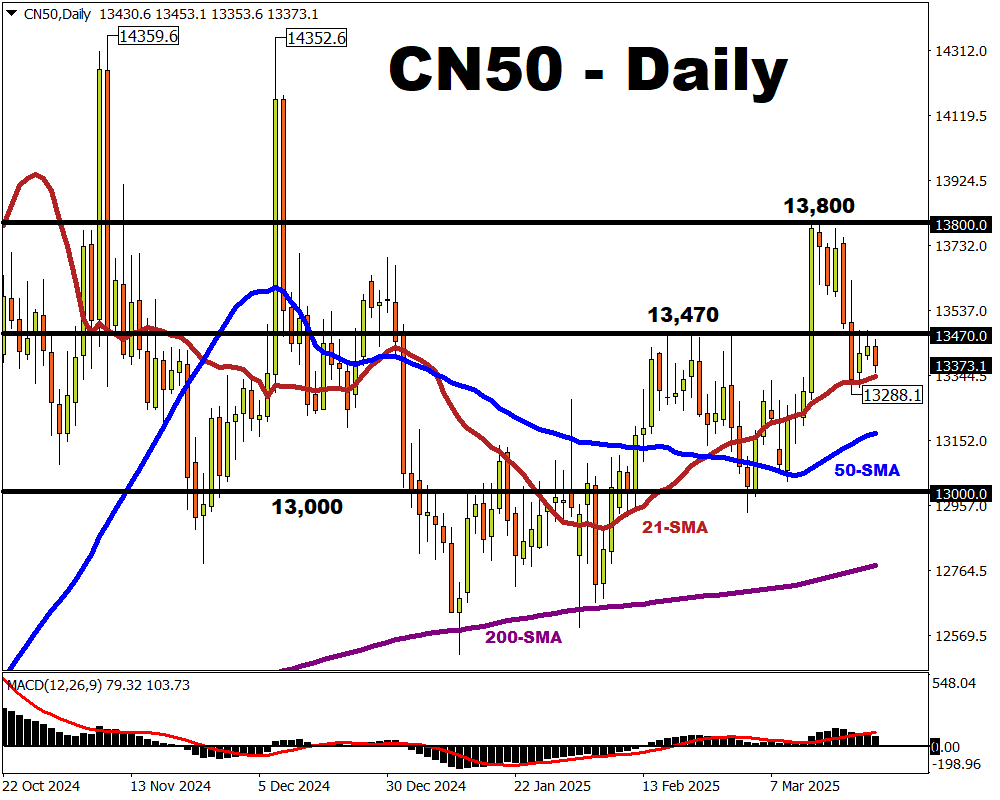
Earlier this week, BYD and China Merchants Bank – two of the 5-biggest CN50 members – have already made their respective announcements, which helped keep CN50 supported above its 21-day simple moving average (SMA).

However, initial gains were thwarted around the 13,470 region – a notable resistance back in February 2025 as well, before returning to test support around the 21-day SMA once more.

Also, the 13,470 region served as the mid-range for the CN50’s sideways pattern in most of Q4 2024.

Imagen
CN50 to react to earnings


But there’s more!

Some 24% of the CN50’s members are due to release their earnings in the days ahead.

  • This includes many major banks, such as Industrial & Commercial Bank of China, Industrial Bank, and the Agricultural Bank of China.
  • Banking stocks have the most members (12) represented on the CN50 index of any other industry group, collectively account for nearly 24% of this index.

In short, these earnings could hold great influence over the CN50’s near-term performance.


And the CN50 could use all the help it can get.

The CN50 has lagged behind FXTM’s other Chinese stock indexes, namely the CHINAH and HK50, in terms of their respective performances so far in 2025:

  • CN50: down 0.8% year-to-date
  • HK50: up 17.1% year-to-date
  • CHINAH: up 18.8% year-to-date

Even though it’s pretty much flat on a year-to-date basis, the CN50 is still holding up well relative to its US counterparts:

  • US500: down 1.8% year-to-date
  • NAS100: down 3.4% year-to-date
  • US400: down 3.6% year-to-date
  • RUS2000: down 6% year-to-date


Earnings boost enough for CN50 bulls?

Granted, while an earnings boost will be roundly welcomed by CN50 bulls (those hoping prices will go higher), it’s unlikely to rapidly narrow the year-to-date gap with the likes of CHINAH and HK50.

After all, the latter two indices have soared on the AI-mania that’s now swaying Chinese markets.

Ultimately, given how economically-sensitive CN50’s constituents are, this index may need further evidence of incoming support to shore up China’s recovery.

Hence, beyond the corporate earnings announcements, traders and investors are also set to draw clues about the overall health of China’s economy via these upcoming major data releases:

  • Thursday, March 27th: February industrial profits
  • Monday, March 31st: March purchasing managers’ indexes (PMIs)

Should concerns surrounding global economic growth become less pronounced, that could carve out more upside for the CN50 index, and vice versa.


Potential Scenarios:

  • BULLISH: Better-than-expected earnings, along with easing concerns over the global economic outlook, should raise the odds of CN50 reclaiming the 13,800 handle.


  • BEARISH: Disappointing CN50 member earnings this week, along with rising concerns about the global economic outlook, could drag this stock index below its 21-day SMA to potentially test its 50-day SMA as an immediate downside target. 

    The psychologically-important 13k level then lies further south to potentially shore up support.


Forex-Time-LogoArticle by ForexTime
ForexTime Ltd (FXTM) is an award winning international online forex broker regulated by CySEC 185/12 www.forextime.com

Duterte’s rendition, PH political turmoil and the ICC’s dilemma

By Dan Steinbock

On Thursday, the Philippines saw hours of political drama that left masses of Filipinos angry and ICC observers perplexed. The Duterte rendition could have long-lasting, adverse consequences in both the Philippines and the ICC.

In the Senate’s much-anticipated Duterte detention hearing on Thursday, Senator Imee Marcos, chair of the Foreign Affairs Committee, interviewed the key cabinet members of President Ferdinand Marcos Jr., her brother. One by one, Marcos contrasted their responses with prior interviews, ICC and Interpol documents, highlighting deep gaps between official statements and actual realities.

In a telling moment, Secretary of Interior Jonvic Remulla said the government did not “plot” Duterte’s arrest prior to March 11. Then, Senator Marcos showed Remulla’s prior TV interview in which the minister acknowledged that he, the president, Defense Secretary Gilberto Teodoro Jr. and Security Adviser Eduardo Año set the arrest of Duterte in motion.

Troubling inconsistencies

Secretary Año said the claims that he, along with the president, Justice Secretary Crispin Remulla, and Defense Secretary Gilbert Teodoro, had conspired to plan Duterte’s arrest were untrue. He was unaware of any coordination with the ICC and learned of the Interpol notice on March 11. Yet, Marcos cited Interpol’s communication stating the arrest was made “with prior consultation with the Philippine government.”

Año also said that any meeting regarding this matter occurred only after they were made aware of Interpol’s “red notice” for the former president’s arrest. Yet, the country’s transnational crime (PCTC) director Anthony Alcantara admitted the Interpol did not issue a red notice against Duterte, only a diffusion notice; that is, not a notice needed to undertake a provisional arrest, but a lower-level alert for information sharing.

Justice Secretary Remulla contradicted his 2024 statement under oath before another Senate hearing that any ICC arrest order or Interpol notice should be brought before local courts. Instead, Duterte was pushed forcefully into, oddly, a private plane by Police Maj. Gen. Nicolas Torre III, after Duterte’s lawyer was handcuffed.

Vice President Sara Duterte said her father, former President Rodrigo Duterte, was taken into custody “without a valid warrant issued by a Philippine court, without due process.” The ICC is being used for political persecution “to demolish the opposition” prior to the 2025 and 2028 elections.

As legal scholar Alexis F. Medina concluded in his prior opinion and during the hearing, the arrest of the former president raises “several critical constitutional concerns – due process, warrantless arrests, and liberty of abode, among others.”

During the weekend, Sen. Imee Marcos said that she hasn’t had a conversation with her brother, President Marcos Jr., in a long time.

The ICC’s original compromise

In the 1990s, the special tribunals established by the UN Security Council to prosecute crimes in the Balkans and Rwanda fostered efforts to create a permanent court. The International Criminal Court (ICC) was the international community’s response to renewed atrocities and ethnic conflict. But it was constrained at birth.

In the 1998 Rome Conference, the scope of the court’s jurisdiction was one of the most intensely debated topics. Many NGOs and rights organizations advocated universal jurisdiction. By contrast, the United States and some of its allies advocated jurisdiction based on UN Security Council authorization.

In the subsequent compromise between the idealists and the realists, the ICC would have jurisdiction over alleged crimes committed on the territory of a member state, by the national of a member state, or in other situations when the Security Council has authorized court action.

This compromise allows the court to investigate and prosecute the nationals of a non-member state; as in the case of Philippines.

Allegations of partiality: Kenya, Uhuru and ICC

Cognizant of its limitations, the ICC began its operations cautiously in 2003. It moved ahead only when the country in question had requested court intervention (Congo DR, Central African Republic, Uganda) or when the UN Security Council had authorized the role of the court.

Despite increasing international divides in the early 2010s, the ICC’s pattern changed when its prosecutor launched its first investigation without explicit state support, against President Uhuru Kenyatta (who eventually beat the case). In the messy case involving lucrative external interests, the line between legitimate prosecution and political persecution grew thin.

Many African nations regard the court, which has largely focused only on the poor, resource-rich countries of Africa, as a “toy of declining imperial powers.”

Yet, the ICC didn’t take a step back. Its ambitious prosecutors ignored caution engaging in investigations, which brought the court into direct contests with several non-member states, including Russia, Libya, Myanmar, U.S. in Afghanistan, and more recently, Israel in Gaza. The results were predictable.

In two decades, the prosecutor has secured convictions in only 4 cases, typically in cases against citizens of member countries. Cases against non-member state nationals have yielded almost nothing.

Rising tensions

Oddly, the role of Martin Romualdez, the Speaker of the House of Representatives, in the ongoing dynastic debacles has been largely excluded in international media, even though in domestic debate it is seen as vital to the turmoil.

Moreover, the Marcos/Duterte debacle is characterized as a battle of “two political dynasties.” Yet, the Dutertes have neither the economic resources nor the links of President Marcos Jr with the financial elites. After his victory, the president convened some of the country’s “boldest business minds” to “strengthen synergies” between the private and public sectors. To Marcos champions, the “billionaire club’s” role is only advisory. To Duterte supporters, it is reminiscent of Marcos Sr’s cronies.

Furthermore, the government’s mounting debacles – murky budget items and eroding economy, outsourcing of military sovereignty to rotational US bases, perceived illicit measures in Duterte’s expulsion – have stirred growing resentment among the populace.

The government insists it is only observing international pressures. Yet, critics argue that some cabinet members have violated the Philippine constitution and its Cooperation Agreement with the ICC. The ICC observers fear its procedures may have been undermined.

Given the present course, the 2010s Uhuru/ICC pattern – domestic political rivalry offshored to the ICC, uncertainty in domestic economy, detrimental geopolitics and weaker economic prospects – may now be evolving in the Philippines.

About the Author:

Dr. Dan Steinbock is an internationally recognized strategist of the multipolar world and the founder of Difference Group. He has served at the India, China and America Institute (USA), Shanghai Institutes for International Studies (China) and the EU Center (Singapore). For more, see https://www.differencegroup.net 


The original page-one op-ed was published by The Manila Times on March 24, 2025


Museums have tons of data, and AI could make it more accessible − but standardizing and organizing it across fields won’t be easy

By Bradley Wade Bishop, University of Tennessee 

Ice cores in freezers, dinosaurs on display, fish in jars, birds in boxes, human remains and ancient artifacts from long gone civilizations that few people ever see – museum collections are filled with all this and more.

These collections are treasure troves that recount the planet’s natural and human history, and they help scientists in a variety of different fields such as geology, paleontology, anthropology and more. What you see on a trip to a museum is only a sliver of the wonders held in their collection.

Museums generally want to make the contents of their collections available for teachers and researchers, either physically or digitally. However, each collection’s staff has its own way of organizing data, so navigating these collections can prove challenging.

Creating, organizing and distributing the digital copies of museum samples or the information about physical items in a collection requires incredible amounts of data. And this data can feed into machine learning models or other artificial intelligence to answer big questions.

Currently, even within a single research domain, finding the right data requires navigating different repositories. AI can help organize large amounts of data from different collections and pull out information to answer specific questions.

But using AI isn’t a perfect solution. A set of shared practices and systems for data management between museums could improve the data curation and sharing necessary for AI to do its job. These practices could help both humans and machines make new discoveries from these valuable collections.

As an information scientist who studies scientists’ approaches to and opinions on research data management, I’ve seen how the world’s physical collection infrastructure is a patchwork quilt of objects and their associated metadata.

AI tools can do amazing things, such as make 3D models of digitized versions of the items in museum collections, but only if there’s enough well-organized data about that item available. To see how AI can help museum collections, my team of researchers started by conducting focus groups with the people who managed museum collections. We asked what they are doing to get their collections used by both humans and AI.

Collection managers

When an item comes into a museum collection, the collection managers are the people who describe that item’s features and generate data about it. That data, called metadata, allows others to use it and might include things like the collector’s name, geographic location, the time it was collected, and in the case of geological samples, the epoch it’s from. For samples from an animal or plant, it might include its taxonomy, which is the set of Latin names that classify it.

All together, that information adds up to a mind-boggling amount of data.

But combining data across domains with different standards is really tricky. Fortunately, collection managers have been working to standardize their processes across disciplines and for many types of samples. Grants have helped science communities build tools for standardization.

In biological collections, the tool Specify allows managers to quickly classify specimens with drop-down menus prepopulated with standards for taxonomy and other parameters to consistently describe the incoming specimens.

A common metadata standard in biology is Darwin Core. Similar well-established metadata and tools exist across all the sciences to make the workflow of taking real items and putting them into a machine as easy as possible.

Special tools like these and metadata help collection managers make data from their objects reusable for research and educational purposes.

Many of the items in museum collections don’t have a lot of information describing their origins. AI tools can help fill in gaps.

All the small things

My team and I conducted 10 focus groups, with a total of 32 participants from several physical sample communities. These included collection managers across disciplines, including anthropology, archaeology, botany, geology, ichthyology, entomology, herpetology and paleontology.

Each participant answered questions about how they accessed, organized, stored and used data from their collections in an effort to make their materials ready for AI to use. While human subjects need to provide consent to be studied, most species do not. So, an AI can collect and analyze the data from nonhuman physical collections without privacy or consent concerns.

We found that collection managers from different fields and institutions have lots of different practices when it comes to getting their physical collections ready for AI. Our results suggest that standardizing the types of metadata managers record and the ways they store it across collections could make the items in these samples more accessible and usable.

Additional research projects like our study can help collection managers build up the infrastructure they’ll need to make their data machine-ready. Human expertise can help inform AI tools that make new discoveries based on the old treasures in museum collections.The Conversation

About the Author:

Bradley Wade Bishop, Professor of Information Sciences, University of Tennessee

This article is republished from The Conversation under a Creative Commons license. Read the original article.

Golden Milestone

Source: Michael Ballanger (3/17/25)

Michael Ballanger of GGM Advisory Inc. takes a look at gold, silver, and copper amid political shifts in the U.S. and shares two of his favorite junior developers.

This is a week that shall go down in the annals of history, the week that a “barbarous relic” under the guise of a “pet rock” took its rightful seat on the throne of superior performance, bludgeoning the wailing anchors of CNBC into actually recognizing the ascendancy of gold and its little brother, silver. As the equity markets in the United States went into virtual freefall, the same bubbleheaded, narrative-spewing cast of characters were out in force, beseeching their global viewers to not panic and instead hold on because the Fed “has your backs.”

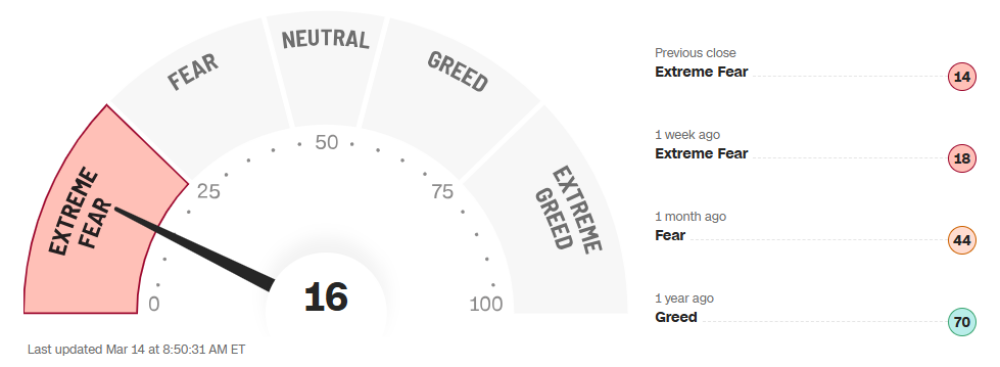
As gold soared Thursday evening and the wee hours of Friday morning above the magical $3k level, the CNBC Fear-Greed index slumped to a reading of 16, placing it squarely into <EXTREME FEAR>, a zone from which many market bottoms were born. The lowest reading for this index was in April 2020 during the COVID Crash, when it hit a reading of 1. At that point, there was literally nobody left to sell stocks as the world was convinced that the bubonic plague was descending upon us and that humanity, as we then knew it, was doomed.

That marked the bottom of the market in 2020, after which the combination of fiscal stimulus (“cheques to households”) and zero interest rates led to record liquidity levels for the Wall Street banks and a new S&P 500 high a mere five months later. I told subscribers mid-week that now was not the time to sell their holdings and load up on put options and/or volatility. It is also not the time to back the truck into the stock market loading dock and forklift copious amounts of the “MAG Seven” into the bed. March 2025 is not March 2020 because the U.S. government no longer enjoys the privilege of being able to print money. They cannot “save” the stock market by arbitrarily slashing interest rates to zero and engaging in the fiscal helicopter drop that Ben Bernanke boasted of in 2009.

By contrast, now is the time to carefully recalibrate one’s investment objectives and/or risk tolerance profile and above all else, get liquid. With an ample amount of cash, one can survive meltdowns but with leverage and/or no cash, one is completely indebted to and victim of the vagaries of the stock market. Now, if you own gold stocks and/or physical gold or silver, you are liquid; if you do not own them, you are enslaved. I want all subscribers to be free from worry so sell enough of your non-precious metals holdings to allow uninterrupted sleep to dominate the wee hours. Stocks closed the week with a 117-point S&P rally. Into any follow-through next week, increase your cash positions.

I expect that gold will take more than a one-off overnight spike in order to surpass the $3k level as a sustained move.

I expect that profit-taking will have it in a range of $2,975-$3,025 for several more days and perhaps weeks before it can achieve escape velocity above the magic number.

Politics, Economics, and Stocks

I wish I could have been embraced more gently as a youngster to my introduction to the field of politics, but ever since November 22, 1963, and the days and weeks thereafter, I have been totally jaundiced by the mere mention of the word “politics.” When the assassin’s bullet ended the life of a truly popular and indeed charismatic president in the form of John F. Kennedy in Dallas that day, it ended for me and an entire generation of baby boomer idealism that carried an engrained belief that the United States of America was indeed the “Promised Land.”

After Kennedy came LBJ and Viet Nam, Nixon and Watergate, Jimmy Carter and the Stagflation ’70s, and then the “Reagan Miracle” that rhymes beautifully with “Trump 2.0.” In 1981, Reagan had David Stockman; in 2025, Trump has Scott Bessent. In 1981, economic advisor to the President, David Stockman embraced the media with “supply-side economics”; in 2025, Elon Musk embraces the media with the “Department of Government Efficiency” (“DOGE“).

In 1981-1982, there was “The Laffer Curve,” a theoretical model in economics that suggests there’s an optimal tax rate that maximizes government revenue, with revenue falling at both very high and very low tax rates. Yet despite all of the brainpower assisting Reagan, after two years of soaring interest rates and falling polling numbers, the Reagan Team bailed on their anti-inflation mission and opened up the fiscal and monetary floodgates in order to salvage some respectability in the mid-term elections.

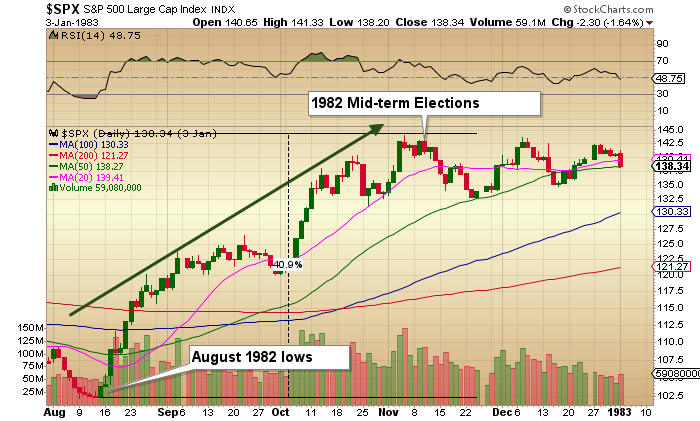
The bear market ended in 1982 a mere ten weeks before the 1982 mid-term elections with a rapid and aggressive wave of monetary easing as then Fed Chairman Paul Volcker slashed the Fed Funds rate sending the S&P 500 up 40% from the August lows to early November. Needless to say, the Republicans carried the mid-terms.

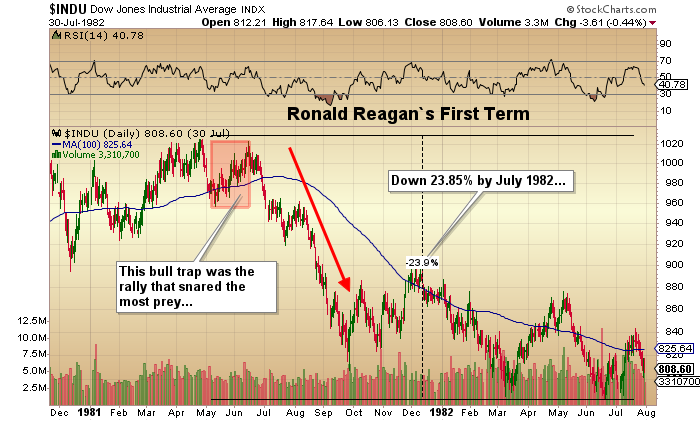
With the pullback in the DJIA, S&P 500, and the NASDAQ 100 in the past three weeks, it closely resembles the end of the Reagan “honeymoon period,” which stretched from election day 1980 until May of 1982. When the bloom came of the rose in May of 1982, it triggered a nasty bear market that lasted for fifteen long months, and while it wasn’t nearly as long or as arduous as the 1973-1974 bear, the interest rate crunch bankrupted many individuals and corporations that were carrying inordinate amounts of debt.

Here in 2025, it is the government of the U.S.A. and certain commercial real estate borrowers that are carrying inordinate amounts of debt while the average household and majority of corporate balance sheets are in relatively good shape. However, as happened in 1981-1982, the Reagan-esque “new morning in America” that Trump 2.0 promised in the form of “Make America Great Again” is threatening to be preceded by “The Nightmare on Wall Street” as the fiscal juice that kept the economy chugging along through most of 2024 has now ended leaving Scott Bessent with a very ugly balance sheet and some US$8 trillion of refinancing to pull off in an environment where the usual foreign buyers of U.S. Treasuries are being hit or threatened with tariffs.

Good luck with that, Scott. . .

I stick to my call that the current market outlook is a repeat of May 1982 and based upon the 117-point SPX reflex rally on Friday, this next 2-3 weeks could be the same bull trap that snared so much prey back in May 1982 before the ravenous bear started to feast in earnest. From a tactical viewpoint, last week I covered all shorts with put positions being sold as the SPY April $600 puts went from $8.00 to $38 in three short weeks.

As you have all heard many times before, “In a bull market, you are either flat or long or very long, but you are not short.” If SPX 6,147 was THE top, then the correct move is to wait for the rally to run out of gas and then short it. However, thus far, the SPX:US is only in correction mode, which does not rule out new all-time highs. Furthermore, because this decline has been triggered by the White House policy initiatives, any moderation in the bearish rhetoric could send stocks screaming back to their February highs in very short order. For now, stay pat, stay liquid, and focus on this emerging bull market in the metals.

Metals

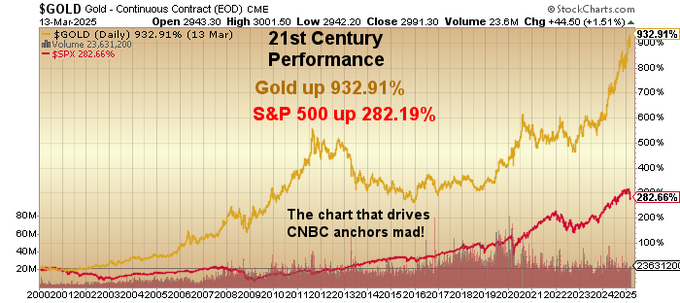
As much as CNBC would like to ignore the chart posted on page one showing the superior performance of gold since the Turn of the Century, if my portfolio is any indication, owning the metals has been the best trade to begin a year since 2001.

Record highs on gold with copper close behind and silver threatening a break-out. Even the juniors are now starting to capture a little of the love that has been reserved for technology and “meme” stocks.

Surprisingly, when you surf around on “X” (Twitter) or YouTube, you find interview after interview and story after story on gold and silver, but outside of Robert Friedland, there is literally nothing on copper.

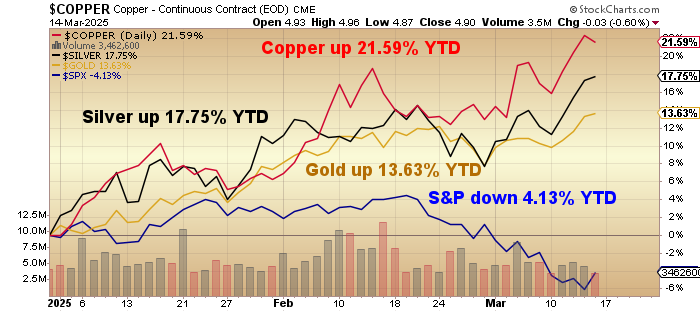
Then you look up at the 2025 year-to-date performance figure, and out in front leading the charge is good ol’ Dr. Copper, up 21.59% YTD versus 17.75% for silver, 13.63% for gold, and minus 4.13% for the S&P 500.

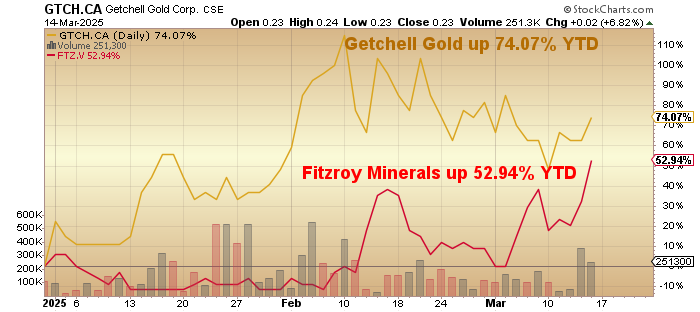
My two largest positions just happen to be in two junior developers (Getchell Gold Corp. (GTCH:CSE; GGLDF:OTCQB) and Fitzroy Minerals Inc. (FTZ:TSX.V; FTZFF:OTCQB)) and with one developing (and expanding) a 2.317 million-ounce gold deposit in Nevada while the other has multiple copper projects in Chile, the world’s largest producer of the red metal. I am scanning the landscape for a new silver name, and I think I have found one that is relatively unknown and under-owned, which means it has upside potential.

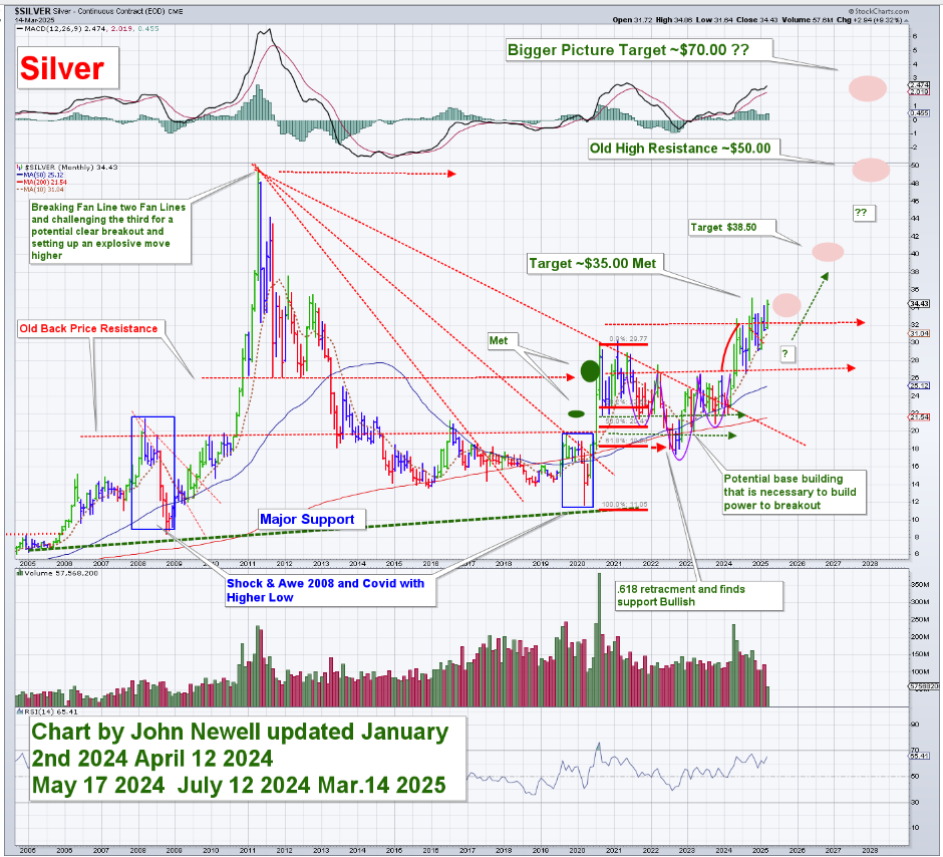
However, until silver can scale that mountain of resistance between here and US$35.07, I am sidelined silver but happily long the copper and gold combo that have served us so well in 2025.

Remember that old adage from the School of Successful Stock Promotion: “Hang on to your cat, your coat, and your girlfriend; there ain’t no fever like gold fever!”

Copper may wish to dissent. . .


Important Disclosures:

  1. As of the date of this article, officers and/or employees of Streetwise Reports LLC (including members of their household) own securities of Getchell Gold Corp. and Fitzroy Minerals Inc.
  2. Michael Ballanger: I, or members of my immediate household or family, own securities of: All. My company has a financial relationship with: All.  I determined which companies would be included in this article based on my research and understanding of the sector.
  3. Statements and opinions expressed are the opinions of the author and not of Streetwise Reports, Street Smart, or their officers. The author is wholly responsible for the accuracy of the statements. Streetwise Reports was not paid by the author to publish or syndicate this article. Streetwise Reports requires contributing authors to disclose any shareholdings in, or economic relationships with, companies that they write about. Any disclosures from the author can be found  below. Streetwise Reports relies upon the authors to accurately provide this information and Streetwise Reports has no means of verifying its accuracy.
  4.  This article does not constitute investment advice and is not a solicitation for any investment. Streetwise Reports does not render general or specific investment advice and the information on Streetwise Reports should not be considered a recommendation to buy or sell any security. Each reader is encouraged to consult with his or her personal financial adviser and perform their own comprehensive investment research. By opening this page, each reader accepts and agrees to Streetwise Reports’ terms of use and full legal disclaimer. Streetwise Reports does not endorse or recommend the business, products, services or securities of any company.

For additional disclosures, please click here.

Michael Ballanger Disclosures

This letter makes no guarantee or warranty on the accuracy or completeness of the data provided. Nothing contained herein is intended or shall be deemed to be investment advice, implied or otherwise. This letter represents my views and replicates trades that I am making but nothing more than that. Always consult your registered advisor to assist you with your investments. I accept no liability for any loss arising from the use of the data contained on this letter. Options and junior mining stocks contain a high level of risk that may result in the loss of part or all invested capital and therefore are suitable for experienced and professional investors and traders only. One should be familiar with the risks involved in junior mining and options trading and we recommend consulting a financial adviser if you feel you do not understand the risks involved.

Silver Tarnished No More

Source: John Newell

John Newell of John Newell & Associates answers the question: is silver poised for a dramatic move higher?

A Case for Silver’s Rise

Silver has long been a precious metal that plays a dual role: a store of value and an industrial commodity. With recent economic trends and historical patterns, the case for a significant price increase in silver is becoming more compelling.

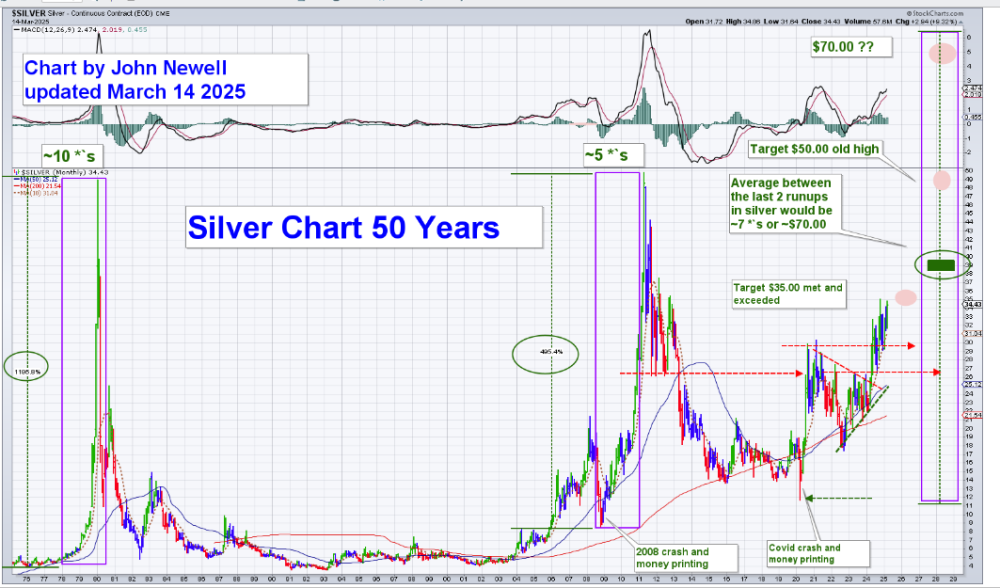
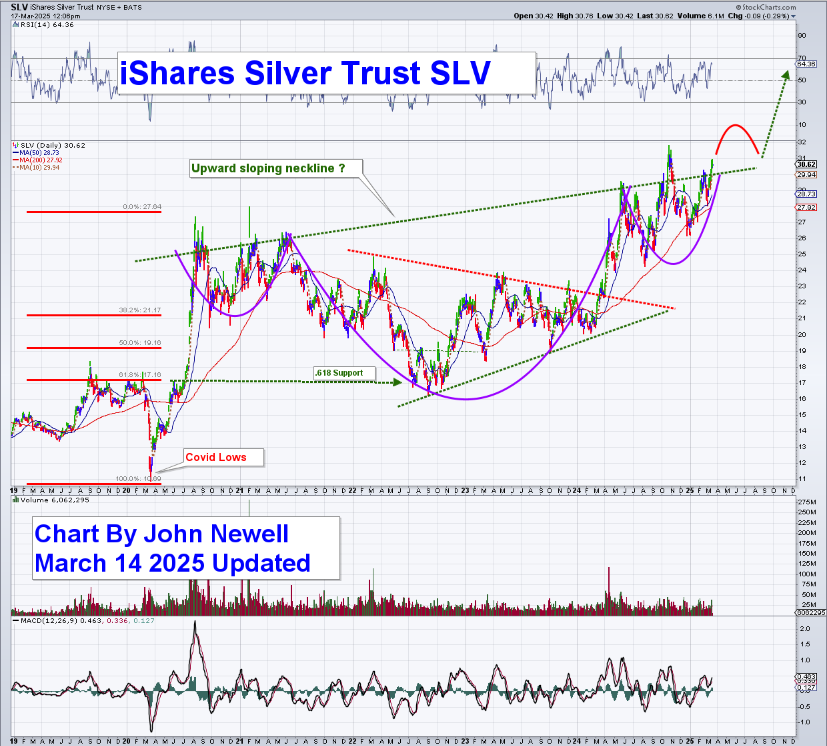
Below, we outline key fundamental reasons why silver could be on the verge of a dramatic move higher, supported by two charts, one short-term and one long-term, illustrating its potential trajectory.

Technical: Silver Hits $35, Is $50 Next? And a March towards $70

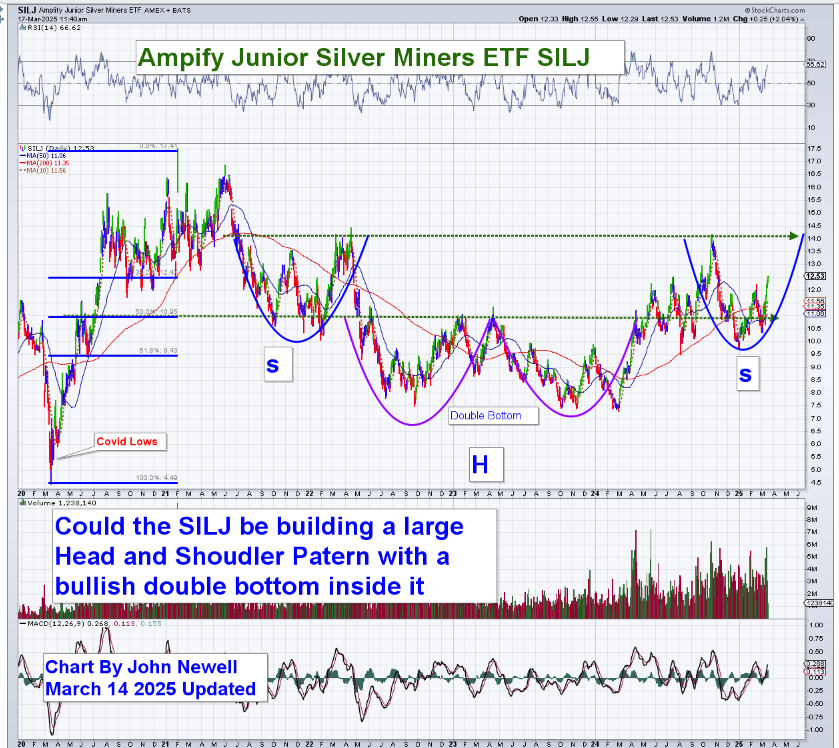
The shorter-term chart shows that silver has recently achieved its $35 target and is building momentum toward higher levels.

Historically, when silver entered strong uptrends, it experienced parabolic moves. Looking at the past two major silver bull runs, if the metal were to repeat even an average of these moves (7x from its lows), silver could trade at $70 per ounce.

The long-term 50-year chart further strengthens this thesis. In previous major price surges, most notably in the late 1970s and 2010-2011, silver saw exponential growth over relatively short periods.

Given the similarities in today’s economic conditions to those times, there is reason to believe silver could be gearing up for another major bull cycle.

Fundamental Reasons for Silver’s Rise

  1. Hedge Against Inflation

Silver, like gold, is a well-known hedge against inflation. With rising inflation concerns and central banks continuing to lose monetary policies, silver provides a means to preserve purchasing power. Historically, when inflation accelerates, precious metals tend to perform well.

  1. Growing Industrial Demand

Unlike gold, silver is an essential industrial metal with applications in:

Electronics: Silver is used in high-performance electronic devices due to its superior conductivity.

Solar Panels: The renewable energy push is expected to drive increased demand for silver in solar technology.

Medical Uses: Silver’s antibacterial properties make it vital in the medical industry. As global industries expand and modernize, silver’s demand is expected to rise, creating upward pressure on prices.

  1. Affordability and Accessibility

Compared to gold, silver remains much more affordable. This makes it an attractive investment for a wider range of investors, particularly in emerging markets where gold prices may be out of reach for many. If gold continues to rise, silver could see increased inflows as an alternative store of value.

  1. Portfolio Diversification

Silver provides diversification benefits as it often moves independently from traditional asset classes such as stocks and bonds. In uncertain times, investors flock to safe-haven assets like silver, reducing overall portfolio risk.

  1. Market Volatility and Economic Uncertainty

Silver has historically performed well during periods of economic instability. If global markets experience turmoil—whether from geopolitical events, recession fears, or monetary instability, silver could benefit as a safe-haven asset.

Ways to Participate in Silver’s Potential Upside

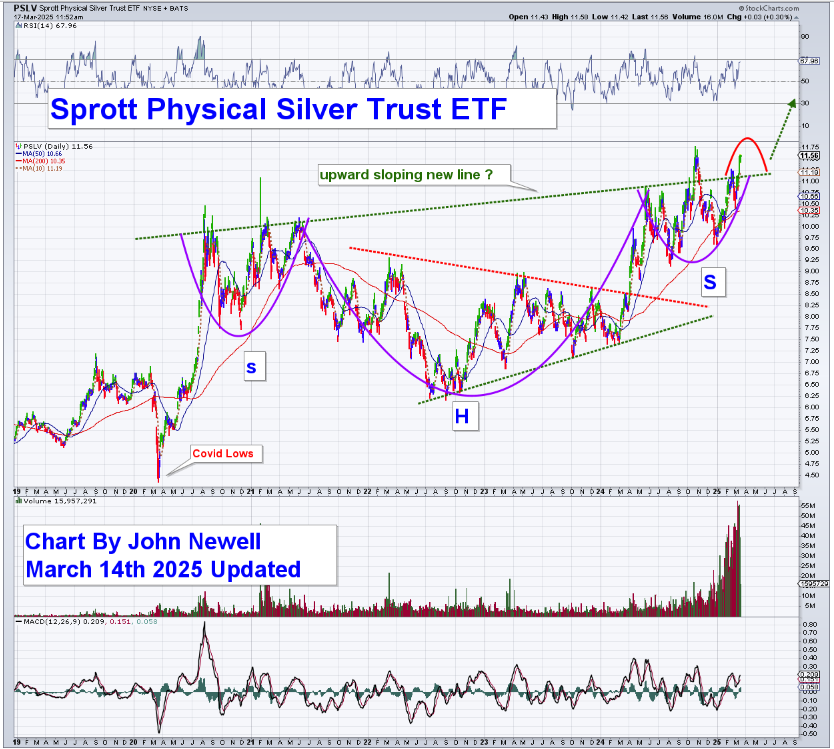
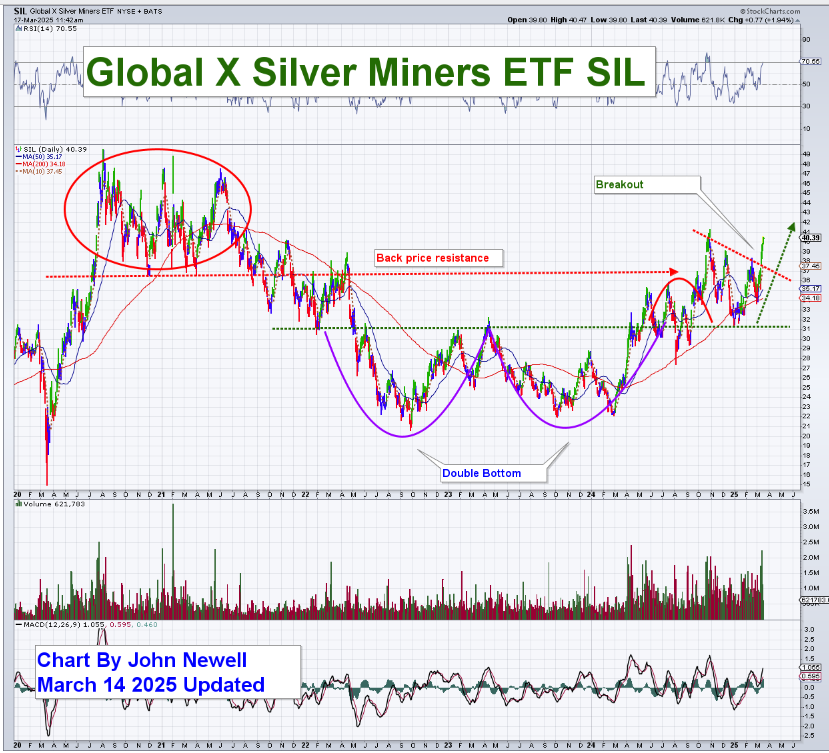
While buying physical silver in the form of coins or bars is a traditional method of investing, there are other ways to gain exposure to silver’s expected price appreciation. Exchange-traded funds (ETFs) offer a convenient alternative:

SLV (iShares Silver Trust): The largest silver ETF, holding physical silver. It provides a direct investment in silver without needing to store it.

Sprott Physical Silver Trust (PSLV): Another option for direct silver exposure, backed by physical silver held in secure vaults.

SIL (Global X Silver Miners ETF): Holds shares in approximately 33 silver mining companies, allowing investors to gain exposure to the industry.

SILJ (Amplify Junior Silver Miners ETF): Tracks small-cap companies primarily engaged in silver mining, exploration, and development, providing leveraged exposure to silver price movements.

Additionally, several silver mining companies are currently trading at low price-to-earnings (P/E) ratios. As the silver price rises, these companies could experience a leveraged effect, potentially amplifying returns for investors.

A Modern ‘Hunt Brothers’ Scenario?

In the late 1970s, the Hunt brothers attempted to corner the silver market, causing prices to skyrocket. While modern regulations prevent such extreme market manipulation, a global shift in investor sentiment could replicate similar price movements.

Imagine a scenario where large populations, such as those in BRICS nations, turn to silver as an alternative to gold. If gold becomes prohibitively expensive for average investors, silver could become their precious metal of choice.

Potential Outcomes of a Global Silver Rush:

Surging Prices: Increased demand from millions of investors could push silver prices significantly higher.

Increased Market Volatility: Rapid price increases may lead to volatile market conditions.

Silver Mining Stocks Boom: Companies producing silver could see substantial gains.

Industrial Costs Rise: Industries reliant on silver (e.g., solar panels and electronics) could face higher production costs.

Regulatory Intervention: Governments and financial institutions may take action to stabilize the market.

Conclusion: Silver’s Future Looks Bright

Given silver’s role as an inflation hedge, its growing industrial demand, and its affordability compared to gold, there are strong fundamental reasons for its price to rise significantly.

Technically, the metal has reached its $35 target and appears to be building momentum toward higher levels. If history is any guide, a move toward $50, and even $70, is well within the realm of possibility.

For investors looking to position themselves in an asset with significant upside potential, silver presents a compelling opportunity in today’s economic landscape.

The link to a previous article on the fundamentals of silver can be found here.


Important Disclosures:

  1. Statements and opinions expressed are the opinions of the author and not of Streetwise Reports, Street Smart, or their officers. The author is wholly responsible for the accuracy of the statements. Streetwise Reports was not paid by the author to publish or syndicate this article. Streetwise Reports requires contributing authors to disclose any shareholdings in, or economic relationships with, companies that they write about. Any disclosures from the author can be found  below. Streetwise Reports relies upon the authors to accurately provide this information and Streetwise Reports has no means of verifying its accuracy.
  2. This article does not constitute investment advice and is not a solicitation for any investment. Streetwise Reports does not render general or specific investment advice and the information on Streetwise Reports should not be considered a recommendation to buy or sell any security. Each reader is encouraged to consult with his or her personal financial adviser and perform their own comprehensive investment research. By opening this page, each reader accepts and agrees to Streetwise Reports’ terms of use and full legal disclaimer. Streetwise Reports does not endorse or recommend the business, products, services or securities of any company.

For additional disclosures, please click here.

John Newell Disclaimer

As always it is important to note that investing in precious metals like silver carries risks, and market conditions can change violently with shock and awe tactics, that we have seen over the past 20 years. Before making any investment decisions, it’s advisable consult with a financial advisor if needed. Also the practice of conducting thorough research and to consider your investment goals and risk tolerance.

The push to restore semiconductor manufacturing faces a labor crisis − can the US train enough workers in time?

By Michael Moats, Missouri University of Science and Technology 

Semiconductors power nearly every aspect of modern life – cars, smartphones, medical devices and even national defense systems. These tiny but essential components make the information age possible, whether they’re supporting lifesaving hospital equipment or facilitating the latest advances in artificial intelligence.

It’s easy to take them for granted, until something goes wrong. That’s exactly what happened when the COVID-19 pandemic exposed major weaknesses in the global semiconductor supply chain. Suddenly, to name just one consequence, new vehicles couldn’t be finished because chips produced abroad weren’t being delivered. The semiconductor supply crunch disrupted entire industries and cost hundreds of billions of dollars.

The crisis underscored a hard reality: The U.S. depends heavily on foreign countries – including China, a geopolitical rival – to manufacture semiconductors. This isn’t just an economic concern; it’s widely recognized as a national security risk.

That’s why the U.S. government has taken steps to invest in semiconductor production through initiatives such as the CHIPS and Science Act, which aims to revitalize American manufacturing and was passed with bipartisan support in 2022. While President Donald Trump has criticized the CHIPS and Science Act recently, both he and his predecessor, Joe Biden, have touted their efforts to expand domestic chip manufacturing in recent years.

Yet, even with bipartisan support for new chip plants, a major challenge remains: Who will operate them?

Minding the workforce gap

The push to bring semiconductor manufacturing back to the U.S. faces a significant hurdle: a shortage of skilled workers. The semiconductor industry is expected to need 300,000 engineers by 2030 as new plants are built. Without a well-trained workforce, these efforts will fall short, and the U.S. will remain dependent on foreign suppliers.

This isn’t just a problem for the tech sector – it affects every industry that relies on semiconductors, from auto manufacturing to defense contractors. Virtually every military communication, monitoring and advanced weapon system relies on microchips. It’s not sustainable or safe for the U.S. to rely on foreign nations – especially adversaries – for the technology that powers its military.

For the U.S. to secure supply chains and maintain technological leadership, I believe it would be wise to invest in education and workforce development alongside manufacturing expansion.

Building the next generation of semiconductor engineers

Filling this labor gap will require a nationwide effort to train engineers and technicians in semiconductor research, design and fabrication. Engineering programs across the country are taking up this challenge by introducing specialized curricula that combine hands-on training with industry-focused coursework.

Future semiconductor workers will need expertise in chip design and microelectronics, materials science and process engineering, and advanced manufacturing and clean room operations. To meet this demand, it will be important for universities and colleges to work alongside industry leaders to ensure students graduate with the skills employers need. Offering hands-on experience in semiconductor fabrication, clean-room-based labs and advanced process design will be essential for preparing a workforce that’s ready to contribute from Day 1.

At Missouri University of Science of Technology, where I am the chair of the materials science and engineering department, we’re launching a multidisciplinary bachelor’s degree in semiconductor engineering this fall. Other universities across the U.S. are also expanding their semiconductor engineering options amid strong demand from both industry and students.

A historic opportunity for economic growth

Rebuilding domestic semiconductor manufacturing isn’t just about national security – it’s an economic opportunity that could benefit millions of Americans. By expanding training programs and workforce pipelines, the U.S. can create tens of thousands of high-paying jobs, strengthening the economy and reducing reliance on foreign supply chains.

And the race to secure semiconductor supply chains isn’t just about stability – it’s about innovation. The U.S. has long been a global leader in semiconductor research and development, but recent supply chain disruptions have shown the risks of allowing manufacturing to move overseas.

If the U.S. wants to remain at the forefront of technological advancement in artificial intelligence, quantum computing and next-generation communication systems, it seems clear to me it will need new workers – not just new factories – to gain control of its semiconductor production.The Conversation

About the Author:

Michael Moats, Professor of Metallurgical Engineering, Missouri University of Science and Technology

This article is republished from The Conversation under a Creative Commons license. Read the original article.


Week Ahead: USDJPY set for Wednesday showdown

By ForexTime 

  • Yen expected to be one of the most volatile in G10 space vs USD
  • BoJ and Fed seen holding rates, but policy hints could spark volatility
  • Over past year BoJ triggered moves of ↑ 1.4% & ↓ 1.5%
  • Over past year Fed triggered moves of ↑ 0.7% & ↓ 1.2%
  • Bloomberg FX model: USDJPY has 72% of trading within 146.26 – 151.17 over 1-week period

A flurry of major central bank meetings could present fresh trading opportunities.

The Japanese Yen is expected to be one of the most volatile G10 currencies versus the USD over the next one-week.

This could be based on the Bank of Japan and the Federal Reserve holding policy meetings on the same day!

Beyond central banks, top-tier economic data and global trade developments will be in focus:

Monday, 17th March 

  • CN50: China property prices, retail sales, industrial production
  • CAD: Canada housing starts, existing home sales
  • US500: US retail sales, Empire manufacturing
  • OECD report – prospects for global economy

Tuesday, 18th March

  • CAD: Canada CPI
  • GER40: Germany ZEW survey expectations
  • JP225: Japan tertiary index
  • USDInd: US housing starts, industrial production

Wednesday, 19th March 

  • CHINAH: Tencent earnings
  • EU50: Eurozone CPI
  • ZAR: South Africa retail sales, CPI
  • JPY: BoJ rate decision, industrial production, trade
  • USDInd: Fed rate decision

Thursday, 20th March 

  • AUD: Australia unemployment
  • CN50: China loan prime rates
  • ZAR: SARB rate decision
  • SEK: Riksbank rate decision 
  • CHF: SNB rate decision
  • GBP: BoE rate decision, jobless claims, unemployment
  • RUS2000: US Philadelphia Fed factory index, jobless claims

Friday, 21st  March 

  • CAD: Canada retail sales
  • EUR: Eurozone consumer confidence
  • JPY: Japan CPI
  • NZD: New Zealand trade

At the time of writing, the  Yen depreciated across the board despite Japan’s largest labour union – Rengo securing a 5.46% average gain, its largest pay hike since 1991. This could be a “sell the news” scenario with prices stabilizing down the line.

Nevertheless, the Yen is the 3rd best performing G10 currency versus the dollar year-to-date. These gains are on the back of global trade fears and growing bets around the BoJ hiking rates sooner rather than later.

Looking at the weekly charts, the USDJPY is respecting a bearish channel – but support can be seen at 146.50. 

With all the above said, here is why the USDJPY is set for a big week:

    1 – Trump’s trade war

President Donald Trump’s aggressive stance on trade has roiled markets, sending investors rushing toward safe-haven assets.

Trump recently threatened a 200% tariff on European alcohol after the EU imposed tariffs on US-produced whiskey. 

  • Escalating trade tensions could boost the Japanese Yen – dragging the USDJPY lower. 
  • Signs of easing trade tensions may lift the market mood – pushing the USDJPY higher as the Yen weakens.


    2- BoJ rate decision

Markets widely expect the BoJ to leave interest rates unchanged at its meeting on Wednesday 19th March. 

But if the BoJ hints at a potential hike as soon as May or in the first half of 2025 in the face of higher wages, this could move the Yen.

To be clear, traders are currently pricing in a 16% probability of a 25-basis point hike by May with this jumping to 48% by June. 

Over the past 12 months, the BoJ decision has triggered upside moves as much as 1.4% or declines of 1.5% in a 6-hour window post-release.

Note: Beyond the BoJ decision, Japan’s latest inflation print later in the week could influence BoJ hike bets – moving the Yen as a result.

  • The USDJPY could tumble if the BoJ hints that rates will be hiked in May or June.
  • Should the BoJ strike a dovish tone, this could push the USDJPY higher as the Yen weakens.


    3 – Fed rate decision

The Federal Reserve is seen leaving interest rates unchanged at its meeting on Wednesday, 19th March.

So, all eyes will be on Fed Chair Jerome Powell’s press conference for clues on future policy moves. Last Friday, Powell stated that the US economy was in a good place despite the elevated levels of uncertainty. However, investors remain fearful of Trump’s trade war hitting the US economy.

Traders are currently pricing in a 35% probability of a 25-basis point cut by May with a move fully priced in by June. 

Over the past 12 months, the Fed decision has triggered upside moves as much as 0.7% or declines of 1.2% in a 6-hour window post-release.

  • If Powell strikes a cautious tone towards rate hikes, the USDJPY may slip.
  • Should Powell signal higher rates down the road, this could push the USDJPY higher.


    4 – Technical forces

The USDJPY has shed over 1% month-to-date with prices trading below the 50, 100 and 200-day SMA.

  • A breakout and daily close above 149.00 may signal a move toward 150.80 and 151.17 – the upper limit of the Bloomberg FX model.
  • Sustained weakness below 149.00 could trigger a selloff back toward 146.50 and 146.26 – the lower limit of the Bloomberg FX model.

Bloomberg’s FX model forecasts a 73% chance that USDJPY will trade within the 146.26 – 151.17 range, using current levels as a base, over the next one-week period.


Forex-Time-LogoArticle by ForexTime
ForexTime Ltd (FXTM) is an award winning international online forex broker regulated by CySEC 185/12 www.forextime.com

Gold vs. the Dow: The 100-Year Truth Investors Overlook

Source: John Newell (3/3/25)

John Newell of John Newell & Associates shares his thoughts on where the gold market is headed. Newell also updates us on two stocks he has previously spoken about.

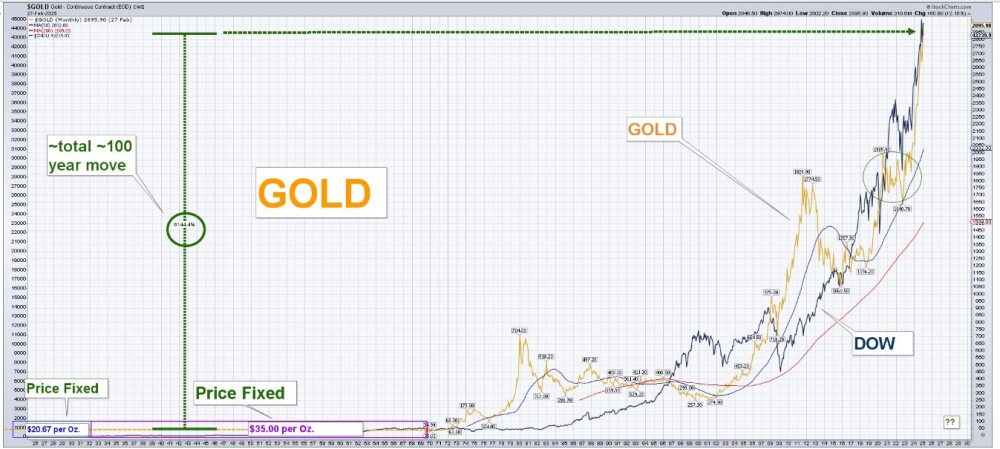
For decades, the Dow Jones Industrial Average has been hailed as the ultimate benchmark for long-term investing success. Investors, analysts, and financial media constantly praise its performance, often portraying it as the premier wealth-building vehicle. But there’s a catch: unlike gold, the Dow is not a constant.

Over the past century, underperforming companies in the Dow have been quietly removed and replaced with stronger performers. Once-prominent names like Union Carbide and Massey Ferguson were left behind as the index evolved to maintain its upward trajectory. This constant reshuffling ensures the Dow always reflects a select group of thriving businesses, making it seem like an unbeatable long-term investment.

Now, let’s compare that to gold. Unlike the Dow, gold doesn’t change. It has been a store of value for thousands of years, immune to corporate failures, economic shifts, and index rebalancing tricks.

Yet, despite all the noise about the Dow’s strength, gold has actually performed just as well, if not better, over the past 100 years.

The attached chart above illustrates a remarkable reality: gold has kept pace with the Dow over the long run despite being dismissed as a relic by mainstream finance. From its fixed price of $20.67 per ounce in the early 1900s, before President Roosevelt changed the fix in 1933 to $35.00 and prohibited U.S. investors from holding gold, savvy investors responded by doing the next best thing: investing in gold properties north of the border, in Canada’s prolific goldfields. This wave of capital helped fuel exploration booms that led to some of the most significant gold discoveries in North America.

That represents a move of over 10,000%, comparable to the Dow’s ascent, without the benefit of removing underperformers along the way. The narrative that gold is an “old-fashioned” or a “pet rock” investment, while the Dow represents the future, simply doesn’t hold up to scrutiny.

This begs the question: If gold has matched the performance of an ever-evolving index, what happens when gold’s true monetary role reasserts itself in an era of extreme money printing, debt expansion, and de-dollarization?

With gold prices at record highs and institutional investors taking notice, we may be entering a new phase where gold not only keeps pace with the Dow but decisively outperforms it.

Update on Goliath Resources (See Previous Article Here)

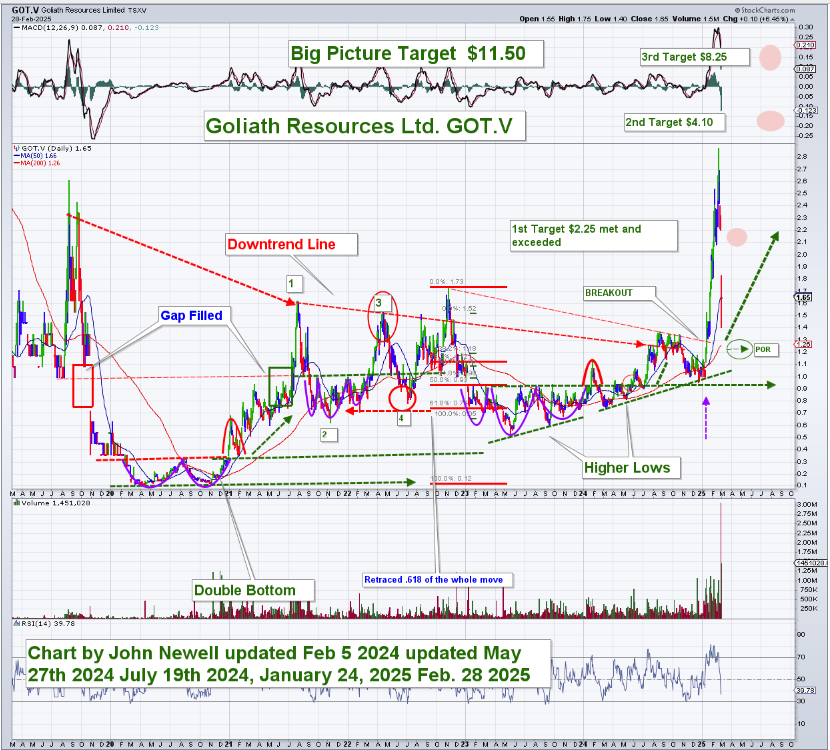
Goliath Resources Ltd. (GOT:TSX.V; GOTRF:OTCQB; B4IF; FSE) is a junior resource exploration company advancing high-grade precious metal projects in the prolific Golden Triangle and northwestern areas of British Columbia.

The company is on track with a new discovery of a large high-grade gold system at its Golddigger property. The Surebet discovery, previously covered by glaciers and permanent snowpack, has now been exposed and drilled for the first time. The project is located in a world-class geological setting and mining-friendly jurisdiction. The Golddigger property sits on tidewater and has excellent infrastructure, including a permitted mill site in Kitsault nearby.

Significant shareholders include Crescat Capital, Eric Sprott, Rob McEwen, and a global commodity group based in Singapore. Dr. Quinton Hennigh serves as a technical advisor. Since our last article on Goliath Resources Ltd. (GOT.V), the company has exceeded its first price target of $2.25, demonstrating strong technical and fundamental performance. The breakout from its long-term downtrend and the series of higher lows have reinforced its upward momentum. The stock is now advancing toward its second target of $4.10, with an ultimate big-picture target of $11.50.

The company’s fundamentals remain robust, driven by high-grade gold discoveries and increasing investor interest in the junior mining sector. While pullbacks are natural in any bull run, Goliath’s technical setup continues to support further upside, making it a compelling stock to watch in the gold exploration space.

Update on First Nordic Minerals (See Previous Article Here )

First Nordic Metals Corp. (FNM:TSX; FNMCF:OTCQB) is a Canadian-based gold exploration company consolidating assets in Sweden and Finland to create Europe’s next major gold camp. The company’s flagship asset in northern Sweden is the Barsele Gold Project, a joint venture with senior gold producer Agnico Eagle Mines Limited. Surrounding Barsele, First Nordic owns a 100% district-scale land package that includes the Paubäcken and Storjuktan projects, covering 104,000 hectares on the Gold Line Belt. Additionally, in northern Finland, First Nordic owns the entire Oijärvi Greenstone Belt, including the Kylmäkangas Au-Ag deposit, the largest known gold occurrence in the region.

“2024 was a defining year for First Nordic as we laid the groundwork to become a leading gold explorer and developer. Receiving the TSX Venture 50 award is a testament to our team’s execution on driving growth through strategic acquisitions and project advancements, as well as the support of key shareholders and industry partners. Sweden and Finland globally rank among the most attractive, underexplored, and exciting regions for mineral exploration right now. With a strong resource base and a fully funded, extensive drill program on multiple high-potential targets, we are poised for an exciting 2025 as we continue to advance Europe’s next gold camp.”

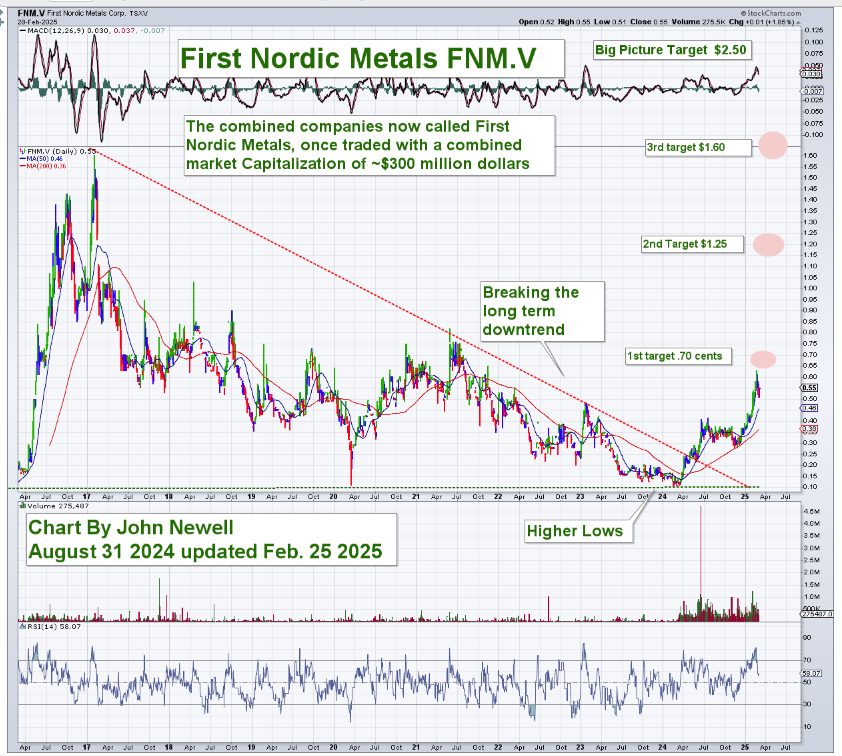
First Nordic Metals has also shown significant progress, coming close to achieving its first target of $0.70. The stock has successfully broken out of its long-term downtrend, confirming a bullish reversal pattern. Higher lows and increasing volume indicate strong accumulation, setting the stage for continued gains.

With a combined historical market capitalization of approximately $300 million, First Nordic has substantial upside potential. The next targets of $1.25 and $1.60 remain well within reach, supported by improving sentiment in the gold sector and the company’s expanding exploration portfolio.

Are Investors Ready for This Reality?

At $3,000 per ounce, we might just see the public dipping pie plates into gold-bearing streams across this great land called Canada. The stage is set for a renewed gold rush, and those paying attention to the junior mining sector could be positioned for substantial gains.

As history has shown, when the gold market heats up, Canadian junior exploration companies have the potential to deliver exponential returns. Investors who understand this cycle and position themselves accordingly may find that gold stocks offer not only a hedge against inflation but also a path to significant wealth creation in the years ahead.


Important Disclosures:

  1. John Newell: I determined which companies would be included in this article based on my research and understanding of the sector.
  2. Statements and opinions expressed are the opinions of the author and not of Streetwise Reports, Street Smart, or their officers. The author is wholly responsible for the accuracy of the statements. Streetwise Reports was not paid by the author to publish or syndicate this article. Streetwise Reports requires contributing authors to disclose any shareholdings in, or economic relationships with, companies that they write about. Any disclosures from the author can be found  below. Streetwise Reports relies upon the authors to accurately provide this information and Streetwise Reports has no means of verifying its accuracy.
  3.  This article does not constitute investment advice and is not a solicitation for any investment. Streetwise Reports does not render general or specific investment advice and the information on Streetwise Reports should not be considered a recommendation to buy or sell any security. Each reader is encouraged to consult with his or her personal financial adviser and perform their own comprehensive investment research. By opening this page, each reader accepts and agrees to Streetwise Reports’ terms of use and full legal disclaimer. Streetwise Reports does not endorse or recommend the business, products, services or securities of any company.

For additional disclosures, please click here.

John Newell Disclaimer

As always it is important to note that investing in precious metals like silver carries risks, and market conditions can change violently with shock and awe tactics, that we have seen over the past 20 years. Before making any investment decisions, it’s advisable consult with a financial advisor if needed. Also the practice of conducting thorough research and to consider your investment goals and risk tolerance.

Source: https://www.streetwisereports.com/article/2025/03/03/gold-vs-the-dow-the-100-year-truth-investors-overlook.html?m_t=2025_03_03_10_37_20

Top Companies on Stocks Watchlist include Industrials & Utilities

By InvestMacro Research

The first quarter of 2025 is cruising along and we wanted to highlight some recent companies that have been added to our Cosmic Rays Watchlist, according to earnings data from last quarter. This week’s companies include a few industrial companies as well as a utility and a consumer discretionary stock.

The Cosmic Rays Watchlist is the output from our proprietary fundamental analysis algorithm. The algo examines company fundamental metrics, earnings trends and overall sector strength trends. The aim is identify quality dividend-paying companies on the NYSE and Nasdaq stock exchanges. If a company scores over 50, it gets added to our Watchlist for further analysis.

We use this system as a stock market ideas generator and to update our Watchlist every quarter. However, be aware the fundamental system does not take the stock price as a direct element in our rating so one must compare each idea with their current stock prices (this is not a timing tool).

Many studies are consistently showing overvalued markets and that has to be taken into consideration with any stock market idea. As with all investment ideas, past performance does not guarantee future results. A stock added to our list is not a recommendation to buy or sell the security.

Here we go with 5 Stocks scored in 2025:


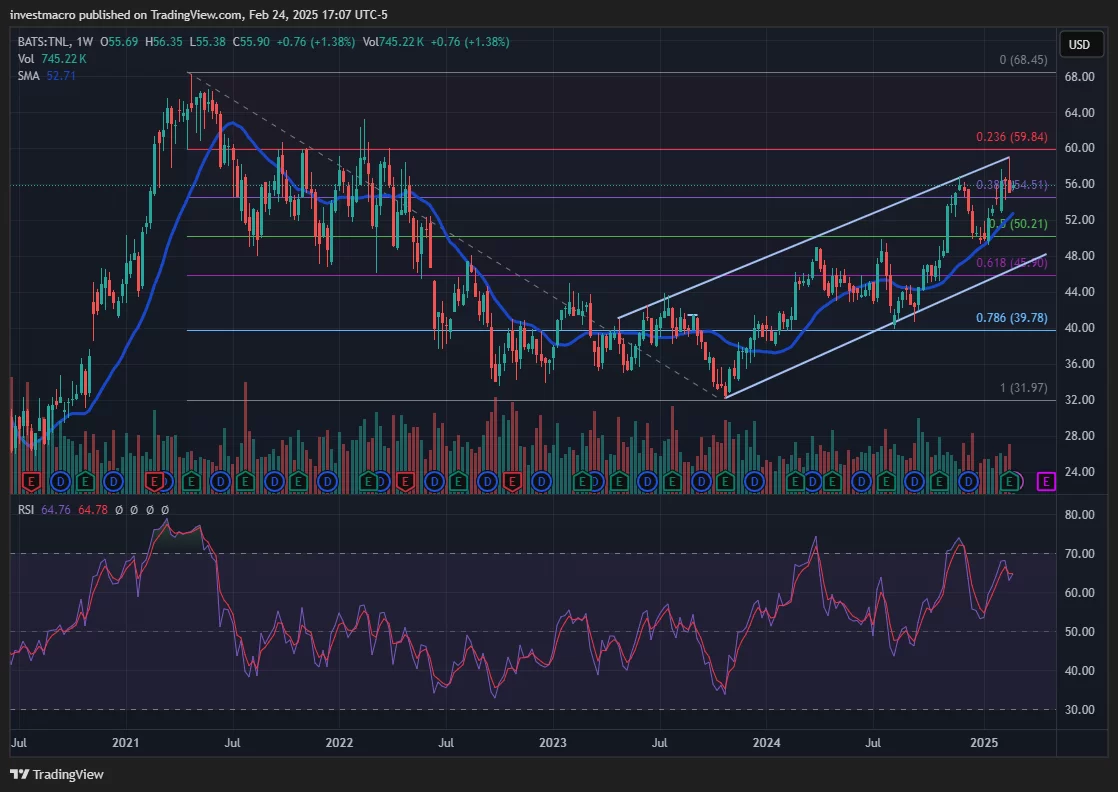
Travel + Leisure Co. (TNL):

Travel + Leisure Co. (Symbol: TNL) was recently added to our Cosmic Rays WatchList. TNL scored a 55 in our fundamental rating system on February 20th.

At time of writing, only 7.93% of stocks have scored a 50 or better out of a total of 11,665 scores in our earnings database. This stock has made our Watchlist a total of 6 times over the years and rose by 9 system points from our last update. TNL is a Medium Cap stock and part of the Consumer Cyclical sector. The industry focus for TNL is Travel Services.

TNL has beat earnings-per-share expectations for four consecutive quarters and has a dividend of close to 3.50 percent with a payout ratio near 35 percent. The TNL stock price has outperformed the Consumer Discretionary Sector benchmark over the past 52 weeks with a 36.91 percent rise compared to the 24.92 benchmark return.

Company Description (courtesy of SEC.gov):

Travel + Leisure Co., together with its subsidiaries, provides hospitality services and products in the United States and internationally. The company operates in two segments, Vacation Ownership; and Travel and Membership. The Vacation Ownership segment develops, markets, and sells vacation ownership interests (VOIs) to individual consumers; provides consumer financing in connection with the sale of VOIs; and property management services at resorts. The Travel and Membership segment operates various travel businesses, including three vacation exchange brands, travel technology platforms, travel memberships, and direct-to-consumer rentals.

Company Website: https://www.travelandleisureco.com


Asset vs Sector Benchmark:*P/E Ratio (TTM)*52-Week Price Return*Beta (S&P500)
– Stock: Travel + Leisure Co. (TNL)7.2236.911.66
– Benchmark Symbol: XLY28.1324.92


* Data through February 21, 2025


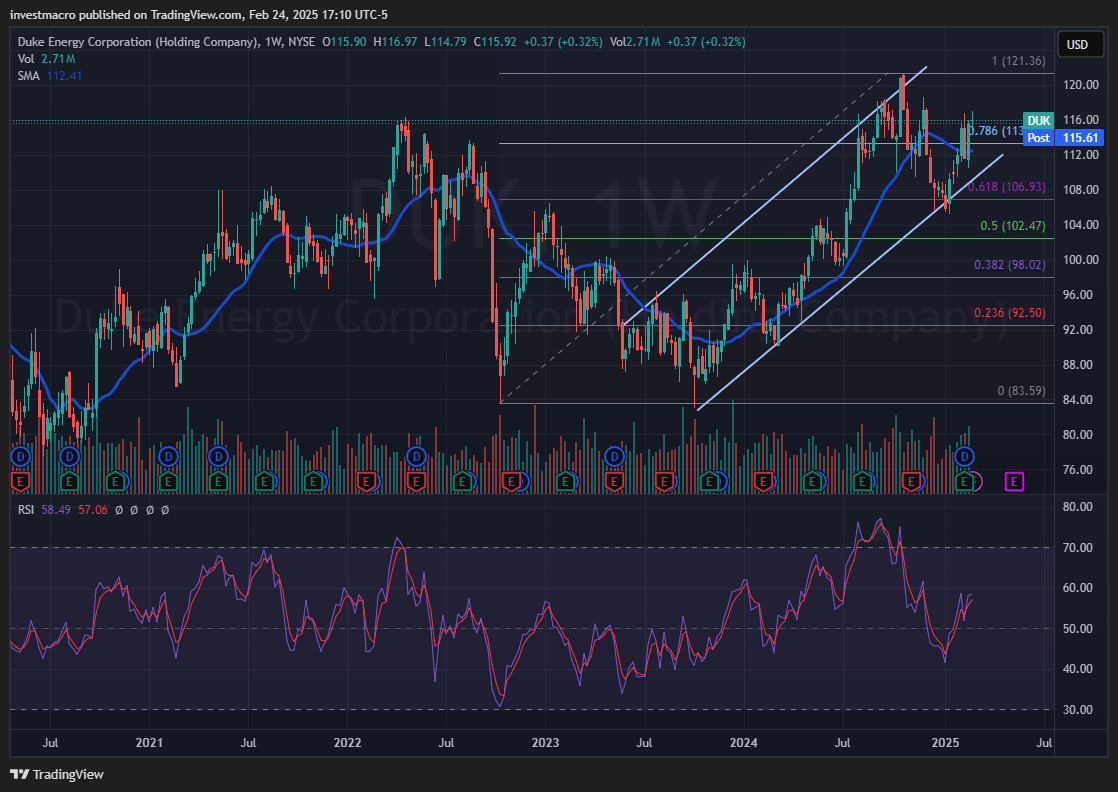
Duke Energy Corporation (DUK):

Duke Energy Corporation (Symbol: DUK) made our Watchlist with a 65 score on February 14th.

At time of writing, only 4.60% of stocks have scored a 60 or better out of a total of 11,665 scores in our earnings database. This stock has made our Watchlist a total of 3 times and rose by 33 system points from our last update. DUK is a Large Cap stock and part of the Utilities sector. The industry focus for DUK is Regulated Electric.

DUK met the earnings-per-share expectations in the latest quarter after beating eps two out of the past three quarters (with one miss). DUKE Energy has a dividend of close to 3.75 percent with a payout ratio near 70 percent. The DUK stock price has slightly under-performed the Utilities Sector benchmark over the past 52 weeks with a 24.2 percent return compared to the 30.56 benchmark return.

Company Description (courtesy of SEC.gov):

Duke Energy Corporation, together with its subsidiaries, operates as an energy company in the United States. It operates through three segments: Electric Utilities and Infrastructure, Gas Utilities and Infrastructure, and Commercial Renewables.

Company Website: https://www.duke-energy.com


Asset vs Sector Benchmark:*P/E Ratio (TTM)*52-Week Price Return*Beta (S&P500)
– Stock: Duke Energy Corporation (DUK)20.2824.20.46
– Benchmark Symbol: XLU21.0230.56


* Data through February 21, 2025


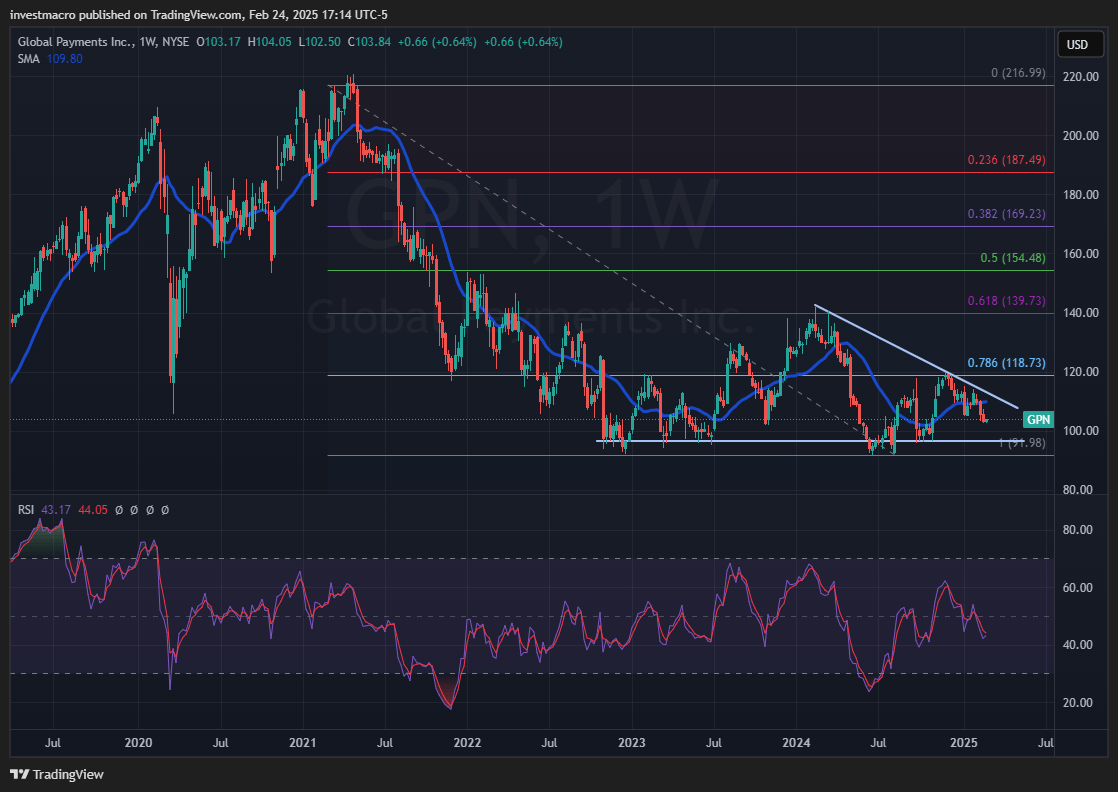
Global Payments Inc. (GPN):

Global Payments Inc. (Symbol: GPN) was added to our Cosmic Rays WatchList with a 60 score on February 14th.

At time of writing, only 4.60% of stocks have scored a 60 or better out of a total of 11,665 scores in our earnings database. This stock is on our Watchlist for the first time. GPN is a Large Cap stock and part of the Industrials sector (some sites have this stock in the Financial Services sector). The industry focus for GPN is Specialty Business Services.

GPN has beaten earnings-per-share expectations in two out of the past four quarters (although missed the past two) and has a dividend of close to 0.95 percent with a payout ratio near 16 percent. The GPN stock price has majorly under-performed the Industrials Sector benchmark over the past 52 weeks with a -20.43 percent decline compared to the 15.59 benchmark return.

Company Description (courtesy of SEC.gov):

Global Payments Inc. provides payment technology and software solutions for card, electronic, check, and digital-based payments in the Americas, Europe, and the Asia-Pacific. It operates through three segments: Merchant Solutions, Issuer Solutions, and Business and Consumer Solutions.

Company Website: https://www.globalpaymentsinc.com


Asset vs Sector Benchmark:*P/E Ratio (TTM)*52-Week Price Return*Beta (S&P500)
– Stock: Global Payments Inc. (GPN)12.40-20.430.98
– Benchmark Symbol: XLI25.8215.59


* Data through February 21, 2025


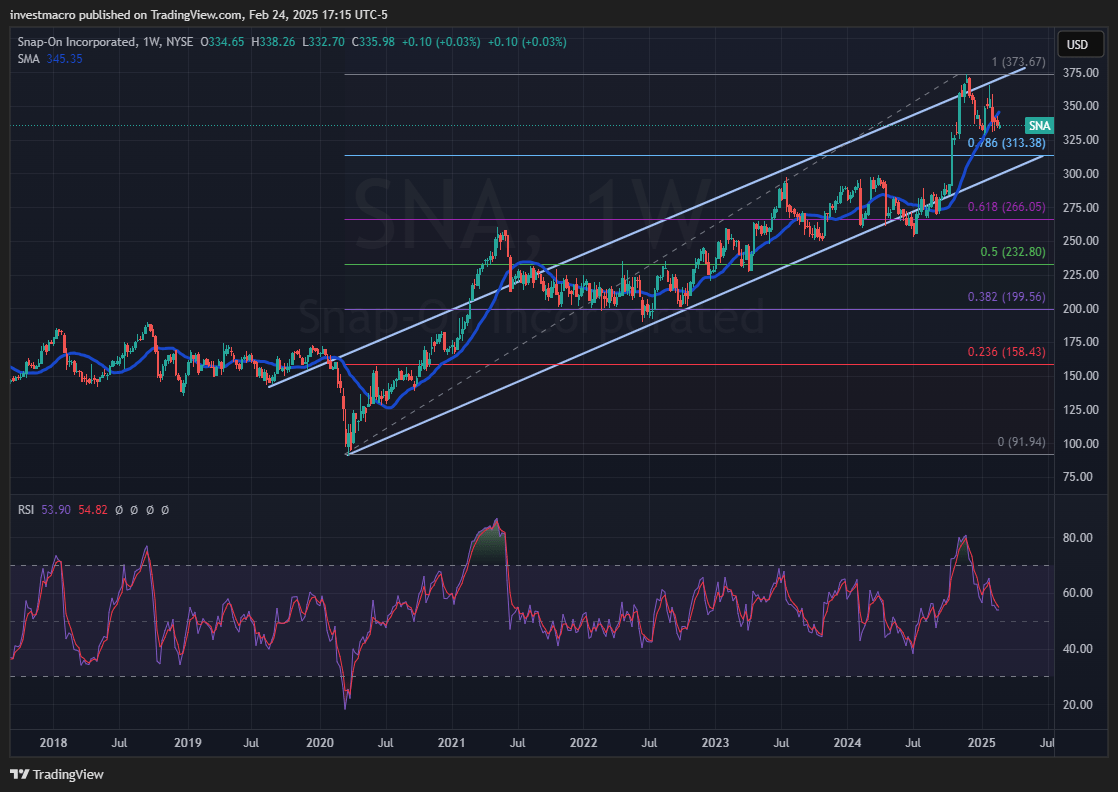
Snap-on Incorporated (SNA):

Snap-on Incorporated (Symbol: SNA) was added to our Cosmic Rays WatchList on February 8th with a 55 score in our fundamental rating system.

At time of writing, only 7.93% of stocks have scored a 50 or better out of a total of 11,665 scores in our earnings database. This stock has made our Watchlist a total of 2 times and rose by 25 system points from our last update. SNA is a Large Cap stock and part of the Industrials sector. The industry focus for SNA is Manufacturing – Tools & Accessories.

SNA has beaten its earnings-per-share expectations for four consecutive quarters including in the latest quarter. Snap On has a dividend right around 2.50 percent with a payout ratio near 45 percent. The SNA stock price has outperformed the Industrials Sector benchmark over the past 52 weeks with a 25.76 percent gain compared to the 15.59 benchmark return.

Company Description (courtesy of SEC.gov):

Snap-on Incorporated manufactures and markets tools, equipment, diagnostics, and repair information and systems solutions for professional users worldwide. It operates through Commercial & Industrial Group, Snap-on Tools Group, Repair Systems & Information Group, and Financial Services segments.

Company Website: https://www.snapon.com


Asset vs Sector Benchmark:*P/E Ratio (TTM)*52-Week Price Return*Beta (S&P500)
– Stock: Snap-on Incorporated (SNA)15.1125.760.95
– Benchmark Symbol: XLI25.8215.59


* Data through February 21, 2025


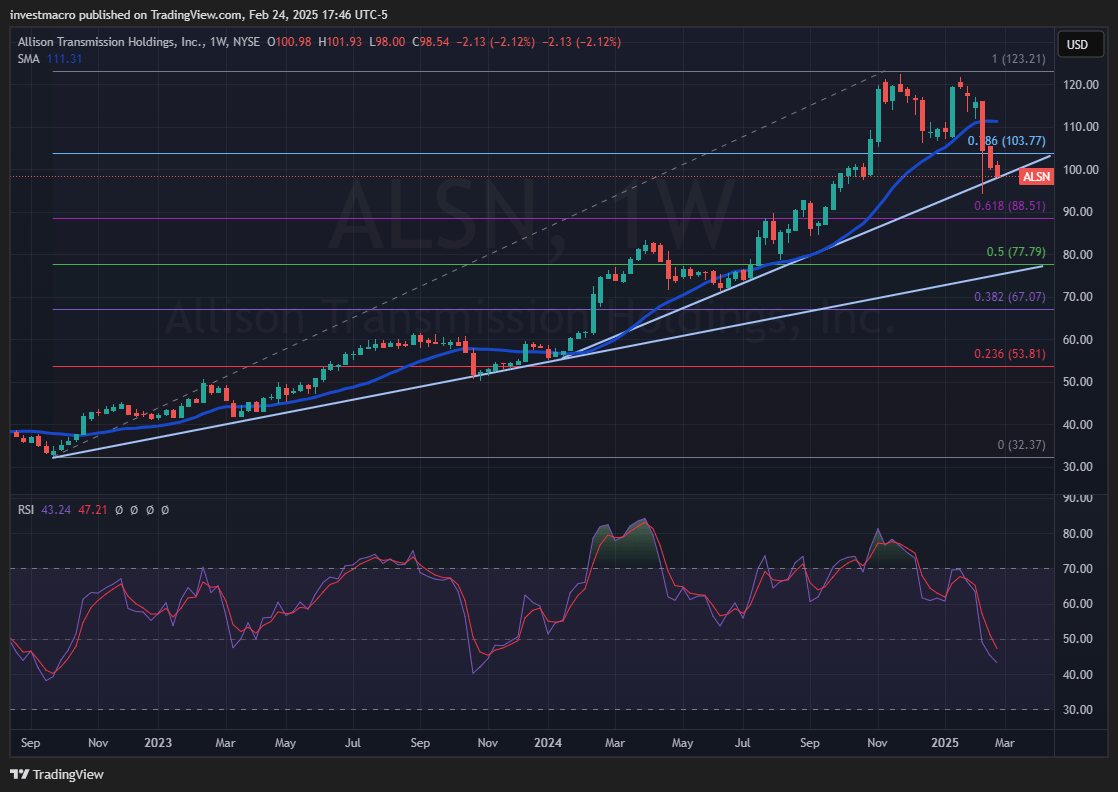
Allison Transmission Holdings, Inc. (ALSN):

Finally, Allison Transmission Holdings, Inc. (Symbol: ALSN) was added to the Cosmic Rays WatchList on February 12th with a 59 score in our fundamental rating system.

At time of writing, only 7.93% of stocks have scored a 50 or better out of a total of 11,665 scores in our earnings database. This stock has been a staple on our list and has made our Watchlist a total of 7 times, rising by 12 system points from our last update. ALSN is a Medium Cap stock and part of the Industrials sector. The industry focus for ALSN is Machinery.

Allison Transmission has beaten its earnings-per-share expectations for four straight quarters as well including in the latest quarter. ALSN has a dividend just above 1.00 percent with a payout ratio near 15 percent. The ALSN stock price has strongly outperformed the Industrials Sector benchmark over the past 52 weeks with a 45.44 percent increase compared to the 15.59 benchmark return.

Company Description (courtesy of SEC.gov):

Allison Transmission Holdings, Inc., together with its subsidiaries, designs, manufactures, and sells commercial and defense fully-automatic transmissions for medium-and heavy-duty commercial vehicles, and medium-and heavy-tactical U.S. defense vehicles worldwide.

Company Website: https://www.allisontransmission.com


Asset vs Sector Benchmark:*P/E Ratio (TTM)*52-Week Price Return*Beta (S&P500)
– Stock: Allison Transmission Holdings, Inc. (ALSN)10.4545.440.98
– Benchmark Symbol: XLI25.8215.59


* Data through February 21, 2025


By InvestMacro – Be sure to join our stock market newsletter to get our updates and to see more top companies we add to our stock watch list.

All information, stock ideas and opinions on this website are for general informational purposes only and do not constitute investment advice. Stock scores are a data driven process through company fundamentals and are not a recommendation to buy or sell a security. Company descriptions provided by sec.gov.