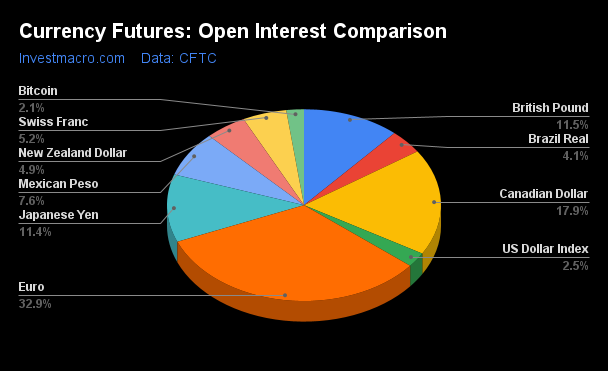
Archive for Opinions – Page 35

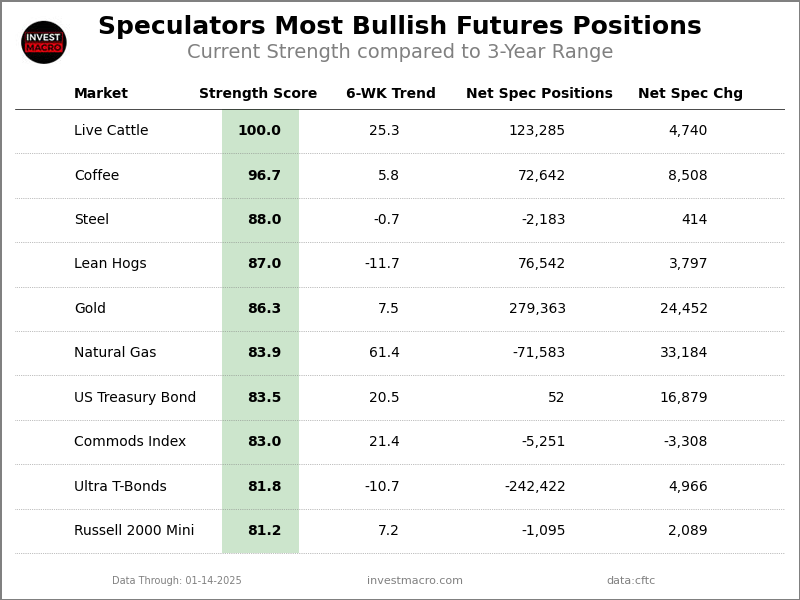
Speculator Extremes: Coffee, Sugar top weekly Bullish & Bearish Positions

By InvestMacro

The latest update for the weekly Commitment of Traders (COT) report was released by the Commodity Futures Trading Commission (CFTC) on Friday for data ending on January 28th.

This weekly Extreme Positions report highlights the Most Bullish and Most Bearish Positions for the speculator category. Extreme positioning in these markets can foreshadow strong moves in the underlying market.

To signify an extreme position, we use the Strength Index (also known as the COT Index) of each instrument, a common method of measuring COT data. The Strength Index is simply a comparison of current trader positions against the range of positions over the previous 3 years. We use over 80 percent as extremely bullish and under 20 percent as extremely bearish. (Compare Strength Index scores across all markets in the data table or cot leaders table)


Here Are This Week’s Most Bullish Speculator Positions:

Coffee


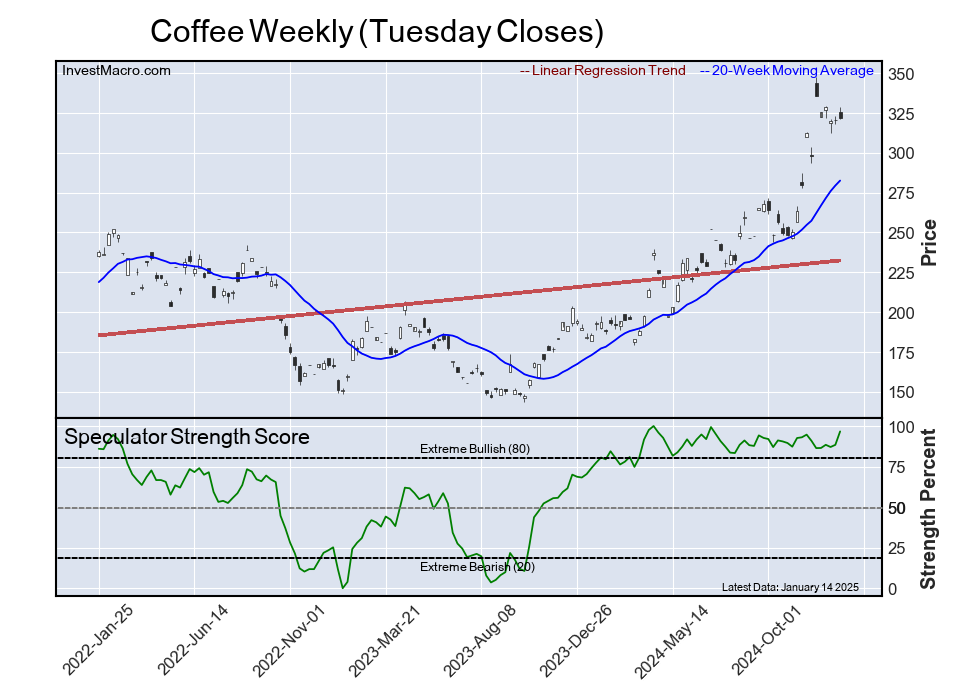
The Coffee speculator position comes in as the most bullish extreme standing this week. The Coffee speculator level is currently at a 100.0 percent maximum score of its 3-year range.

The six-week trend for the percent strength score totaled 13.9 this week. The overall net speculator position was a total of 76,520 net contracts this week with a rise of 2,229 contract in the weekly speculator bets.


Speculators or Non-Commercials Notes:

Speculators, classified as non-commercial traders by the CFTC, are made up of large commodity funds, hedge funds and other significant for-profit participants. The Specs are generally regarded as trend-followers in their behavior towards price action – net speculator bets and prices tend to go in the same directions. These traders often look to buy when prices are rising and sell when prices are falling. To illustrate this point, many times speculator contracts can be found at their most extremes (bullish or bearish) when prices are also close to their highest or lowest levels.

These extreme levels can be dangerous for the large speculators as the trade is most crowded, there is less trading ammunition still sitting on the sidelines to push the trend further and prices have moved a significant distance. When the trend becomes exhausted, some speculators take profits while others look to also exit positions when prices fail to continue in the same direction. This process usually plays out over many months to years and can ultimately create a reverse effect where prices start to fall and speculators start a process of selling when prices are falling.


1-Month Secured Overnight Financing Rate


The 1-Month Secured Overnight Financing Rate speculator position comes next in the extreme standings this week. The 1-Month Secured Overnight Financing Rate speculator level is now at a 96.3 percent score of its 3-year range.

The six-week trend for the percent strength score was 37.6 this week. The speculator position registered 112,967 net contracts this week with a weekly gain of 77,373 contracts in speculator bets.


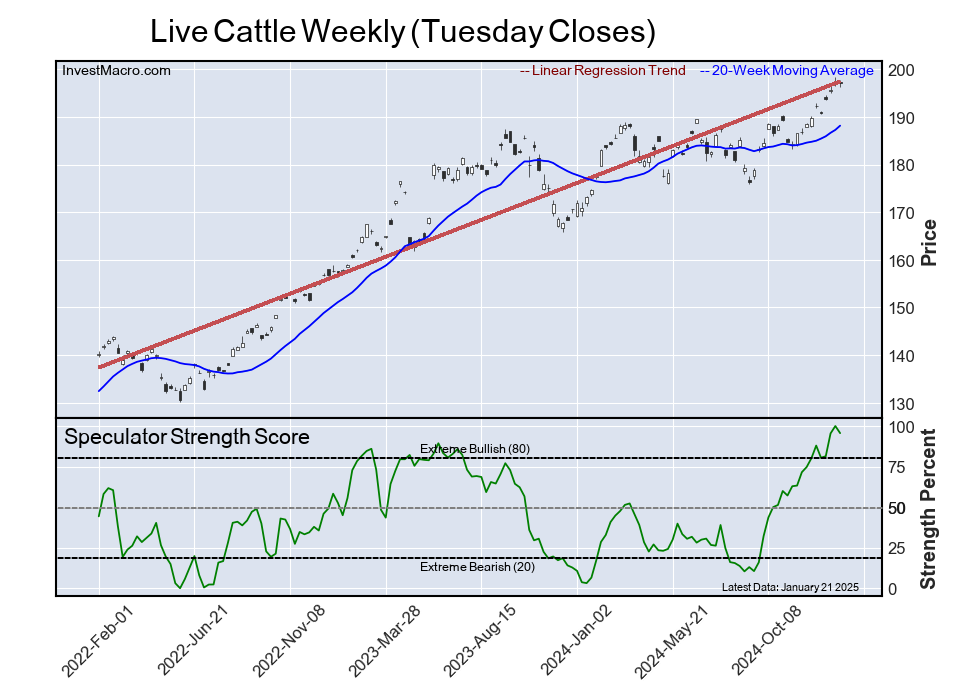
Live Cattle


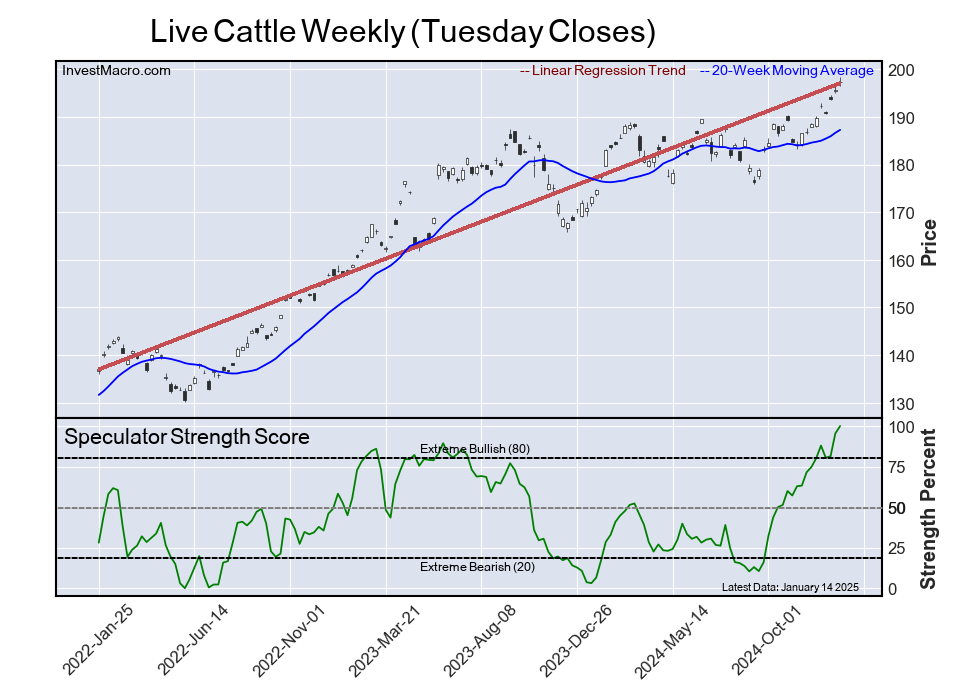
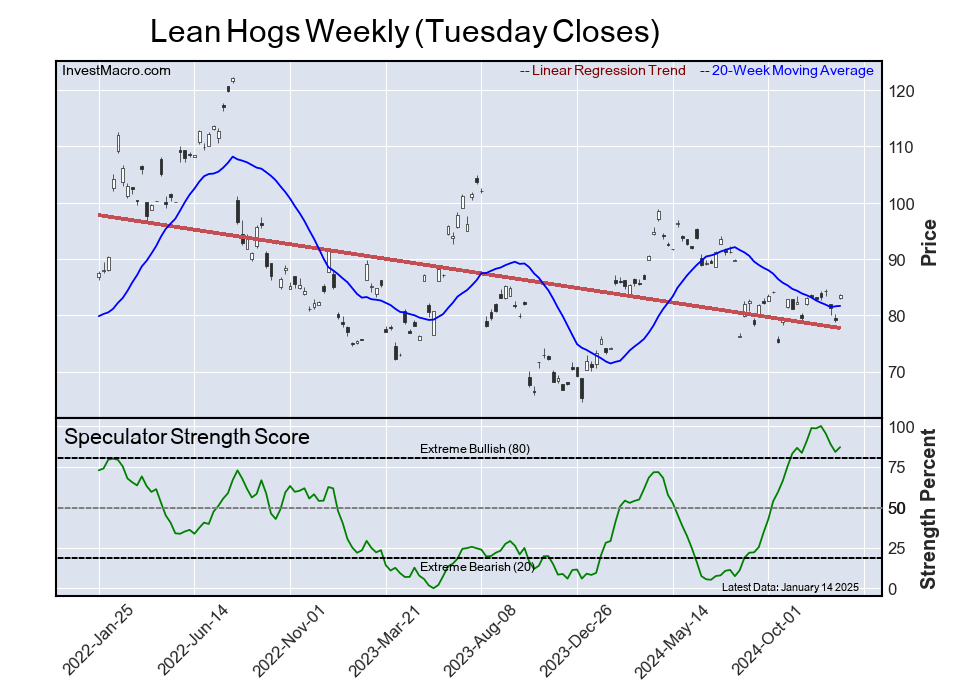
The Live Cattle speculator position comes in third this week in the extreme standings. The Live Cattle speculator level resides at a 95.9 percent score of its 3-year range.

The six-week trend for the speculator strength score came in at 8.0 this week. The overall speculator position was 119,044 net contracts this week with an increase of 312 contracts in the weekly speculator bets.


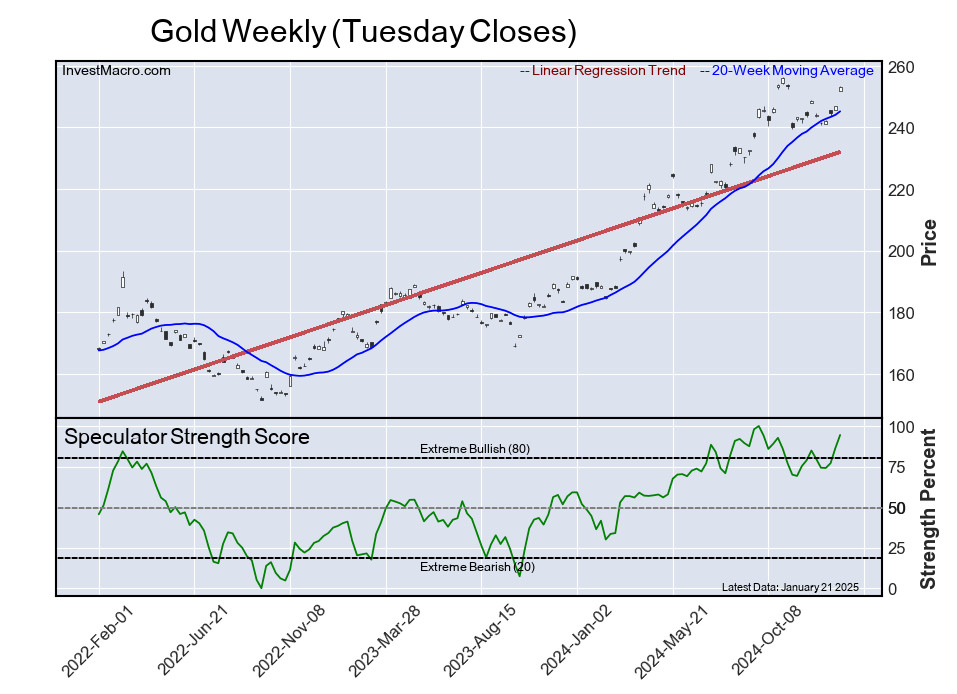
Gold


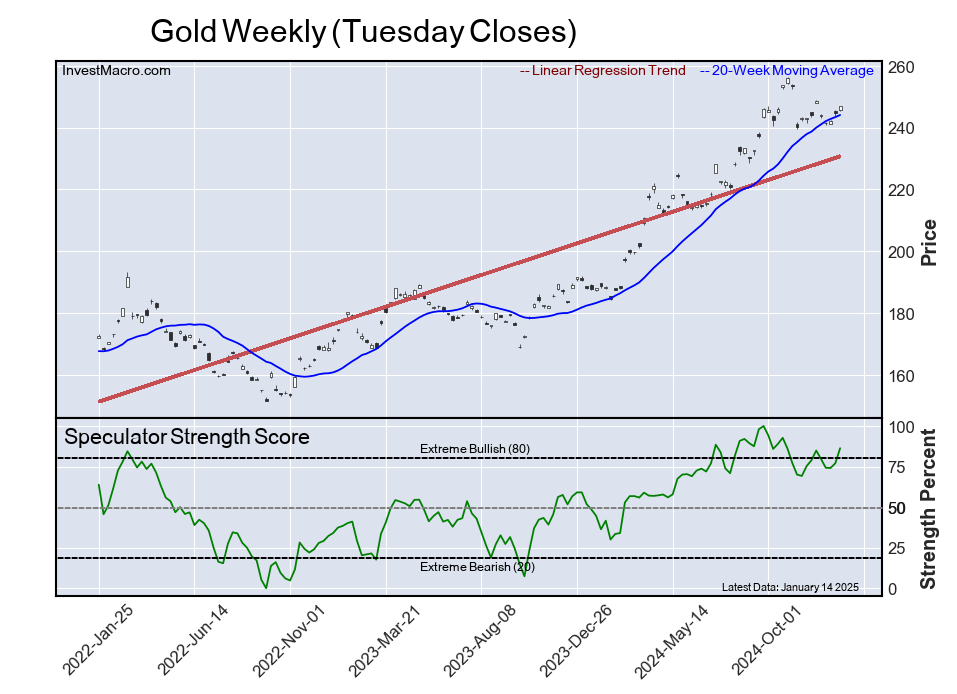
The Gold speculator position comes up number four in the extreme standings this week. The Gold speculator level is at a 93.9 percent score of its 3-year range.

The six-week trend for the speculator strength score totaled a change of 14.2 this week. The overall speculator position was 299,409 net contracts this week with a decrease of -1,375 contracts in the speculator bets.


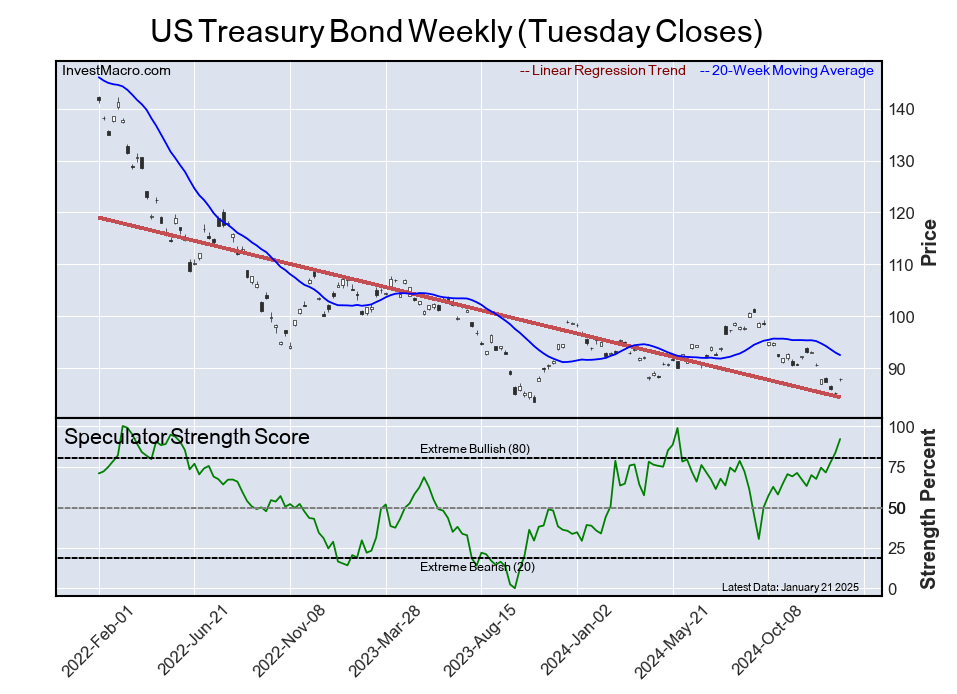
US Treasury Bond


The US Treasury Bond speculator position rounds out the top five in this week’s bullish extreme standings. The US Treasury Bond speculator level sits at a 93.5 percent score of its 3-year range. The six-week trend for the speculator strength score was 26.1 this week.

The speculator position was 28,584 net contracts this week with a rise of 4,128 contracts in the weekly speculator bets.


This Week’s Most Bearish Speculator Positions:

Sugar


The Sugar speculator position comes in as the most bearish extreme standing this week. The Sugar speculator level is at a 0.7 percent score of its 3-year range.

The six-week trend for the speculator strength score was -31.4 this week. The overall speculator position was -29,434 net contracts this week with a boost of 2,033 contracts in the speculator bets.


Cotton


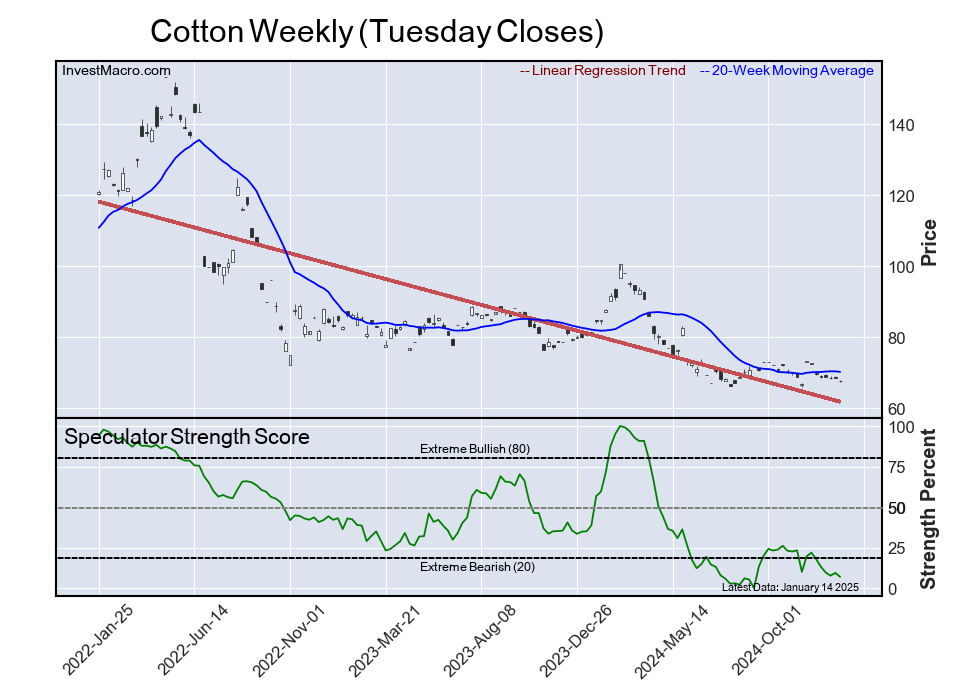
The Cotton speculator position comes in next for the most bearish extreme standing on the week. The Cotton speculator level is at a 2.5 percent score of its 3-year range.

The six-week trend for the speculator strength score was -10.7 this week. The speculator position was -42,428 net contracts this week with a subtraction of -2,477 contracts in the weekly speculator bets.


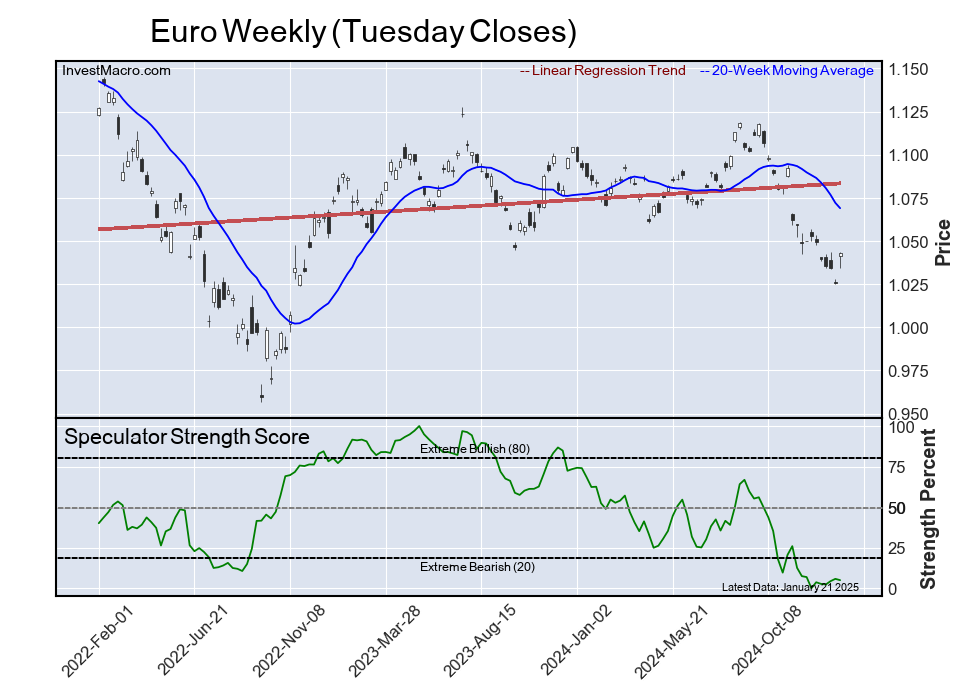
Euro


The Euro speculator position comes in as third most bearish extreme standing of the week. The Euro speculator level resides at a 3.4 percent score of its 3-year range.

The six-week trend for the speculator strength score was -0.3 this week. The overall speculator position was -66,604 net contracts this week with a decline of -4,118 contracts in the speculator bets.


Wheat


The Wheat speculator position comes in as this week’s fourth most bearish extreme standing. The Wheat speculator level is at a 4.8 percent score of its 3-year range.

The six-week trend for the speculator strength score was -9.3 this week. The speculator position was -91,111 net contracts this week with a drop by -18,102 contracts in the weekly speculator bets.


New Zealand Dollar


Finally, the New Zealand Dollar speculator position comes in as the fifth most bearish extreme standing for this week. The New Zealand Dollar speculator level is at a 8.9 percent score of its 3-year range.

The six-week trend for the speculator strength score was -5.3 this week. The speculator position was -47,031 net contracts this week with a gain of 4,192 contracts in the weekly speculator bets.


Article By InvestMacroReceive our weekly COT Newsletter

*COT Report: The COT data, released weekly to the public each Friday, is updated through the most recent Tuesday (data is 3 days old) and shows a quick view of how large speculators or non-commercials (for-profit traders) were positioned in the futures markets.

The CFTC categorizes trader positions according to commercial hedgers (traders who use futures contracts for hedging as part of the business), non-commercials (large traders who speculate to realize trading profits) and nonreportable traders (usually small traders/speculators) as well as their open interest (contracts open in the market at time of reporting). See CFTC criteria here.

Why building big AIs costs billions – and how Chinese startup DeepSeek dramatically changed the calculus

By Ambuj Tewari, University of Michigan 

State-of-the-art artificial intelligence systems like OpenAI’s ChatGPT, Google’s Gemini and Anthropic’s Claude have captured the public imagination by producing fluent text in multiple languages in response to user prompts. Those companies have also captured headlines with the huge sums they’ve invested to build ever more powerful models.

An AI startup from China, DeepSeek, has upset expectations about how much money is needed to build the latest and greatest AIs. In the process, they’ve cast doubt on the billions of dollars of investment by the big AI players.

I study machine learning. DeepSeek’s disruptive debut comes down not to any stunning technological breakthrough but to a time-honored practice: finding efficiencies. In a field that consumes vast computing resources, that has proved to be significant.

Where the costs are

Developing such powerful AI systems begins with building a large language model. A large language model predicts the next word given previous words. For example, if the beginning of a sentence is “The theory of relativity was discovered by Albert,” a large language model might predict that the next word is “Einstein.” Large language models are trained to become good at such predictions in a process called pretraining.

Pretraining requires a lot of data and computing power. The companies collect data by crawling the web and scanning books. Computing is usually powered by graphics processing units, or GPUs. Why graphics? It turns out that both computer graphics and the artificial neural networks that underlie large language models rely on the same area of mathematics known as linear algebra. Large language models internally store hundreds of billions of numbers called parameters or weights. It is these weights that are modified during pretraining.

Large language models consume huge amounts of computing resources, which in turn means lots of energy.

Pretraining is, however, not enough to yield a consumer product like ChatGPT. A pretrained large language model is usually not good at following human instructions. It might also not be aligned with human preferences. For example, it might output harmful or abusive language, both of which are present in text on the web.

The pretrained model therefore usually goes through additional stages of training. One such stage is instruction tuning where the model is shown examples of human instructions and expected responses. After instruction tuning comes a stage called reinforcement learning from human feedback. In this stage, human annotators are shown multiple large language model responses to the same prompt. The annotators are then asked to point out which response they prefer.

It is easy to see how costs add up when building an AI model: hiring top-quality AI talent, building a data center with thousands of GPUs, collecting data for pretraining, and running pretraining on GPUs. Additionally, there are costs involved in data collection and computation in the instruction tuning and reinforcement learning from human feedback stages.

All included, costs for building a cutting edge AI model can soar up to US$100 million. GPU training is a significant component of the total cost.

The expenditure does not stop when the model is ready. When the model is deployed and responds to user prompts, it uses more computation known as test time or inference time compute. Test time compute also needs GPUs. In December 2024, OpenAI announced a new phenomenon they saw with their latest model o1: as test time compute increased, the model got better at logical reasoning tasks such as math olympiad and competitive coding problems.

Slimming down resource consumption

Thus it seemed that the path to building the best AI models in the world was to invest in more computation during both training and inference. But then DeepSeek entered the fray and bucked this trend.

DeepSeek sent shockwaves through the tech financial ecosystem.

Their V-series models, culminating in the V3 model, used a series of optimizations to make training cutting edge AI models significantly more economical. Their technical report states that it took them less than $6 million dollars to train V3. They admit that this cost does not include costs of hiring the team, doing the research, trying out various ideas and data collection. But $6 million is still an impressively small figure for training a model that rivals leading AI models developed with much higher costs.

The reduction in costs was not due to a single magic bullet. It was a combination of many smart engineering choices including using fewer bits to represent model weights, innovation in the neural network architecture, and reducing communication overhead as data is passed around between GPUs.

It is interesting to note that due to U.S. export restrictions on China, the DeepSeek team did not have access to high performance GPUs like the Nvidia H100. Instead they used Nvidia H800 GPUs, which Nvidia designed to be lower performance so that they comply with U.S. export restrictions. Working with this limitation seems to have unleashed even more ingenuity from the DeepSeek team.

DeepSeek also innovated to make inference cheaper, reducing the cost of running the model. Moreover, they released a model called R1 that is comparable to OpenAI’s o1 model on reasoning tasks.

They released all the model weights for V3 and R1 publicly. Anyone can download and further improve or customize their models. Furthermore, DeepSeek released their models under the permissive MIT license, which allows others to use the models for personal, academic or commercial purposes with minimal restrictions.

Resetting expectations

DeepSeek has fundamentally altered the landscape of large AI models. An open weights model trained economically is now on par with more expensive and closed models that require paid subscription plans.

The research community and the stock market will need some time to adjust to this new reality.The Conversation

About the Author:

Ambuj Tewari, Professor of Statistics, University of Michigan

This article is republished from The Conversation under a Creative Commons license. Read the original article.

Speculators raise New Zealand Dollar bets after drop to all-time low

By InvestMacro

Here are the latest charts and statistics for the Commitment of Traders (COT) data published by the Commodities Futures Trading Commission (CFTC).

The latest COT data is updated through Tuesday January 21st and shows a quick view of how large market participants (for-profit speculators and commercial traders) were positioned in the futures markets. All currency positions are in direct relation to the US dollar where, for example, a bet for the euro is a bet that the euro will rise versus the dollar while a bet against the euro will be a bet that the euro will decline versus the dollar.

Weekly Speculator Changes led by New Zealand Dollar & Brazilian Real
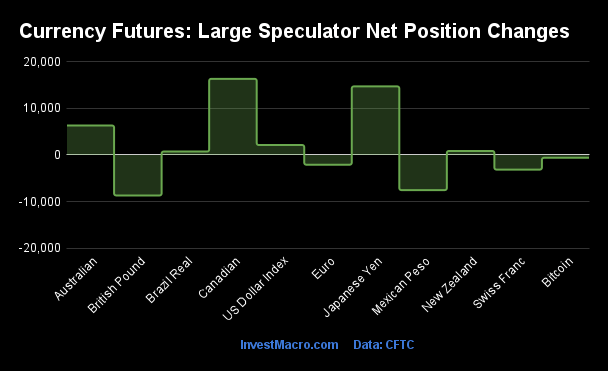
The COT currency market speculator bets were slightly higher this week as six out of the eleven currency markets we cover had higher positioning while the other five markets had lower speculator contracts.

Leading the gains for the currency markets was the Canadian Dollar (16,366 contracts), the Japanese Yen (14,738 contracts), the Australian Dollar (6,335 contracts), the US Dollar Index (2,143 contracts), the New Zealand Dollar (866 contracts) and the Brazilian Real (743 contracts) also showing positive weeks.

The currencies seeing declines in speculator bets on the week were the British Pound (-8,695 contracts), the Mexican Peso (-7,541 contracts), the Swiss Franc (-3,136 contracts), the EuroFX (-2,089 contracts) and with Bitcoin (-596 contracts) also registering lower bets on the week.

Speculators raise New Zealand Dollar bets after drop to all-time low

Highlighting the COT currency’s data this week is the recent speculator’s positioning for the New Zealand ‘Kiwi’ Dollar.

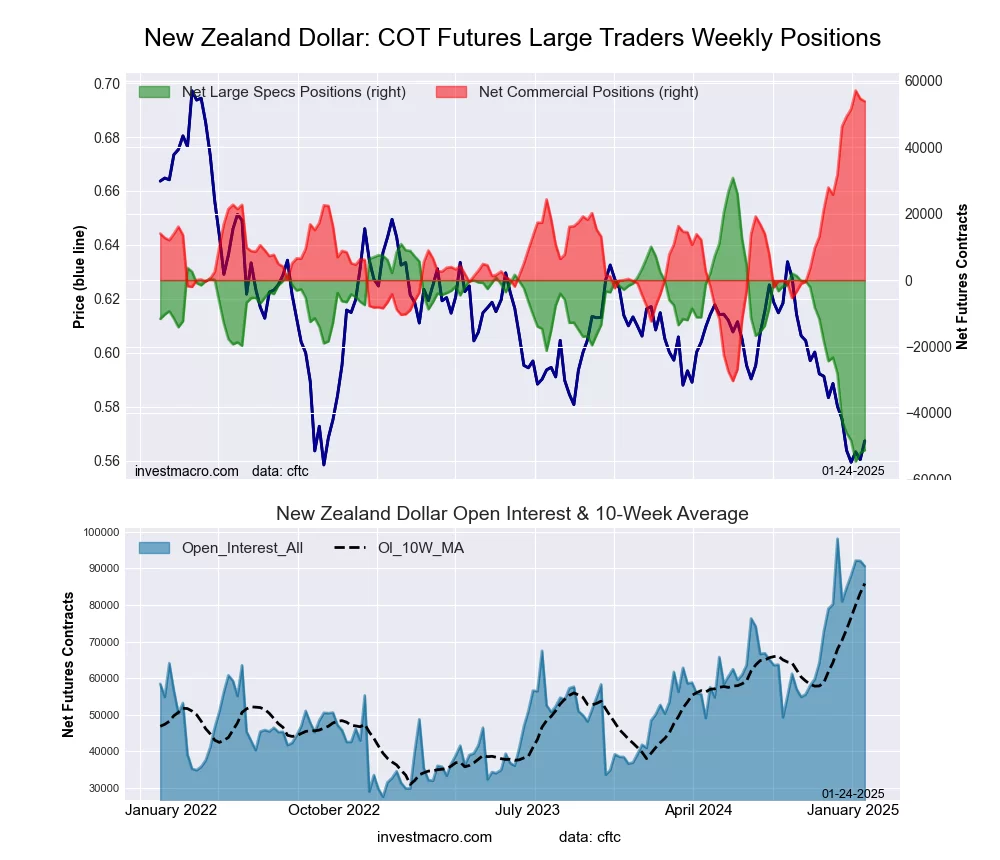
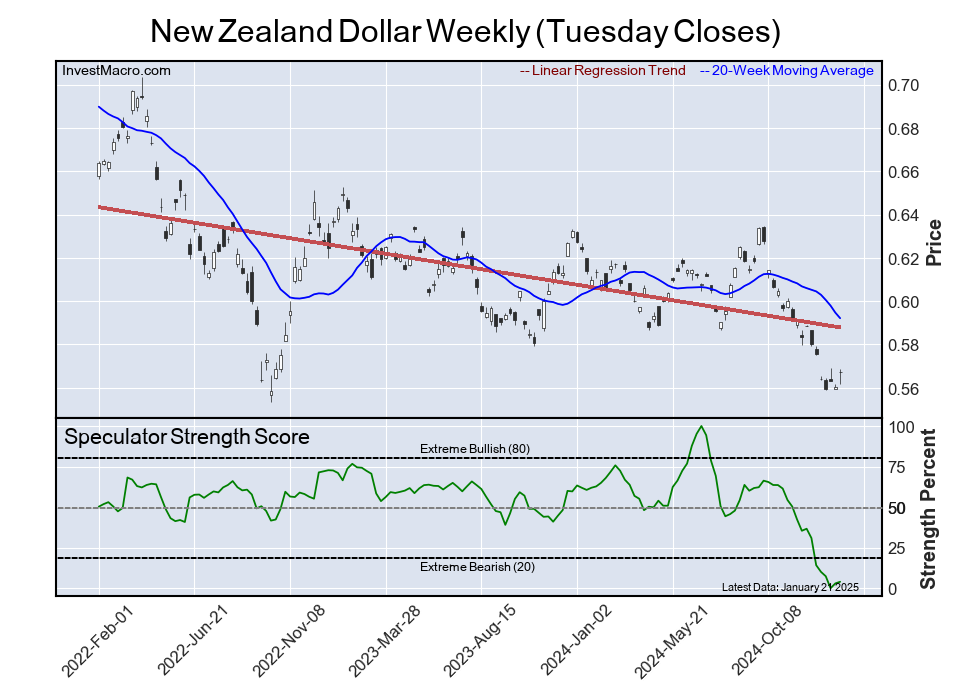
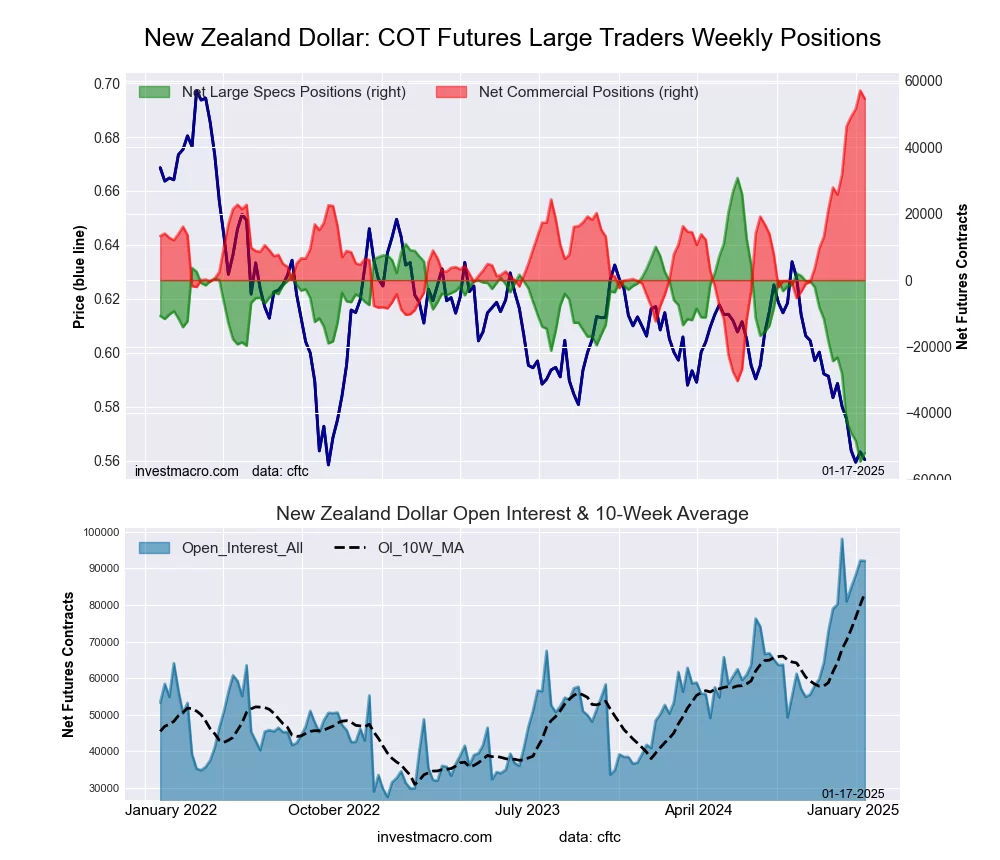
Large speculative New Zealand Dollar (NZD) currency positions rose modestly this week by +866 net contracts and have gained for two consecutive weeks. This follows significant weakness in the position over the past few months. The NZD spec position had declined for the previous five straight weeks and for thirteen out of the prior fourteen weeks for a total decline of -56,594 contracts over that period dating back to October.

This NZD weakness of the fourth quarter and into the first quarter of 2025 dropped the NZD speculator position into the lowest or most bearish level on record at -54,624 contracts on January 7th – surpassing the previous lows in 2019.

The NZD exchange rate versus the US Dollar has been on the decline in tandem with the drop in speculator bets, particularly since September. The NZDUSD started to slide in September and fell through the 0.6000 exchange level in November and continued to fall in December and into January, dropping all the way to the 0.5540 level in early January. This marked the lowest standing for the NZDUSD since October 2022.

This week, the NZD bounced higher by over 2.00 percent and managed to close above the 0.5700 exchange rate for the first time since early December.


Currencies Net Speculators Leaderboard
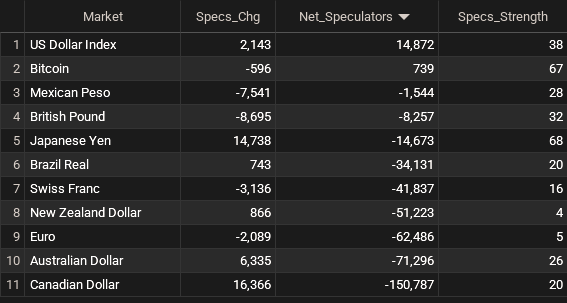
Legend: Weekly Speculators Change | Speculators Current Net Position | Speculators Strength Score compared to last 3-Years (0-100 range)


Strength Scores led by Japanese Yen & Bitcoin
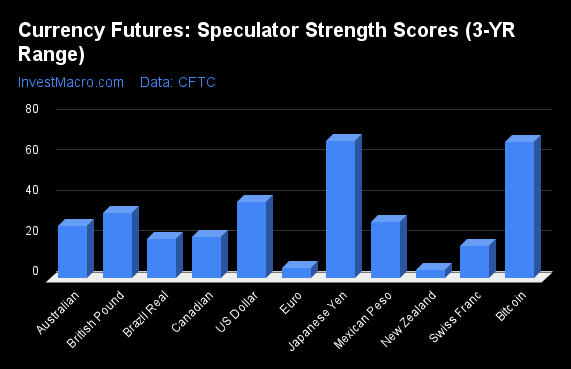
COT Strength Scores (a normalized measure of Speculator positions over a 3-Year range, from 0 to 100 where above 80 is Extreme-Bullish and below 20 is Extreme-Bearish) showed that the Japanese Yen (68 percent) and Bitcoin (67 percent) lead the currency markets this week.

On the downside, the New Zealand Dollar (4 percent), the EuroFX (5 percent), the Swiss Franc (16 percent) and the Brazilian Real (19.7 percent) come in at the lowest strength levels currently and are in Extreme-Bearish territory (below 20 percent).

3-Year Strength Statistics:
US Dollar Index (37.5 percent) vs US Dollar Index previous week (33.1 percent)
EuroFX (5.0 percent) vs EuroFX previous week (5.8 percent)
British Pound Sterling (32.4 percent) vs British Pound Sterling previous week (36.3 percent)
Japanese Yen (67.8 percent) vs Japanese Yen previous week (61.9 percent)
Swiss Franc (16.1 percent) vs Swiss Franc previous week (22.5 percent)
Canadian Dollar (20.4 percent) vs Canadian Dollar previous week (13.0 percent)
Australian Dollar (25.7 percent) vs Australian Dollar previous week (21.2 percent)
New Zealand Dollar (4.0 percent) vs New Zealand Dollar previous week (3.0 percent)
Mexican Peso (28.0 percent) vs Mexican Peso previous week (31.8 percent)
Brazilian Real (19.7 percent) vs Brazilian Real previous week (19.0 percent)
Bitcoin (67.4 percent) vs Bitcoin previous week (80.4 percent)


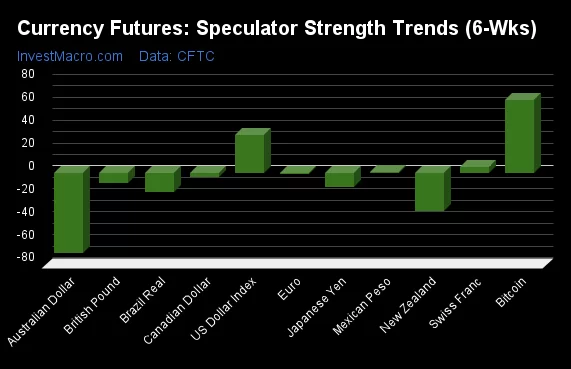
US Dollar Index & Bitcoin top the 6-Week Strength Trends
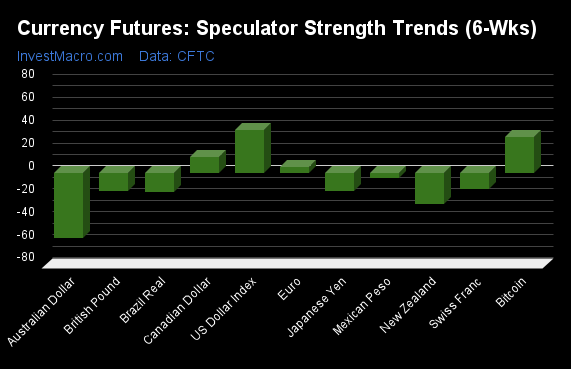
COT Strength Score Trends (or move index, calculates the 6-week changes in strength scores) showed that the US Dollar Index (38 percent) and Bitcoin (32 percent) lead the past six weeks trends for the currencies. The Canadian Dollar (14 percent) is the next highest positive movers in the 3-Year trends data.

The Australian Dollar (-57 percent) leads the downside trend scores currently with the New Zealand Dollar (-27 percent), Brazilian Real (-17 percent) and the Japanese Yen (-16 percent) following next with lower trend scores.

3-Year Strength Trends:
US Dollar Index (37.5 percent) vs US Dollar Index previous week (32.7 percent)
EuroFX (5.0 percent) vs EuroFX previous week (-1.1 percent)
British Pound Sterling (-15.9 percent) vs British Pound Sterling previous week (-8.5 percent)
Japanese Yen (-16.2 percent) vs Japanese Yen previous week (-12.7 percent)
Swiss Franc (-13.9 percent) vs Swiss Franc previous week (4.8 percent)
Canadian Dollar (13.8 percent) vs Canadian Dollar previous week (-3.5 percent)
Australian Dollar (-56.6 percent) vs Australian Dollar previous week (-70.3 percent)
New Zealand Dollar (-27.0 percent) vs New Zealand Dollar previous week (-33.7 percent)
Mexican Peso (-4.8 percent) vs Mexican Peso previous week (0.9 percent)
Brazilian Real (-16.8 percent) vs Brazilian Real previous week (-16.6 percent)
Bitcoin (31.8 percent) vs Bitcoin previous week (63.9 percent)


Individual COT Forex Markets:

US Dollar Index Futures:
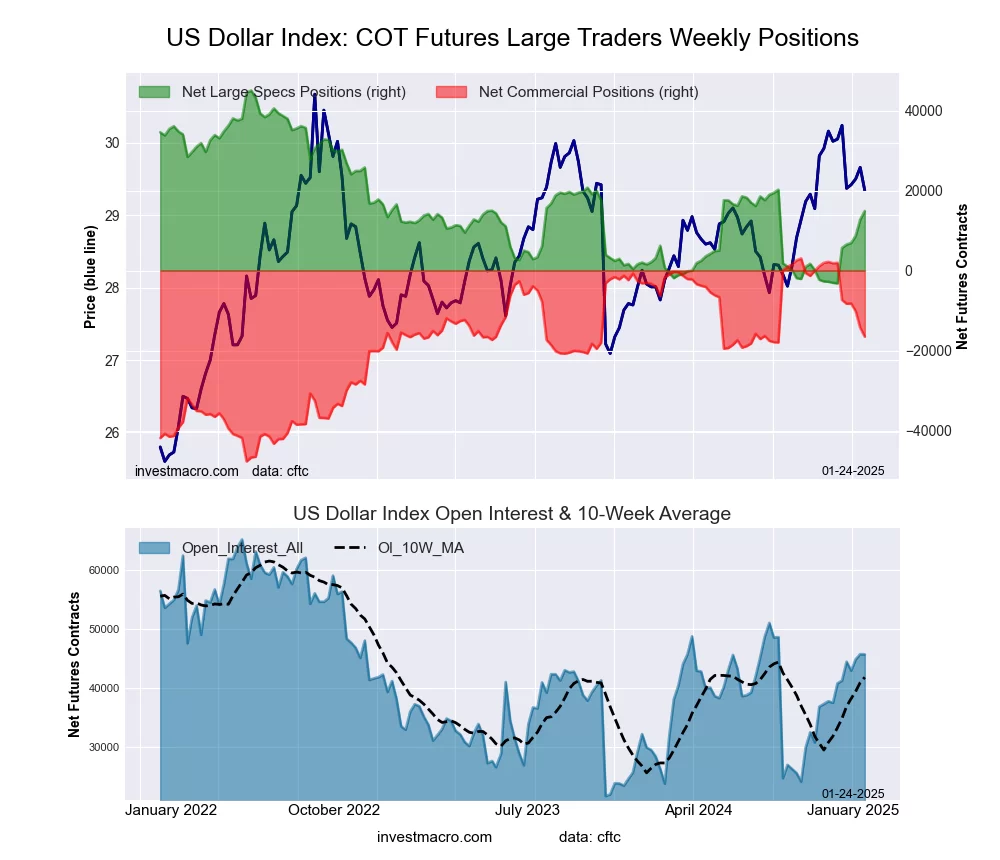
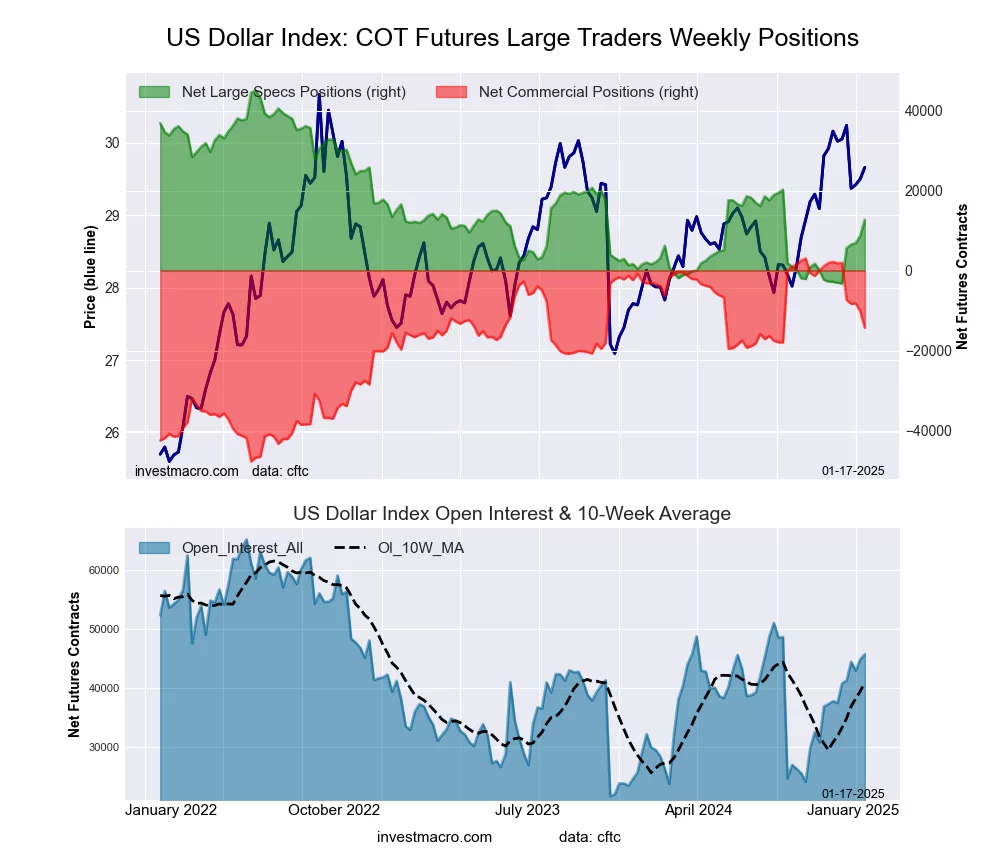
US Dollar Index Forex Futures COT ChartThe US Dollar Index large speculator standing this week reached a net position of 14,872 contracts in the data reported through Tuesday. This was a weekly increase of 2,143 contracts from the previous week which had a total of 12,729 net contracts.

This week’s current strength score (the trader positioning range over the past three years, measured from 0 to 100) shows the speculators are currently Bearish with a score of 37.5 percent. The commercials are Bullish with a score of 61.5 percent and the small traders (not shown in chart) are Bearish with a score of 40.6 percent.

Price Trend-Following Model: Weak Uptrend

Our weekly trend-following model classifies the current market price position as: Weak Uptrend.

US DOLLAR INDEX StatisticsSPECULATORSCOMMERCIALSSMALL TRADERS
– Percent of Open Interest Longs:63.024.69.0
– Percent of Open Interest Shorts:30.560.75.4
– Net Position:14,872-16,5201,648
– Gross Longs:28,81111,2474,133
– Gross Shorts:13,93927,7672,485
– Long to Short Ratio:2.1 to 10.4 to 11.7 to 1
NET POSITION TREND:
– Strength Index Score (3 Year Range Pct):37.561.540.6
– Strength Index Reading (3 Year Range):BearishBullishBearish
NET POSITION MOVEMENT INDEX:
– 6-Week Change in Strength Index:37.5-36.43.8


Euro Currency Futures:

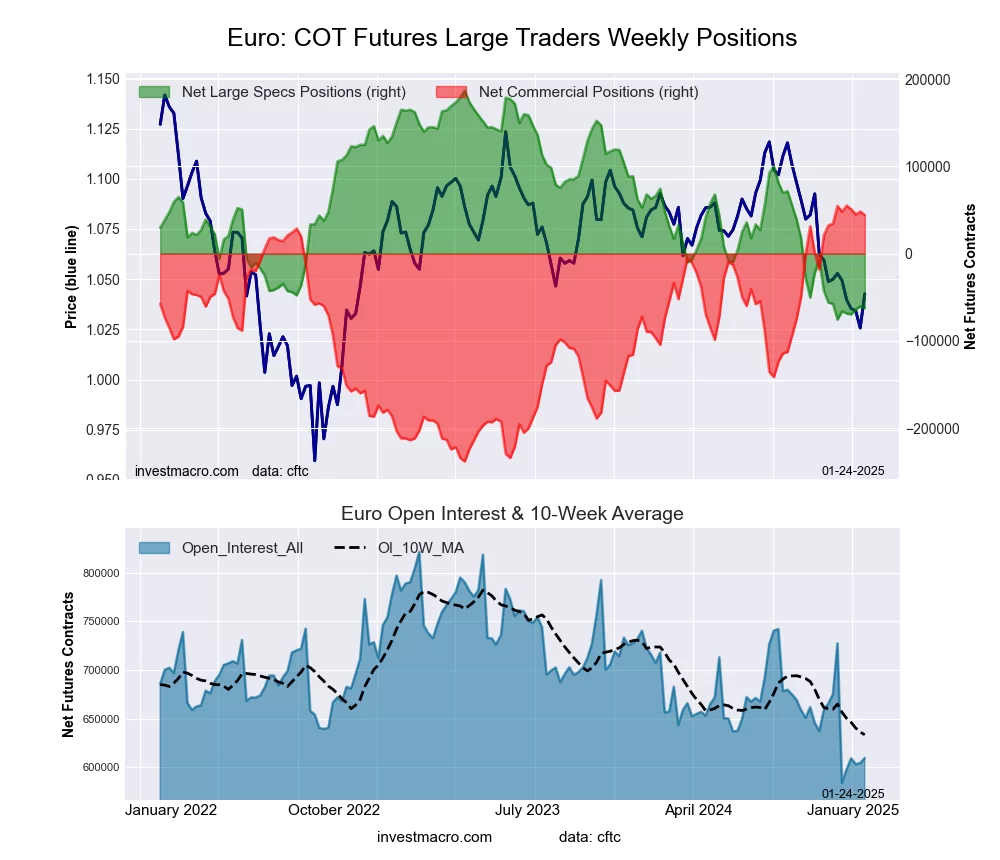
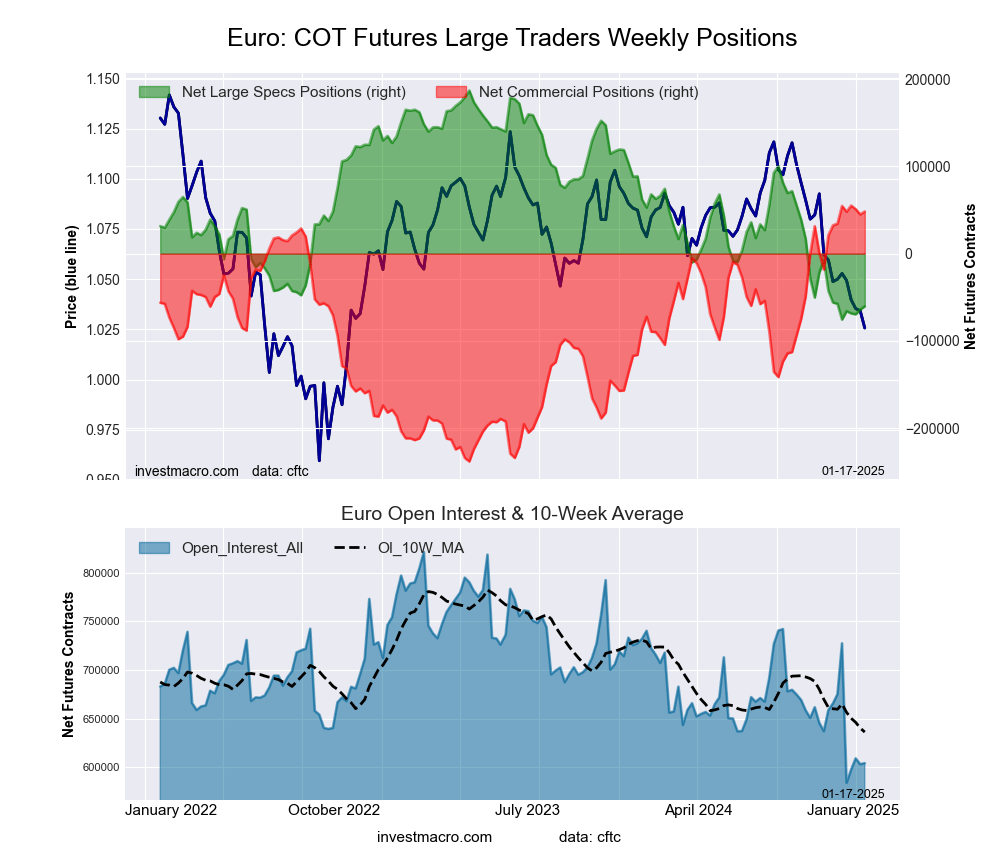
Euro Currency Futures COT ChartThe Euro Currency large speculator standing this week reached a net position of -62,486 contracts in the data reported through Tuesday. This was a weekly reduction of -2,089 contracts from the previous week which had a total of -60,397 net contracts.

This week’s current strength score (the trader positioning range over the past three years, measured from 0 to 100) shows the speculators are currently Bearish-Extreme with a score of 5.0 percent. The commercials are Bullish-Extreme with a score of 96.3 percent and the small traders (not shown in chart) are Bearish-Extreme with a score of 13.6 percent.

Price Trend-Following Model: Downtrend

Our weekly trend-following model classifies the current market price position as: Downtrend.

EURO Currency StatisticsSPECULATORSCOMMERCIALSSMALL TRADERS
– Percent of Open Interest Longs:27.555.612.4
– Percent of Open Interest Shorts:37.848.39.4
– Net Position:-62,48644,29518,191
– Gross Longs:167,665338,71975,560
– Gross Shorts:230,151294,42457,369
– Long to Short Ratio:0.7 to 11.2 to 11.3 to 1
NET POSITION TREND:
– Strength Index Score (3 Year Range Pct):5.096.313.6
– Strength Index Reading (3 Year Range):Bearish-ExtremeBullish-ExtremeBearish-Extreme
NET POSITION MOVEMENT INDEX:
– 6-Week Change in Strength Index:5.0-3.6-5.9


British Pound Sterling Futures:

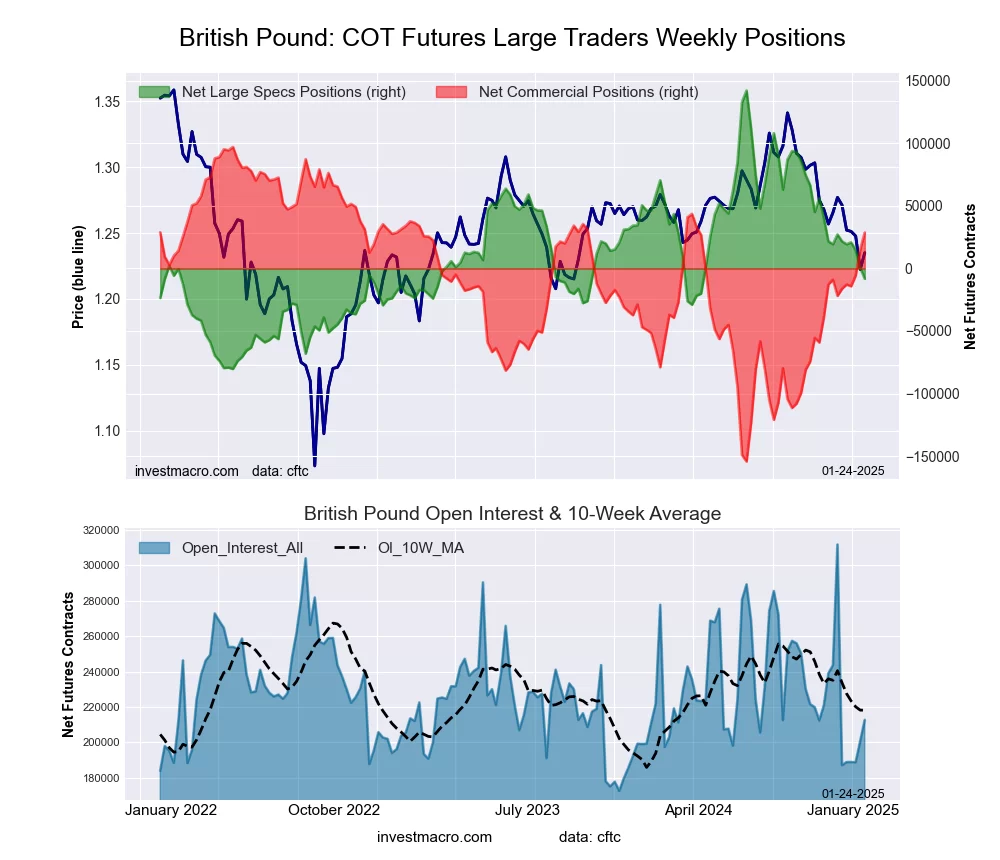
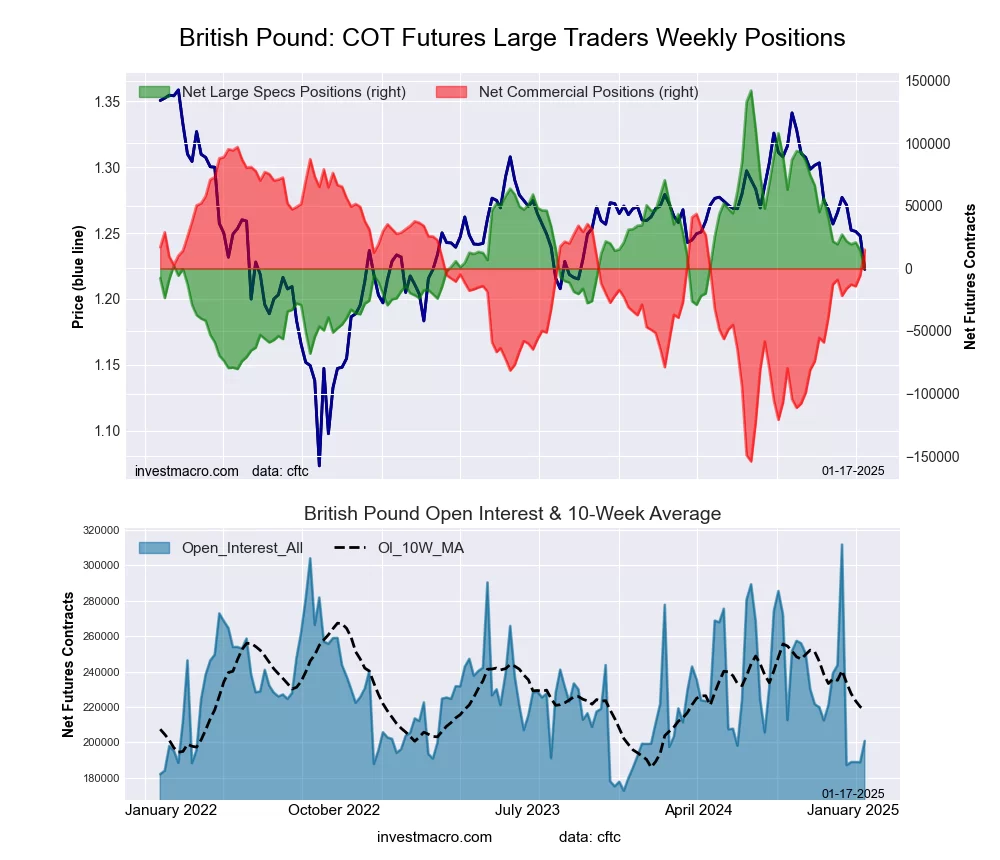
British Pound Sterling Futures COT ChartThe British Pound Sterling large speculator standing this week reached a net position of -8,257 contracts in the data reported through Tuesday. This was a weekly fall of -8,695 contracts from the previous week which had a total of 438 net contracts.

This week’s current strength score (the trader positioning range over the past three years, measured from 0 to 100) shows the speculators are currently Bearish with a score of 32.4 percent. The commercials are Bullish with a score of 72.8 percent and the small traders (not shown in chart) are Bearish-Extreme with a score of 19.1 percent.

Price Trend-Following Model: Downtrend

Our weekly trend-following model classifies the current market price position as: Downtrend.

BRITISH POUND StatisticsSPECULATORSCOMMERCIALSSMALL TRADERS
– Percent of Open Interest Longs:35.652.610.3
– Percent of Open Interest Shorts:39.539.119.9
– Net Position:-8,25728,749-20,492
– Gross Longs:75,696111,96821,903
– Gross Shorts:83,95383,21942,395
– Long to Short Ratio:0.9 to 11.3 to 10.5 to 1
NET POSITION TREND:
– Strength Index Score (3 Year Range Pct):32.472.819.1
– Strength Index Reading (3 Year Range):BearishBullishBearish-Extreme
NET POSITION MOVEMENT INDEX:
– 6-Week Change in Strength Index:-15.920.2-32.1


Japanese Yen Futures:

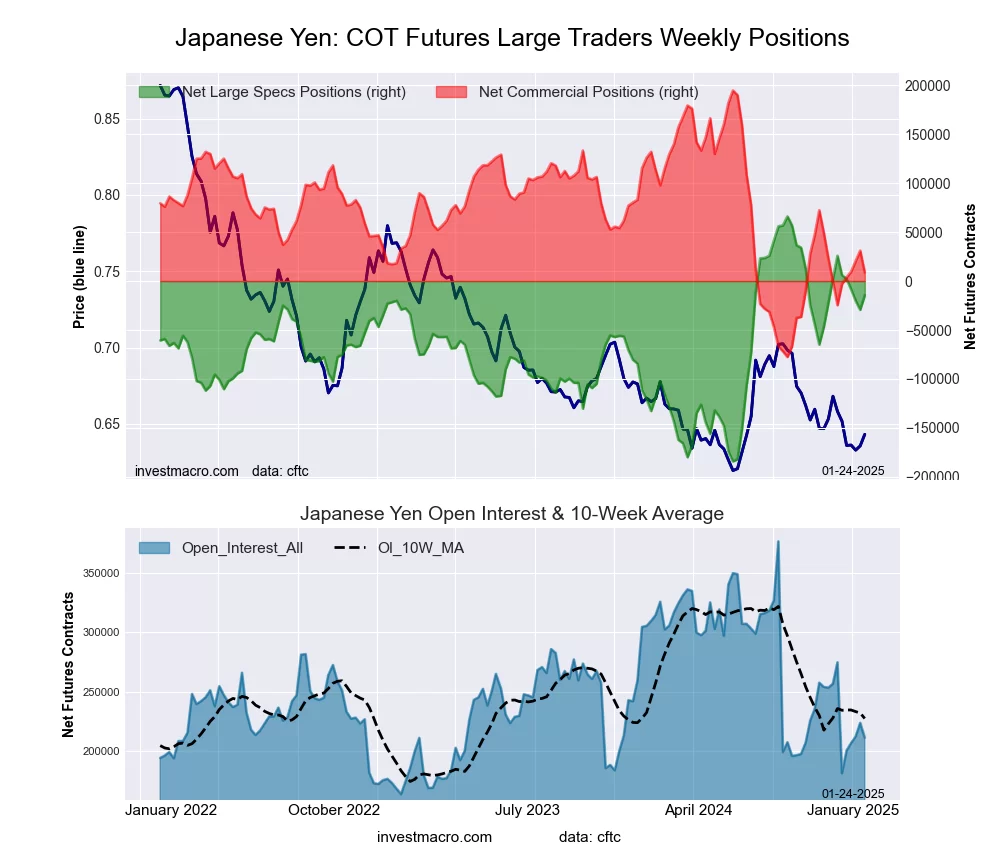
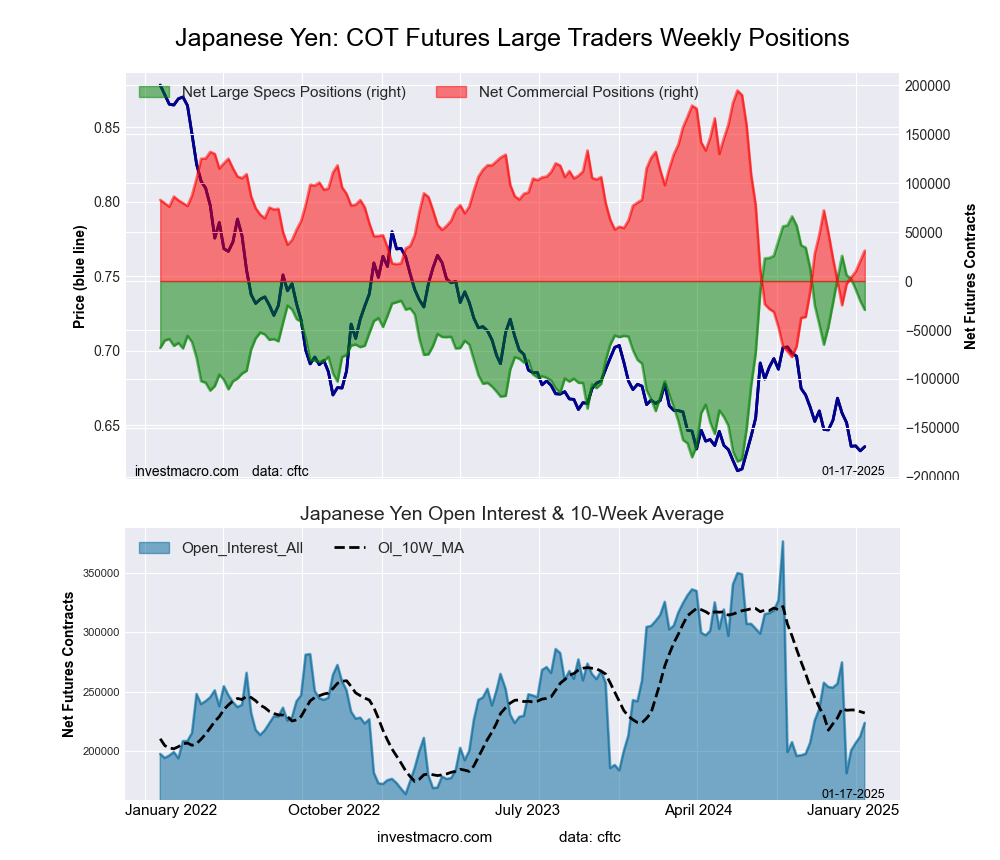
Japanese Yen Forex Futures COT ChartThe Japanese Yen large speculator standing this week reached a net position of -14,673 contracts in the data reported through Tuesday. This was a weekly lift of 14,738 contracts from the previous week which had a total of -29,411 net contracts.

This week’s current strength score (the trader positioning range over the past three years, measured from 0 to 100) shows the speculators are currently Bullish with a score of 67.8 percent. The commercials are Bearish with a score of 31.7 percent and the small traders (not shown in chart) are Bullish with a score of 77.8 percent.

Price Trend-Following Model: Downtrend

Our weekly trend-following model classifies the current market price position as: Downtrend.

JAPANESE YEN StatisticsSPECULATORSCOMMERCIALSSMALL TRADERS
– Percent of Open Interest Longs:44.532.520.6
– Percent of Open Interest Shorts:51.428.417.9
– Net Position:-14,6738,8295,844
– Gross Longs:94,15768,86843,642
– Gross Shorts:108,83060,03937,798
– Long to Short Ratio:0.9 to 11.1 to 11.2 to 1
NET POSITION TREND:
– Strength Index Score (3 Year Range Pct):67.831.777.8
– Strength Index Reading (3 Year Range):BullishBearishBullish
NET POSITION MOVEMENT INDEX:
– 6-Week Change in Strength Index:-16.212.316.9


Swiss Franc Futures:

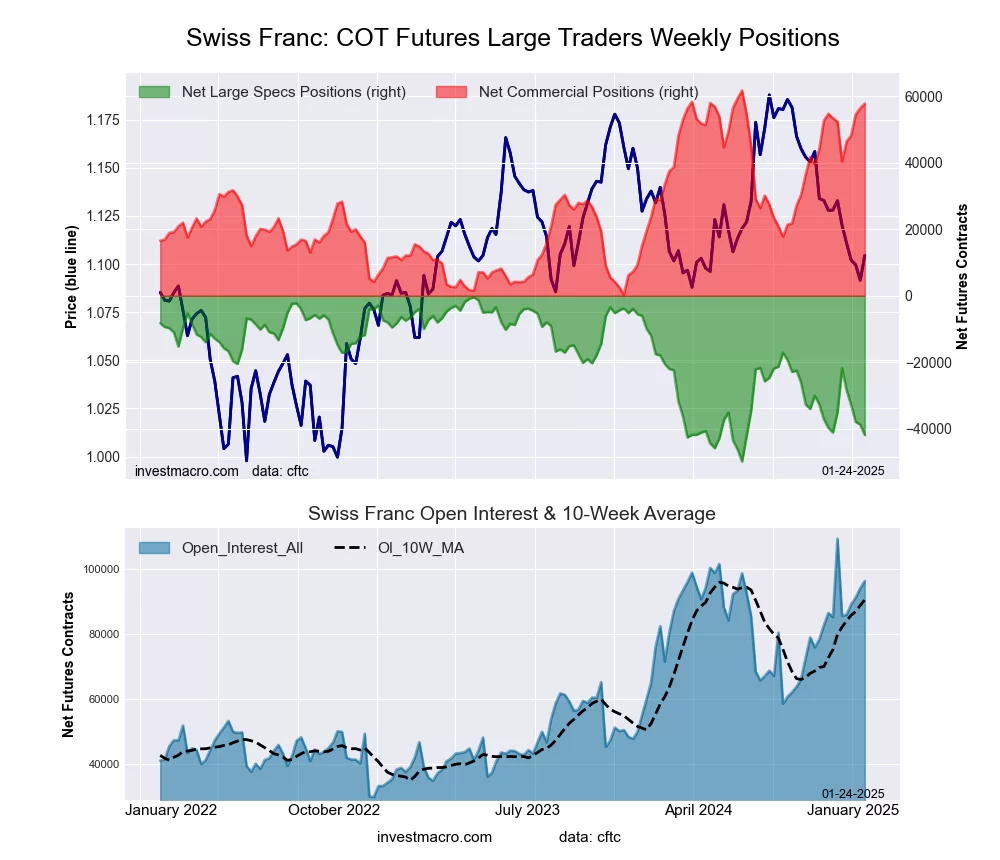
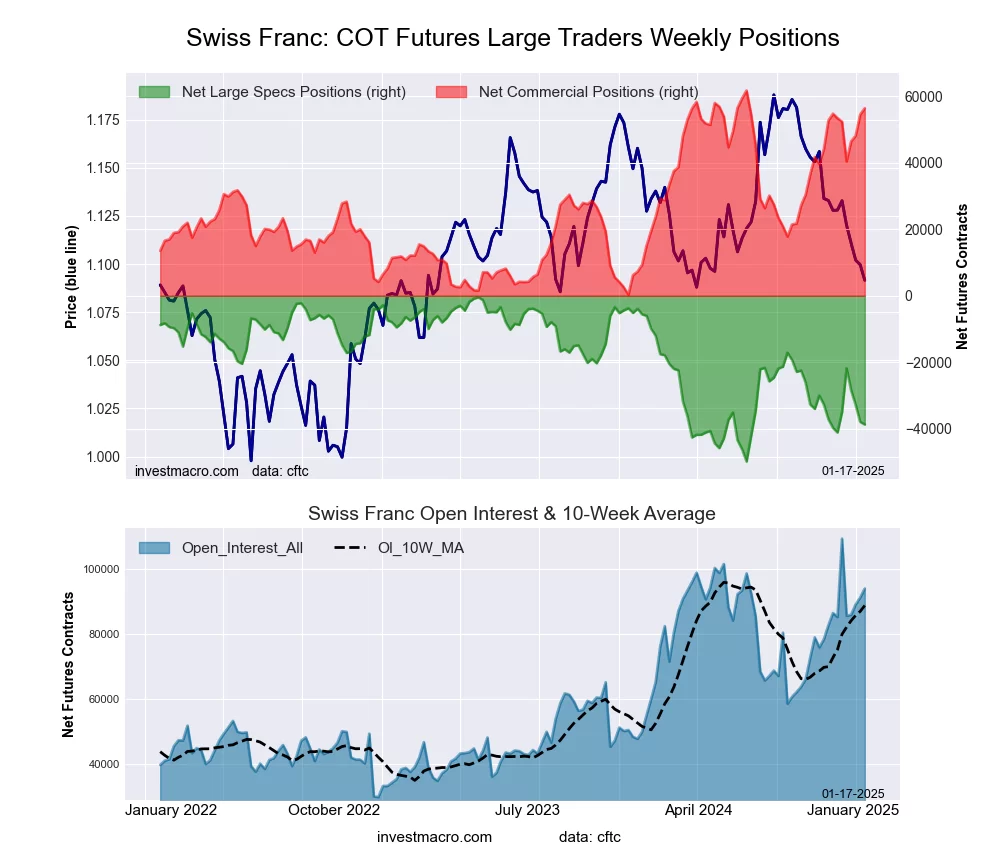
Swiss Franc Forex Futures COT ChartThe Swiss Franc large speculator standing this week reached a net position of -41,837 contracts in the data reported through Tuesday. This was a weekly decline of -3,136 contracts from the previous week which had a total of -38,701 net contracts.

This week’s current strength score (the trader positioning range over the past three years, measured from 0 to 100) shows the speculators are currently Bearish-Extreme with a score of 16.1 percent. The commercials are Bullish-Extreme with a score of 93.6 percent and the small traders (not shown in chart) are Bearish-Extreme with a score of 11.3 percent.

Price Trend-Following Model: Downtrend

Our weekly trend-following model classifies the current market price position as: Downtrend.

SWISS FRANC StatisticsSPECULATORSCOMMERCIALSSMALL TRADERS
– Percent of Open Interest Longs:6.884.28.6
– Percent of Open Interest Shorts:50.224.325.1
– Net Position:-41,83757,758-15,921
– Gross Longs:6,52681,1608,255
– Gross Shorts:48,36323,40224,176
– Long to Short Ratio:0.1 to 13.5 to 10.3 to 1
NET POSITION TREND:
– Strength Index Score (3 Year Range Pct):16.193.611.3
– Strength Index Reading (3 Year Range):Bearish-ExtremeBullish-ExtremeBearish-Extreme
NET POSITION MOVEMENT INDEX:
– 6-Week Change in Strength Index:-13.98.95.9


Canadian Dollar Futures:

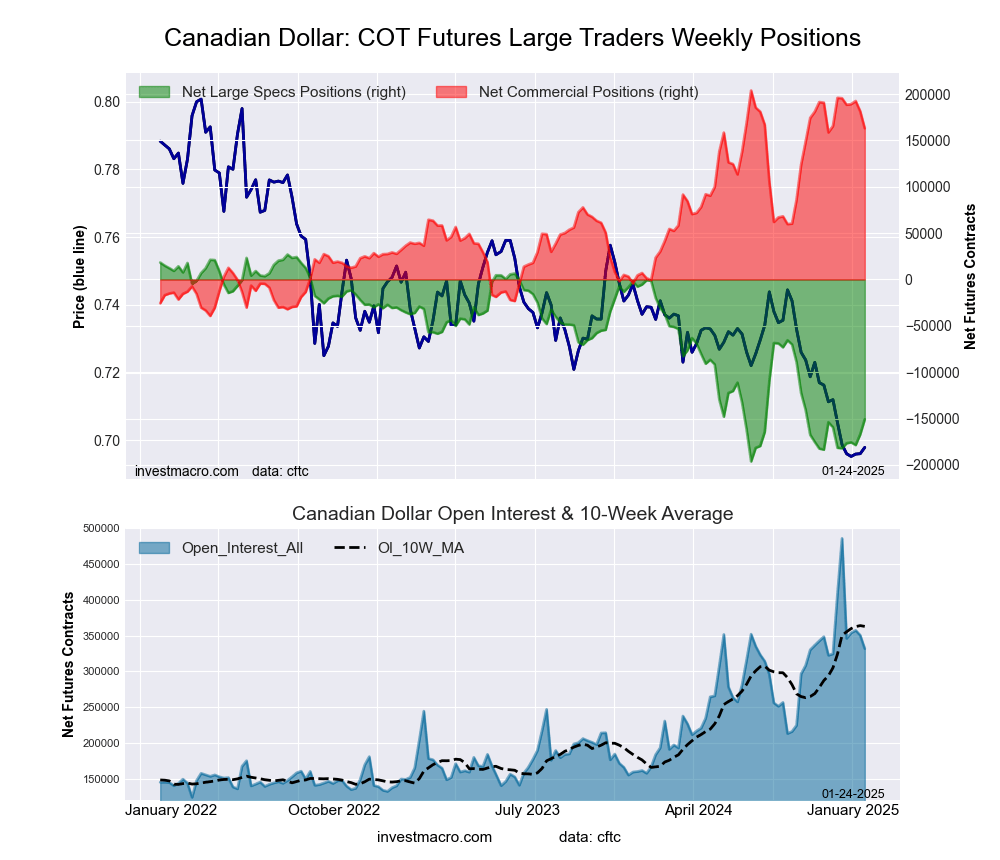
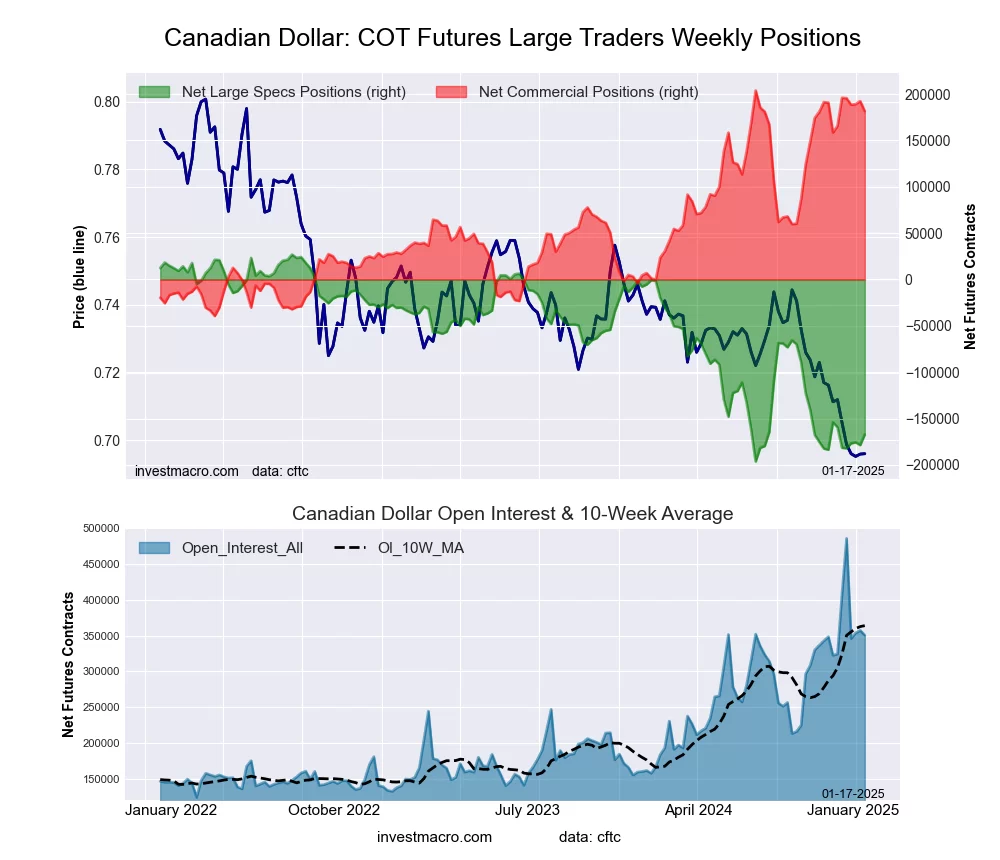
Canadian Dollar Forex Futures COT ChartThe Canadian Dollar large speculator standing this week reached a net position of -150,787 contracts in the data reported through Tuesday. This was a weekly gain of 16,366 contracts from the previous week which had a total of -167,153 net contracts.

This week’s current strength score (the trader positioning range over the past three years, measured from 0 to 100) shows the speculators are currently Bearish with a score of 20.4 percent. The commercials are Bullish-Extreme with a score of 83.3 percent and the small traders (not shown in chart) are Bearish-Extreme with a score of 5.5 percent.

Price Trend-Following Model: Downtrend

Our weekly trend-following model classifies the current market price position as: Downtrend.

CANADIAN DOLLAR StatisticsSPECULATORSCOMMERCIALSSMALL TRADERS
– Percent of Open Interest Longs:5.984.08.2
– Percent of Open Interest Shorts:51.334.811.9
– Net Position:-150,787163,078-12,291
– Gross Longs:19,503278,53527,246
– Gross Shorts:170,290115,45739,537
– Long to Short Ratio:0.1 to 12.4 to 10.7 to 1
NET POSITION TREND:
– Strength Index Score (3 Year Range Pct):20.483.35.5
– Strength Index Reading (3 Year Range):BearishBullish-ExtremeBearish-Extreme
NET POSITION MOVEMENT INDEX:
– 6-Week Change in Strength Index:13.8-13.55.5


Australian Dollar Futures:

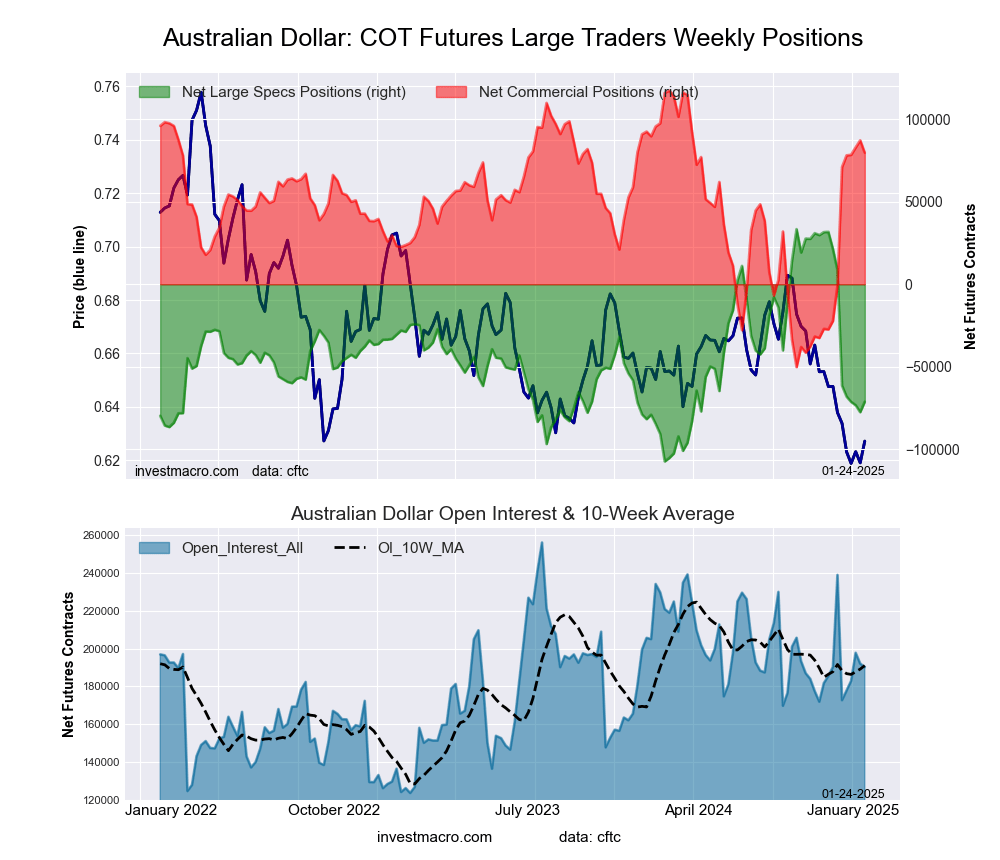
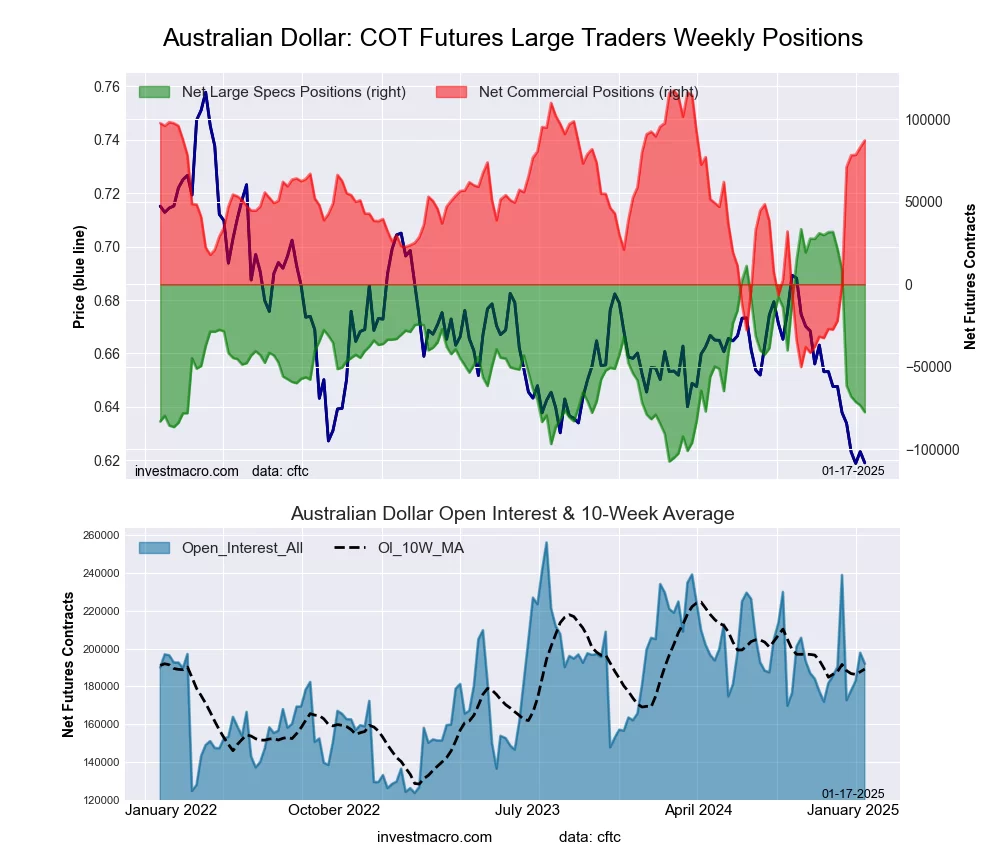
Australian Dollar Forex Futures COT ChartThe Australian Dollar large speculator standing this week reached a net position of -71,296 contracts in the data reported through Tuesday. This was a weekly gain of 6,335 contracts from the previous week which had a total of -77,631 net contracts.

This week’s current strength score (the trader positioning range over the past three years, measured from 0 to 100) shows the speculators are currently Bearish with a score of 25.7 percent. The commercials are Bullish with a score of 77.5 percent and the small traders (not shown in chart) are Bearish with a score of 26.7 percent.

Price Trend-Following Model: Downtrend

Our weekly trend-following model classifies the current market price position as: Downtrend.

AUSTRALIAN DOLLAR StatisticsSPECULATORSCOMMERCIALSSMALL TRADERS
– Percent of Open Interest Longs:16.467.012.7
– Percent of Open Interest Shorts:53.925.017.2
– Net Position:-71,29679,799-8,503
– Gross Longs:31,179127,37524,195
– Gross Shorts:102,47547,57632,698
– Long to Short Ratio:0.3 to 12.7 to 10.7 to 1
NET POSITION TREND:
– Strength Index Score (3 Year Range Pct):25.777.526.7
– Strength Index Reading (3 Year Range):BearishBullishBearish
NET POSITION MOVEMENT INDEX:
– 6-Week Change in Strength Index:-56.648.0-2.0


New Zealand Dollar Futures:

New Zealand Dollar Forex Futures COT ChartThe New Zealand Dollar large speculator standing this week reached a net position of -51,223 contracts in the data reported through Tuesday. This was a weekly lift of 866 contracts from the previous week which had a total of -52,089 net contracts.

This week’s current strength score (the trader positioning range over the past three years, measured from 0 to 100) shows the speculators are currently Bearish-Extreme with a score of 4.0 percent. The commercials are Bullish-Extreme with a score of 96.3 percent and the small traders (not shown in chart) are Bearish with a score of 20.1 percent.

Price Trend-Following Model: Downtrend

Our weekly trend-following model classifies the current market price position as: Downtrend.

NEW ZEALAND DOLLAR StatisticsSPECULATORSCOMMERCIALSSMALL TRADERS
– Percent of Open Interest Longs:9.985.83.9
– Percent of Open Interest Shorts:66.426.46.8
– Net Position:-51,22353,841-2,618
– Gross Longs:8,93877,7763,551
– Gross Shorts:60,16123,9356,169
– Long to Short Ratio:0.1 to 13.2 to 10.6 to 1
NET POSITION TREND:
– Strength Index Score (3 Year Range Pct):4.096.320.1
– Strength Index Reading (3 Year Range):Bearish-ExtremeBullish-ExtremeBearish
NET POSITION MOVEMENT INDEX:
– 6-Week Change in Strength Index:-27.025.113.0


Mexican Peso Futures:

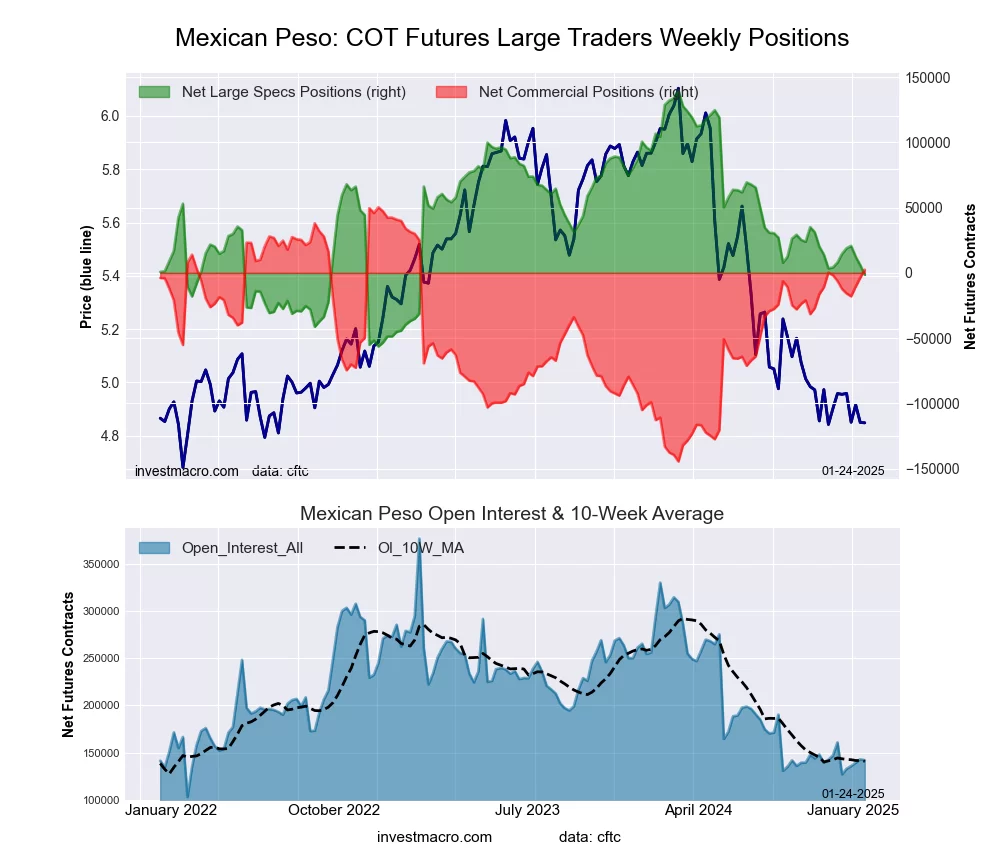
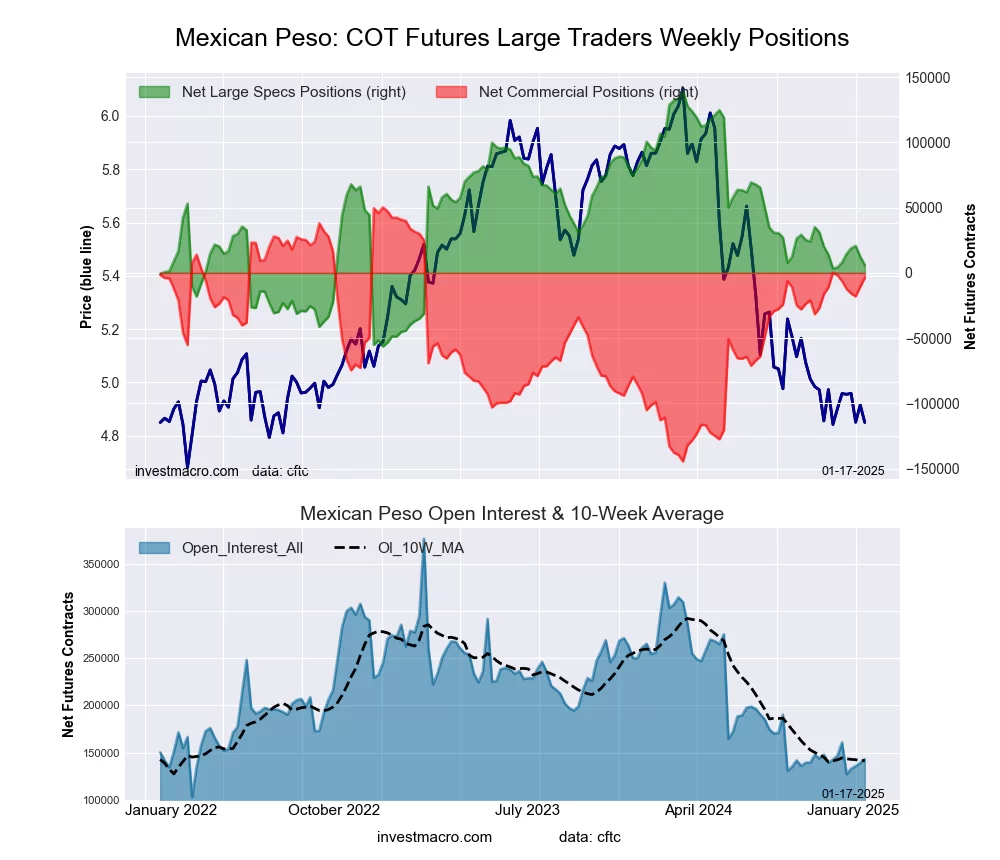
Mexican Peso Futures COT ChartThe Mexican Peso large speculator standing this week reached a net position of -1,544 contracts in the data reported through Tuesday. This was a weekly fall of -7,541 contracts from the previous week which had a total of 5,997 net contracts.

This week’s current strength score (the trader positioning range over the past three years, measured from 0 to 100) shows the speculators are currently Bearish with a score of 28.0 percent. The commercials are Bullish with a score of 75.4 percent and the small traders (not shown in chart) are Bearish-Extreme with a score of 17.9 percent.

Price Trend-Following Model: Downtrend

Our weekly trend-following model classifies the current market price position as: Downtrend.

MEXICAN PESO StatisticsSPECULATORSCOMMERCIALSSMALL TRADERS
– Percent of Open Interest Longs:33.960.52.7
– Percent of Open Interest Shorts:34.958.83.4
– Net Position:-1,5442,423-879
– Gross Longs:47,98585,7633,886
– Gross Shorts:49,52983,3404,765
– Long to Short Ratio:1.0 to 11.0 to 10.8 to 1
NET POSITION TREND:
– Strength Index Score (3 Year Range Pct):28.075.417.9
– Strength Index Reading (3 Year Range):BearishBullishBearish-Extreme
NET POSITION MOVEMENT INDEX:
– 6-Week Change in Strength Index:-4.84.44.9


Brazilian Real Futures:

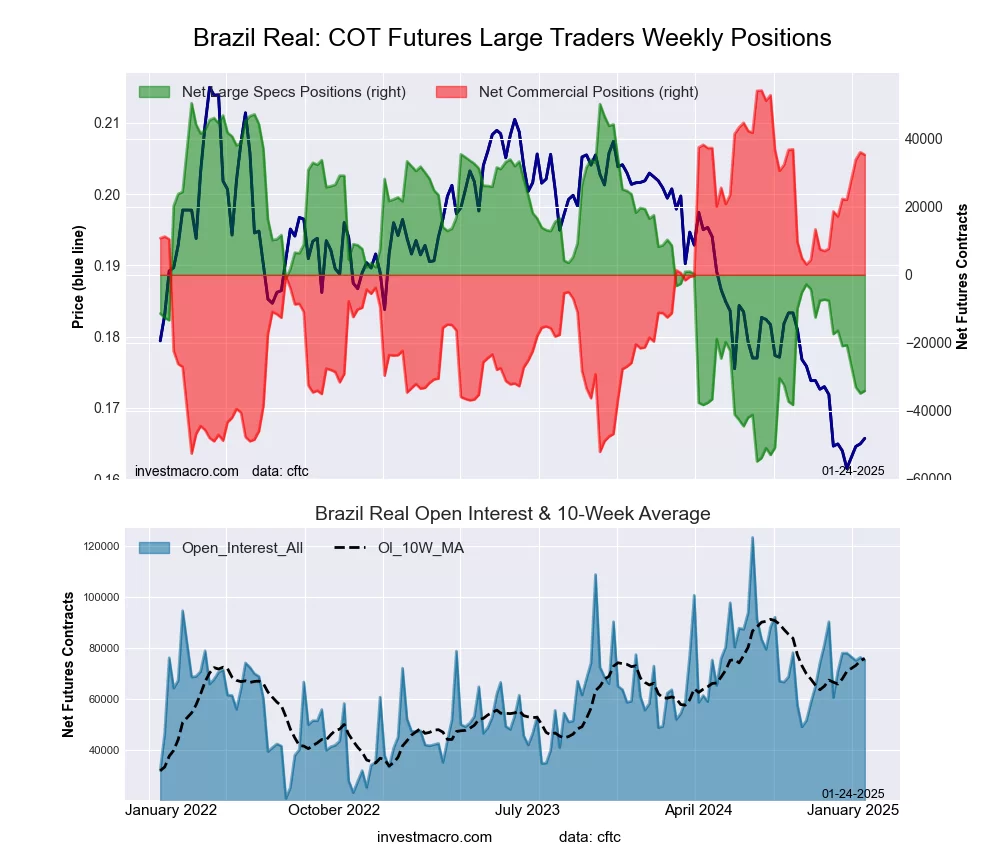
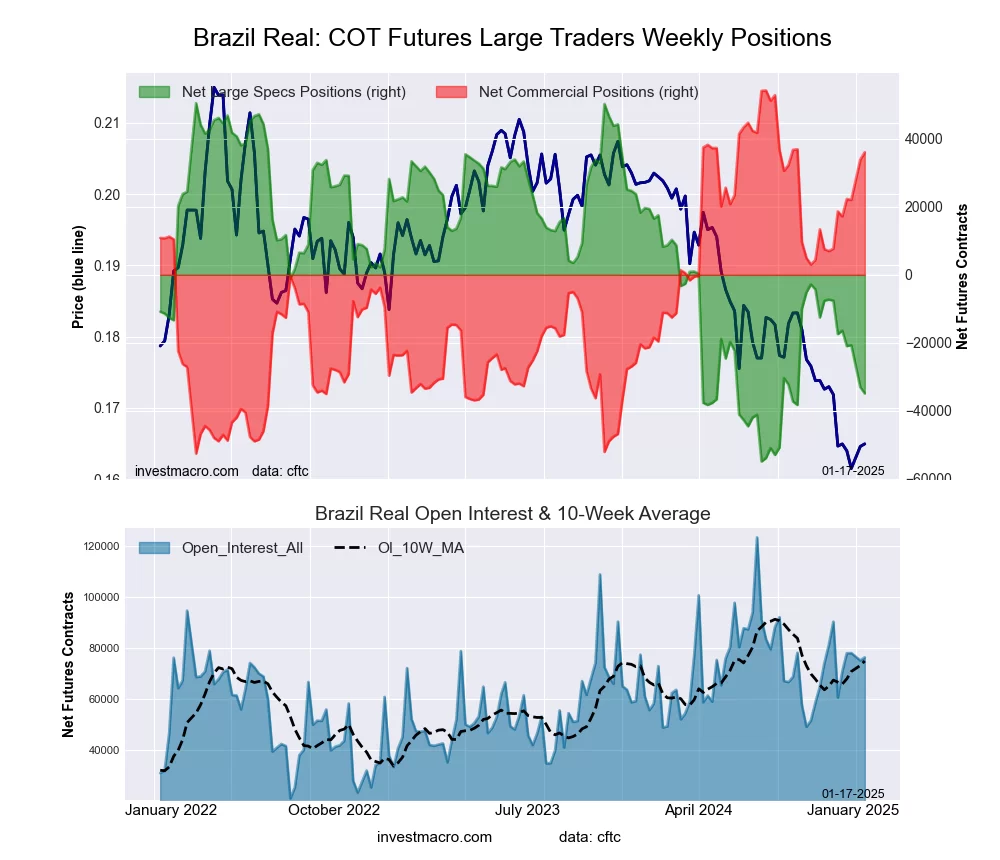
Brazil Real Futures COT ChartThe Brazilian Real large speculator standing this week reached a net position of -34,131 contracts in the data reported through Tuesday. This was a weekly increase of 743 contracts from the previous week which had a total of -34,874 net contracts.

This week’s current strength score (the trader positioning range over the past three years, measured from 0 to 100) shows the speculators are currently Bearish-Extreme with a score of 19.7 percent. The commercials are Bullish-Extreme with a score of 82.3 percent and the small traders (not shown in chart) are Bearish-Extreme with a score of 14.3 percent.

Price Trend-Following Model: Downtrend

Our weekly trend-following model classifies the current market price position as: Downtrend.

BRAZIL REAL StatisticsSPECULATORSCOMMERCIALSSMALL TRADERS
– Percent of Open Interest Longs:27.469.62.7
– Percent of Open Interest Shorts:72.822.64.3
– Net Position:-34,13135,292-1,161
– Gross Longs:20,60552,3032,046
– Gross Shorts:54,73617,0113,207
– Long to Short Ratio:0.4 to 13.1 to 10.6 to 1
NET POSITION TREND:
– Strength Index Score (3 Year Range Pct):19.782.314.3
– Strength Index Reading (3 Year Range):Bearish-ExtremeBullish-ExtremeBearish-Extreme
NET POSITION MOVEMENT INDEX:
– 6-Week Change in Strength Index:-16.817.0-2.1


Bitcoin Futures:

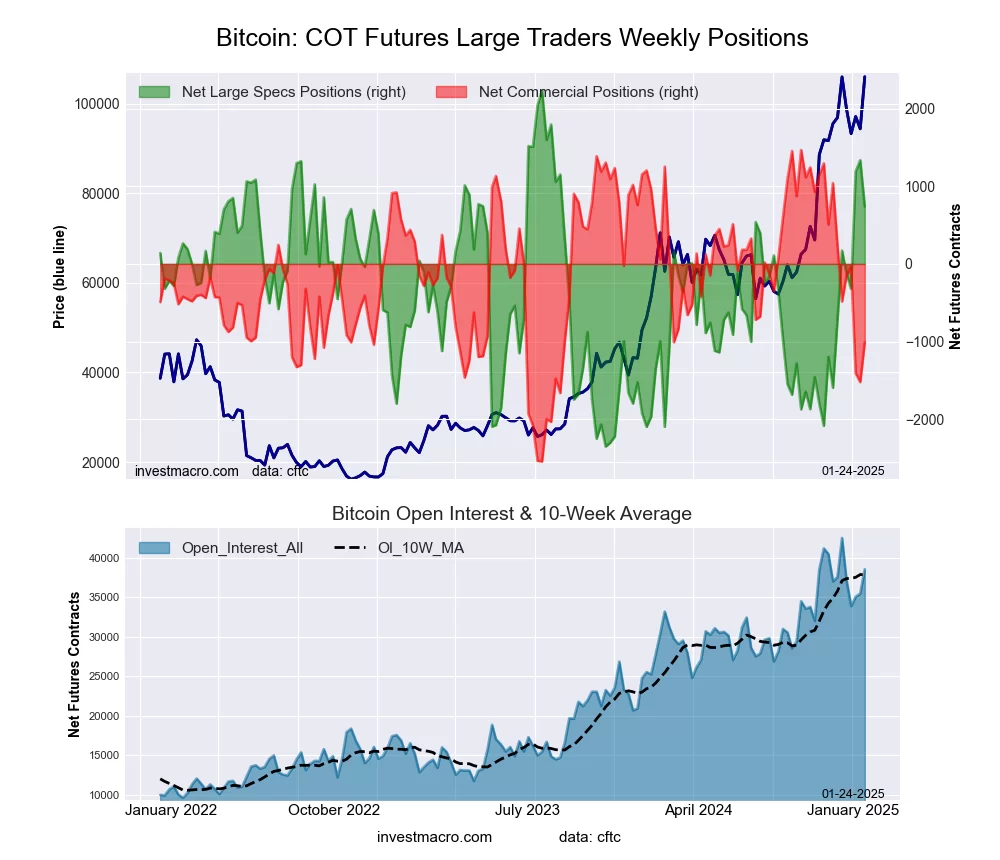
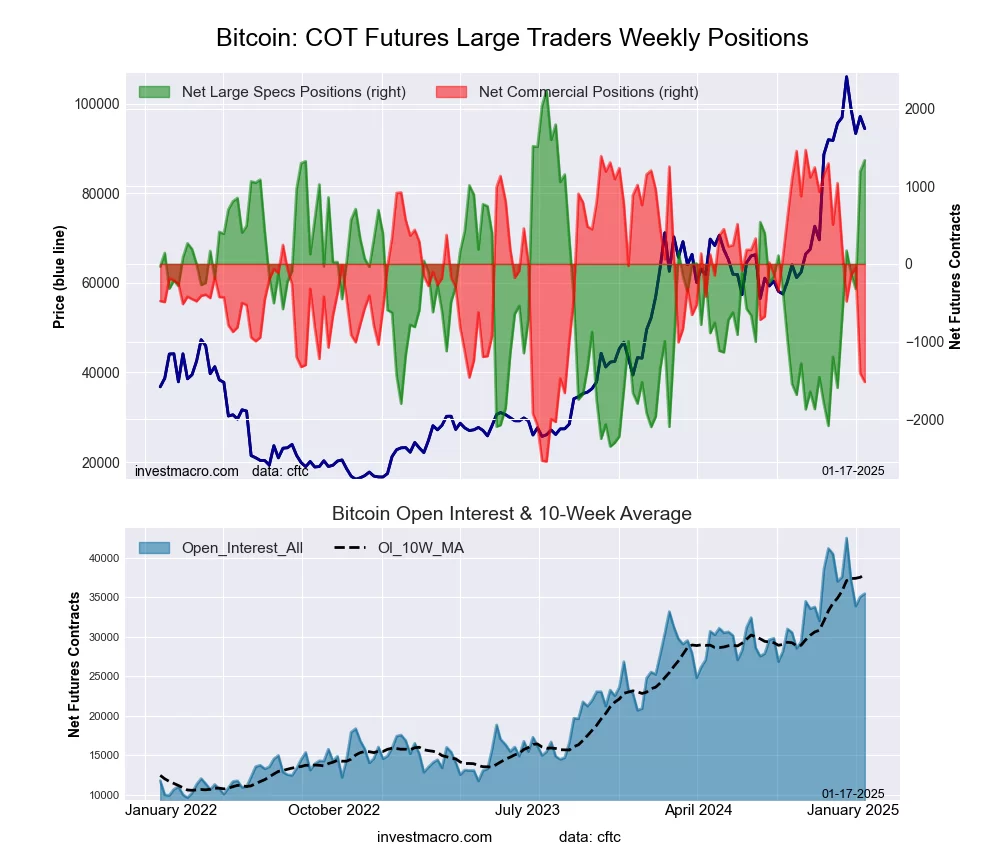
Bitcoin Crypto Futures COT ChartThe Bitcoin large speculator standing this week reached a net position of 739 contracts in the data reported through Tuesday. This was a weekly fall of -596 contracts from the previous week which had a total of 1,335 net contracts.

This week’s current strength score (the trader positioning range over the past three years, measured from 0 to 100) shows the speculators are currently Bullish with a score of 67.4 percent. The commercials are Bearish with a score of 38.3 percent and the small traders (not shown in chart) are Bearish with a score of 30.1 percent.

Price Trend-Following Model: Uptrend

Our weekly trend-following model classifies the current market price position as: Uptrend.

BITCOIN StatisticsSPECULATORSCOMMERCIALSSMALL TRADERS
– Percent of Open Interest Longs:75.54.23.9
– Percent of Open Interest Shorts:73.66.83.2
– Net Position:739-1,007268
– Gross Longs:29,1211,6251,486
– Gross Shorts:28,3822,6321,218
– Long to Short Ratio:1.0 to 10.6 to 11.2 to 1
NET POSITION TREND:
– Strength Index Score (3 Year Range Pct):67.438.330.1
– Strength Index Reading (3 Year Range):BullishBearishBearish
NET POSITION MOVEMENT INDEX:
– 6-Week Change in Strength Index:31.8-31.0-16.0


Article By InvestMacroReceive our weekly COT Newsletter

*COT Report: The COT data, released weekly to the public each Friday, is updated through the most recent Tuesday (data is 3 days old) and shows a quick view of how large speculators or non-commercials (for-profit traders) were positioned in the futures markets.

The CFTC categorizes trader positions according to commercial hedgers (traders who use futures contracts for hedging as part of the business), non-commercials (large traders who speculate to realize trading profits) and nonreportable traders (usually small traders/speculators) as well as their open interest (contracts open in the market at time of reporting). See CFTC criteria here.

Speculator Extremes: Coffee, Live Cattle & Gold lead weekly Bullish Positions

By InvestMacro 

The latest update for the weekly Commitment of Traders (COT) report was released by the Commodity Futures Trading Commission (CFTC) on Friday for data ending on January 21st.

This weekly Extreme Positions report highlights the Most Bullish and Most Bearish Positions for the speculator category. Extreme positioning in these markets can foreshadow strong moves in the underlying market.

To signify an extreme position, we use the Strength Index (also known as the COT Index) of each instrument, a common method of measuring COT data. The Strength Index is simply a comparison of current trader positions against the range of positions over the previous 3 years. We use over 80 percent as extremely bullish and under 20 percent as extremely bearish. (Compare Strength Index scores across all markets in the data table or cot leaders table)


Here Are This Week’s Most Bullish Speculator Positions:

Coffee


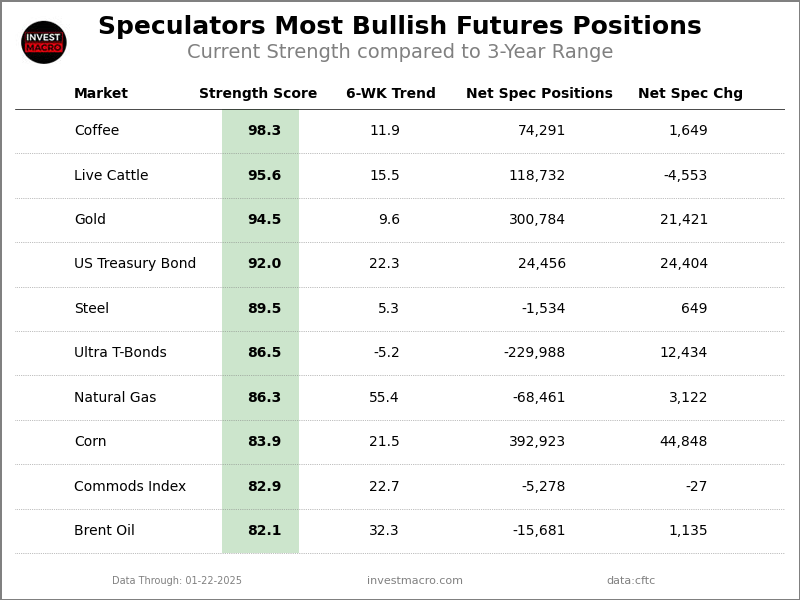
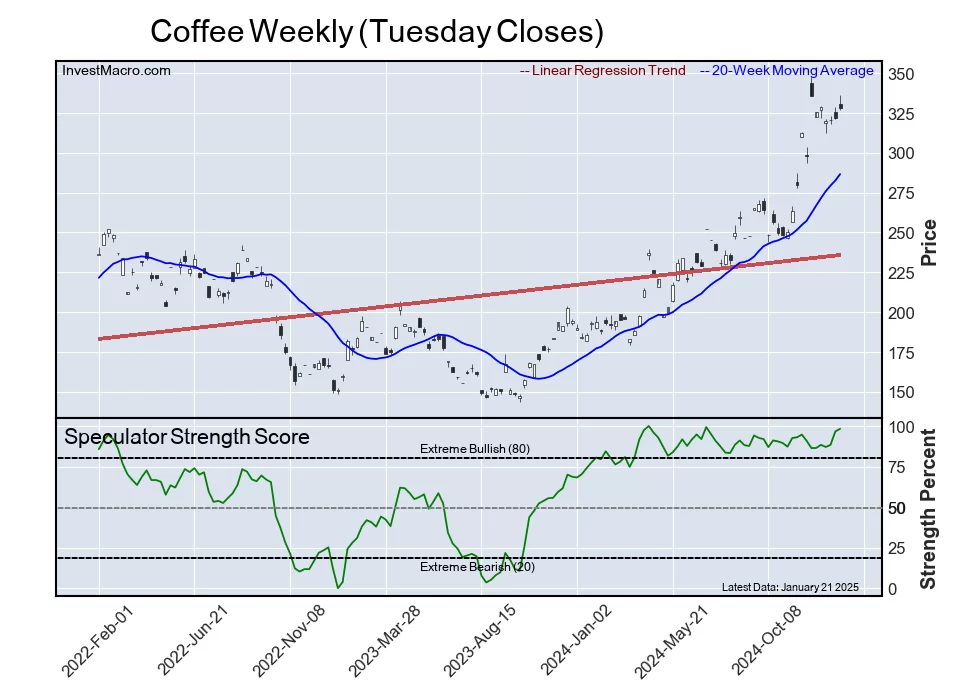
The Coffee speculator position comes in as the most bullish extreme standing this week. The Coffee speculator level is currently at a 98.3 percent score of its 3-year range.

The six-week trend for the percent strength score totaled 11.9 this week. The overall net speculator position was a total of 74,291 net contracts this week with an edge higher by 1,649 contract in the weekly speculator bets.


Speculators or Non-Commercials Notes:

Speculators, classified as non-commercial traders by the CFTC, are made up of large commodity funds, hedge funds and other significant for-profit participants. The Specs are generally regarded as trend-followers in their behavior towards price action – net speculator bets and prices tend to go in the same directions. These traders often look to buy when prices are rising and sell when prices are falling. To illustrate this point, many times speculator contracts can be found at their most extremes (bullish or bearish) when prices are also close to their highest or lowest levels.

These extreme levels can be dangerous for the large speculators as the trade is most crowded, there is less trading ammunition still sitting on the sidelines to push the trend further and prices have moved a significant distance. When the trend becomes exhausted, some speculators take profits while others look to also exit positions when prices fail to continue in the same direction. This process usually plays out over many months to years and can ultimately create a reverse effect where prices start to fall and speculators start a process of selling when prices are falling.


Live Cattle


The Live Cattle speculator position comes next in the extreme standings this week. The Live Cattle speculator level is now at a 95.6 percent score of its 3-year range.

The six-week trend for the percent strength score was 15.5 this week. The speculator position registered 118,732 net contracts this week with a weekly decline of -4,553 contracts in speculator bets.


Gold


The Gold speculator position comes in third this week in the extreme standings. The Gold speculator level resides at a 94.5 percent score of its 3-year range.

The six-week trend for the speculator strength score came in at 9.6 this week. The overall speculator position was 300,784 net contracts this week with a gain by 21,421 contracts in the weekly speculator bets.


US Treasury Bond


The US Treasury Bond speculator position comes up number four in the extreme standings this week. The US Treasury Bond speculator level is at a 92.0 percent score of its 3-year range.

The six-week trend for the speculator strength score totaled a change of 22.3 this week. The overall speculator position was 24,456 net contracts this week with a boost of 24,404 contracts in the speculator bets.


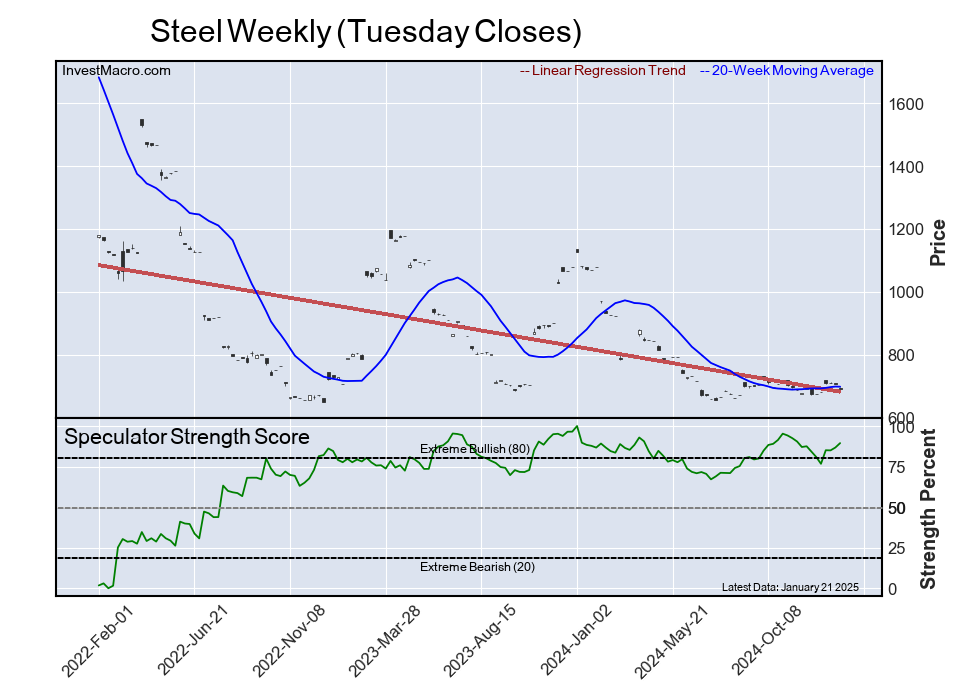
Steel


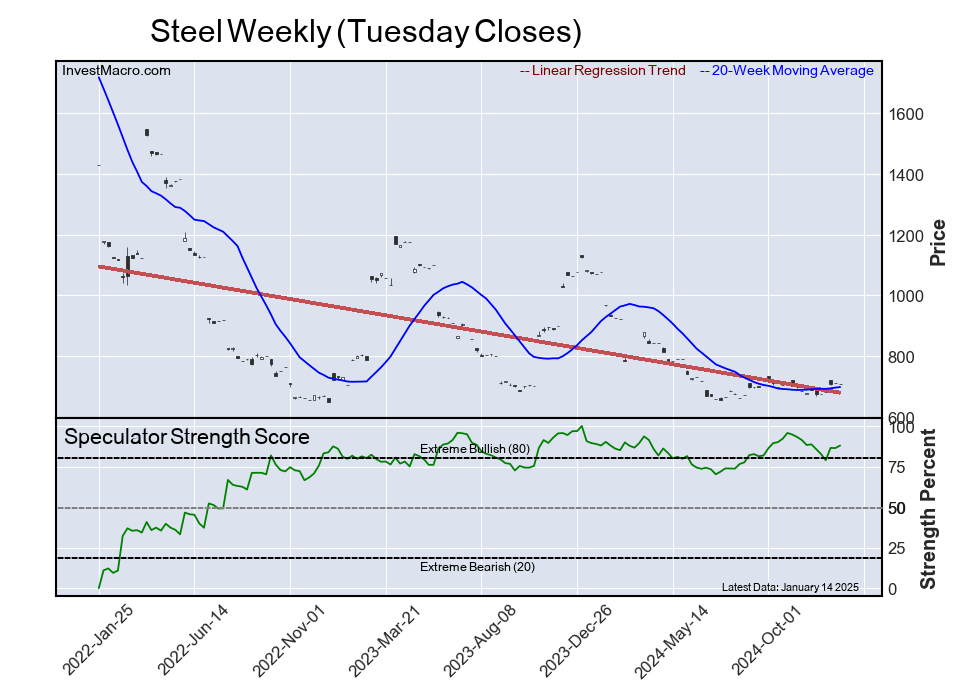
The Steel speculator position rounds out the top five in this week’s bullish extreme standings. The Steel speculator level sits at a 89.5 percent score of its 3-year range. The six-week trend for the speculator strength score was 5.3 this week.

The speculator position was -1,534 net contracts this week with a rise of 649 contracts in the weekly speculator bets.


This Week’s Most Bearish Speculator Positions:

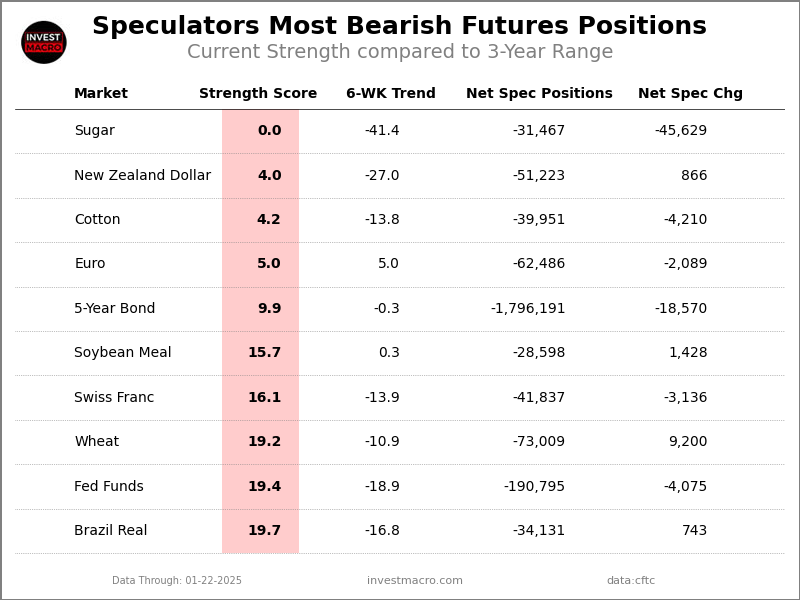
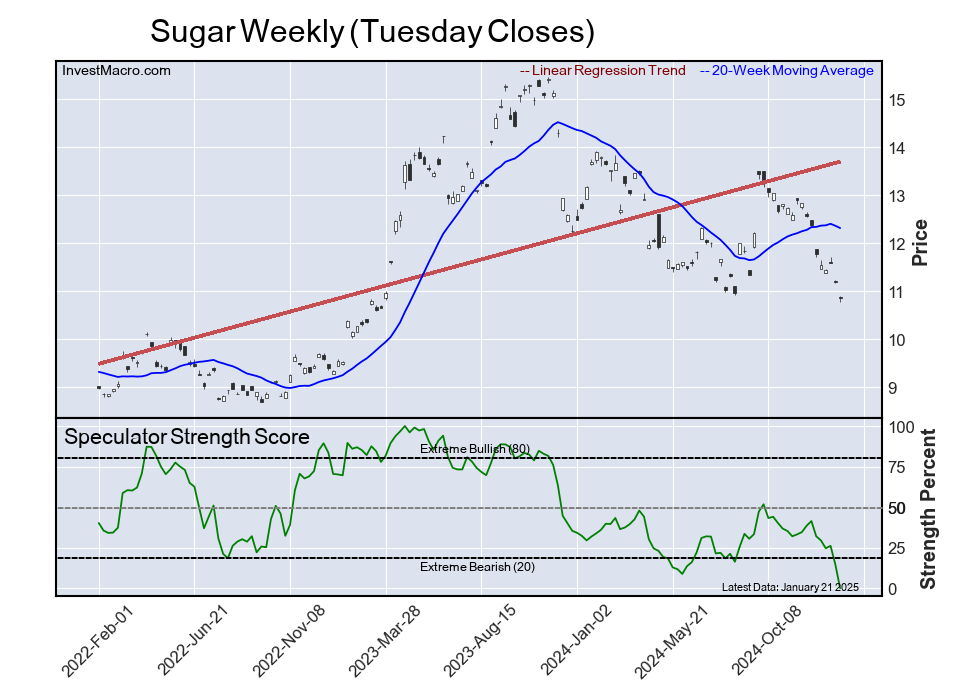
Sugar


The Sugar speculator position comes in as the most bearish extreme standing this week. The Sugar speculator level is at a 0.0 percent score of its 3-year range.

The six-week trend for the speculator strength score was -41.4 this week. The overall speculator position was -31,467 net contracts this week with a drop of -45,629 contracts in the speculator bets.


New Zealand Dollar


The New Zealand Dollar speculator position comes in next for the most bearish extreme standing on the week. The New Zealand Dollar speculator level is at a 4.0 percent score of its 3-year range.

The six-week trend for the speculator strength score was -27.0 this week. The speculator position was -51,223 net contracts this week with an edge higher by 866 contracts in the weekly speculator bets.


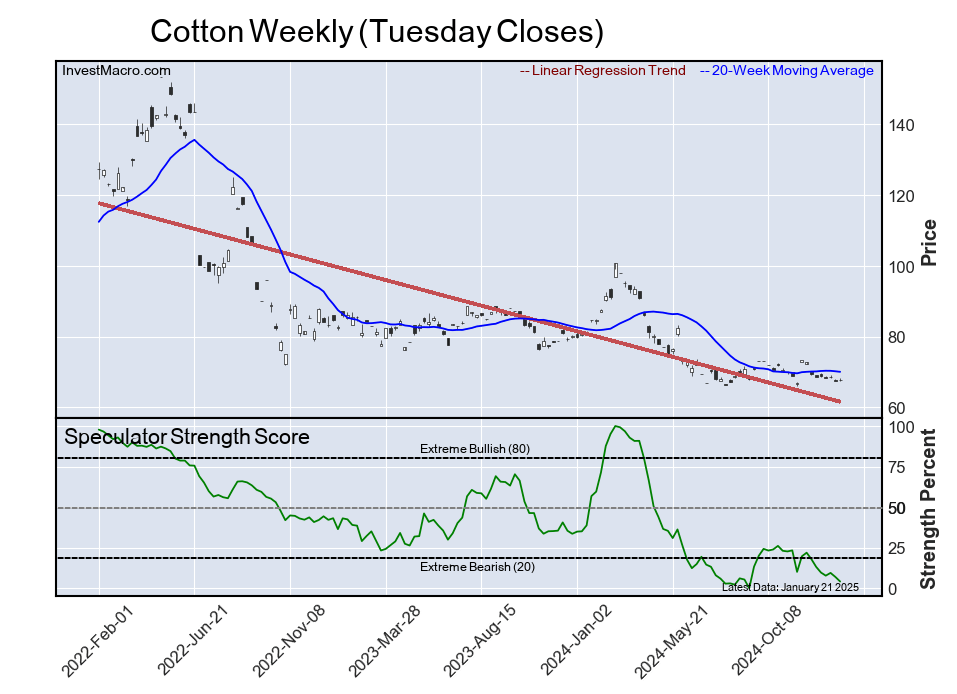
Cotton


The Cotton speculator position comes in as third most bearish extreme standing of the week. The Cotton speculator level resides at a 4.2 percent score of its 3-year range.

The six-week trend for the speculator strength score was -13.8 this week. The overall speculator position was -39,951 net contracts this week with a decrease of -4,210 contracts in the speculator bets.


Euro


The Euro speculator position comes in as this week’s fourth most bearish extreme standing. The Euro speculator level is at a 5.0 percent score of its 3-year range.

The six-week trend for the speculator strength score was 5.0 this week. The speculator position was -62,486 net contracts this week with a decline by -2,089 contracts in the weekly speculator bets.


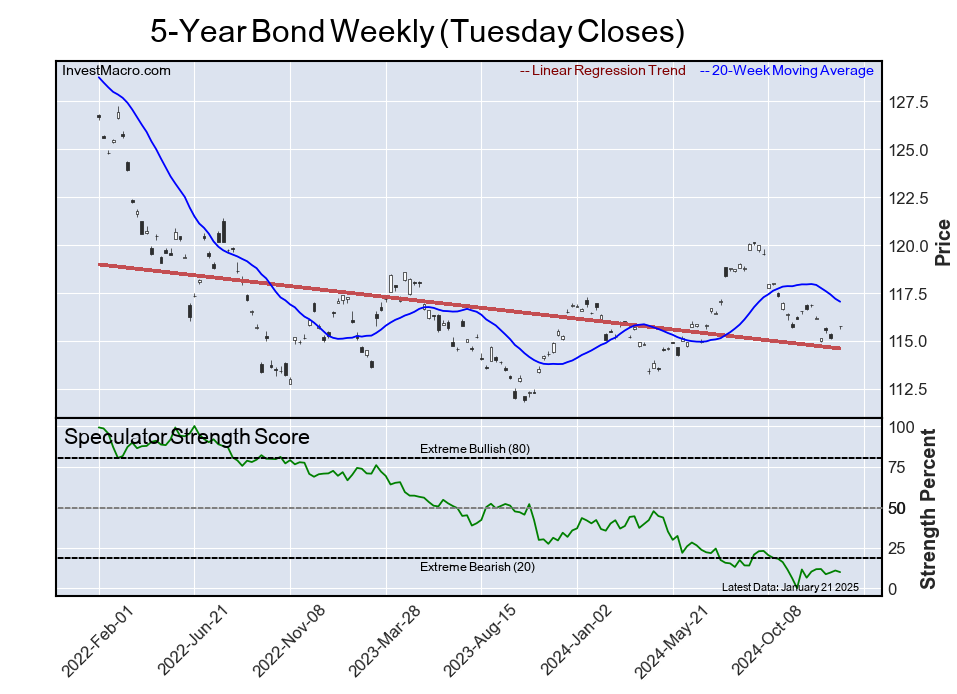
5-Year Bond


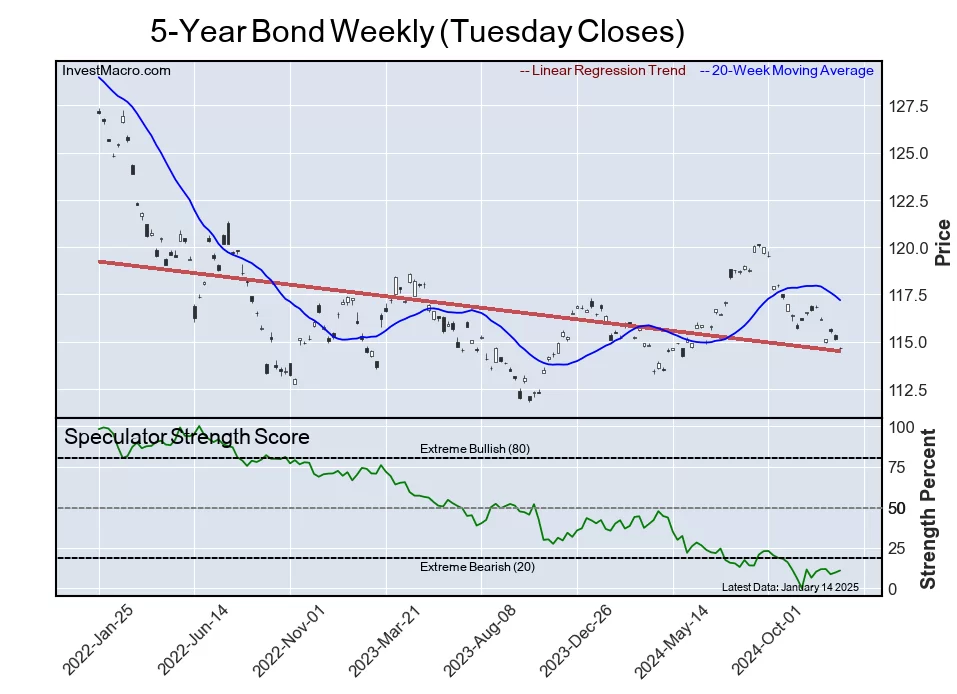
Finally, the 5-Year Bond speculator position comes in as the fifth most bearish extreme standing for this week. The 5-Year Bond speculator level is at a 9.9 percent score of its 3-year range.

The six-week trend for the speculator strength score was -0.3 this week. The speculator position was -1,796,191 net contracts this week with a shortfall by -18,570 contracts in the weekly speculator bets.


Article By InvestMacroReceive our weekly COT Newsletter

*COT Report: The COT data, released weekly to the public each Friday, is updated through the most recent Tuesday (data is 3 days old) and shows a quick view of how large speculators or non-commercials (for-profit traders) were positioned in the futures markets.

The CFTC categorizes trader positions according to commercial hedgers (traders who use futures contracts for hedging as part of the business), non-commercials (large traders who speculate to realize trading profits) and nonreportable traders (usually small traders/speculators) as well as their open interest (contracts open in the market at time of reporting). See CFTC criteria here.

Week Ahead: Big Tech back in the spotlight

By ForexTime 

  • 4 of “Magnificent 7” tech companies set to publish earnings
  • Combined market cap of 4 tech titans over $9.5 trillion
  • Meta could move over 7% ↑ or ↓ post-earnings
  • Apple second largest company in the world reports results Thursday
  • Beyond earnings, central banks & Trump in focus

Major central bank decisions and earnings from the largest companies in the world will dominate the week ahead:

Monday, 27th Jan

  • CN50: China industrial profits, manufacturing and non-manufacturing PMI
  • GER40: Germany IFO business climate
  • EUR: ECB President Christine Lagarde speech
  • SG20: Singapore unemployment

Tuesday, 28th Jan

  • USDInd: US consumer confidence, durable goods
  • US30: Boeing earnings

Wednesday, 29th Jan

  • AU200: Australia CPI
  • EU50: ASML earnings
  • CAD: Canada rate decision
  • SEK: Sweden rate decision
  • US500: Tesla, Microsoft, Meta earnings, Fed rate decision

Thursday, 30th Jan

  • EUR: ECB rate decision, consumer confidence, unemployment, GDP
  • GER40: Germany GDP
  • ZAR: South Africa rate decision
  • USDInd: US GDP, jobless claims
  • NAS100: Apple earnings

Friday, 31st Jan

  • GER40: Germany CPI, unemployment
  • JP225: Japan unemployment, Tokyo CPI, industrial production, retail sales
  • RUS2000: US personal income & spending, PCE inflation

Big tech earnings may hijack the headlines with the likes of Tesla, Microsoft, Meta and Apple set to reveal their latest quarterly results.

These major players with a combined market cap of over $9.5 trillion could provide fresh insights into how the industry fared last quarter.

Artificial intelligence is still a hot topic, but investors should consider a new variable President Trump. Whether it’s tougher tariffs or softer regulations, Trump is bound to influence big tech over the next four years.

Here is what you need to know:

    1) Microsoft

Microsoft reports its fiscal second-quarter earnings on Wednesday 29th after US markets close.

Its shares are up 6% year-to-date, adding to the 12% gains secured in 2024. Microsoft has invested tens of billions of dollars into AI, but investors have yet to see the returns expected. So, the tech giant has little room for error with exceptional results required to justify its $3.32 trillion valuation. Much focus will be on the Azure side of the business which is likely to remain the driver of growth.

Markets forecast a 3.6% move, either up or down, for Microsoft stocks post-earnings.

microsoft

    2) Meta

Meta is set to report fourth-quarter earnings after US markets close on Wednesday 29th.

Shares of the tech company have gained 9% this year, trading very close to all-time highs. Markets expect a year-over-year increase in earnings and revenue growth, but all eyes will be on the advertising business. Any insight into how the TikTok ban in the US will impact Meta’s ad sales and updates on Llama 4 will be welcomed by investors.

Markets are forecasting a 7.4% move, either up or down, for Meta stocks post-earnings.

meta2

    3) Tesla

Tesla is also set to release its fourth-quarter earnings on Wednesday after the close of US trading.

A few weeks ago, Tesla reported its first decline in annual deliveries which hit sentiment toward its shares. Prices are up only 2% year-to-date, adding to the 62.5% gains secured in 2024. Any updates on the autonomous driving software, new vehicle launches, and revenues will be perused by investors to evaluate its business outlook.

Markets are forecasting an 8.2% move, either up or down, for Tesla stocks post-earnings.

tesla

    4) Apple

The second most valuable company in the world with a market cap of $3.36 trillion reports its fiscal first-quarter earnings on Thursday 30th after US markets close.

Apple kicked off 2025 in a rough fashion, falling over 10% YTD amid growing concerns over lagging sales. Still, first-quarter revenues are expected to rise 3.8% year-on-year to $124.2 billion compared to $119.6 billion in the same quarter last year.

Nevertheless, investors will keep their eyes on the performance of iPhone sales and any initiatives integrating AI across its ecosystem.

Markets are projecting a 4% move, either up or down, for Apple stocks post-earnings.

apple


Forex-Time-LogoArticle by ForexTime

ForexTime Ltd (FXTM) is an award winning international online forex broker regulated by CySEC 185/12 www.forextime.com

I’m an economist. Here’s why I’m worried the California insurance crisis could trigger broader financial instability

By Gary W. Yohe, Wesleyan University 

The devastating wildfires in Los Angeles have made one threat very clear: Climate change is undermining the insurance systems American homeowners rely on to protect themselves from catastrophes. This breakdown is starting to become painfully clear as families and communities struggle to rebuild.

But another threat remains less recognized: This collapse could pose a threat to the stability of financial markets well beyond the scope of the fires.

It’s been widely accepted for more than a decade that humanity has three choices when it comes to responding to climate risks: adapt, abate or suffer. As an expert in economics and the environment, I know that some degree of suffering is inevitable — after all, humans have already raised the average global temperature by 1.6 degrees Celsius, or 2.9 degrees Fahrenheit. That’s why it’s so important to have functioning insurance markets.

While insurance companies are often cast as villains, when the system works well, insurers play an important role in improving social welfare. When an insurer sets premiums that accurately reflect and communicate risk — what economists call “actuarially fair insurance” — that helps people share risk efficiently, leaving every individual safer and society better off.

But the scale and intensity of the Southern California fires — linked in part to climate change, including record-high global temperatures in 2023 and again in 2024 — has brought a big problem into focus: In a world impacted by increasing climate risk, traditional insurance models no longer apply.

How climate change broke insurance

Historically, the insurance system has worked by relying on experts who study records of past events to estimate how likely it is that a covered event might happen. They then use this information to determine how much to charge a given policyholder. This is called “pricing the risk.”

Many California wildfire survivors face insurance struggles, as this CBS Evening News report shows.

When Americans try to borrow money to buy a home, they expect that mortgage lenders will make them purchase and maintain a certain level of homeowners insurance coverage, even if they chose to self-insure against unlikely additional losses. But thanks to climate change, risks are increasingly difficult to measure, and costs are increasingly catastrophic. It seems clear to me that a new paradigm is needed.

California provided the beginnings of such a paradigm with its Fair Access to Insurance program, known as FAIR. When it was created in 1968, its authors expected that it would provide insurance coverage for the few owners who were unable to get normal policies because they faced special risks from exposure to unusual weather and local climates.

But the program’s coverage is capped at US$500,000 per property – well below the losses that thousands of Los Angeles residents are experiencing right now. Total losses from the wildfires’ first week alone are estimated to exceed $250 billion.

How insurance could break the economy

This state of affairs isn’t just dangerous for homeowners and communities — it could create widespread financial instability. And it’s not just me making this point. For the past several years, central bankers at home and abroad have raised similar concerns. So let’s talk about the risks of large-scale financial contagion.

Anyone who remembers the Great Recession of 2007-2009 knows that seemingly localized problems can snowball.

In that event, the value of opaque bundles of real estate derivatives collapsed from artificial and unsustainable highs, leaving millions of mortgages around the U.S. “underwater.” These properties were no longer valued above owners’ mortgage liabilities, so their best choice was simply to walk away from the obligation to make their monthly payments.

Lenders were forced to foreclose, often at an enormous loss, and the collapse of real estate markets across the U.S. created a global recession that affected financial stability around the world.

Forewarned by that experience, the U.S. Federal Reserve Board wrote in 2020 that “features of climate change can also increase financial system vulnerabilities.” The central bank noted that uncertainty and disagreement about climate risks can lead to sudden declines in asset values, leaving people and businesses vulnerable.

At that time, the Fed had a specific climate-based example of a not-implausible contagion in mind – global risks from sudden large increases in global sea level rise over something like 20 years. A collapse of the West Antarctic Ice Sheet could create such an event, and coastlines around the world would not have enough time to adapt.

In a 2020 press conference, Federal Reserve Chair Jerome Powell discusses climate change and financial stability.

The Fed now has another scenario to consider – one that’s not hypothetical.

It recently put U.S. banks through “stress tests” to gauge their vulnerability to climate risks. In these exercises, the Fed asked member banks to respond to hypothetical but not-implausible climate-based contagion scenarios that would threaten the stability of the entire system.

We will now see if the plans borne of those stress tests can work in the face of enormous wildfires burning throughout an urban area that’s also a financial, cultural and entertainment center of the world.The Conversation

About the Author:

Gary W. Yohe, Huffington Foundation Professor of Economics and Environmental Studies, Wesleyan University

This article is republished from The Conversation under a Creative Commons license. Read the original article.


Knowing less about AI makes people more open to having it in their lives – new research

By Chiara Longoni, Bocconi University; Gil Appel, George Washington University, and Stephanie Tully, University of Southern California 

The rapid spread of artificial intelligence has people wondering: who’s most likely to embrace AI in their daily lives? Many assume it’s the tech-savvy – those who understand how AI works – who are most eager to adopt it.

Surprisingly, our new research (published in the Journal of Marketing) finds the opposite. People with less knowledge about AI are actually more open to using the technology. We call this difference in adoption propensity the “lower literacy-higher receptivity” link.

This link shows up across different groups, settings and even countries. For instance, our analysis of data from market research company Ipsos spanning 27 countries reveals that people in nations with lower average AI literacy are more receptive towards AI adoption than those in nations with higher literacy.

Similarly, our survey of US undergraduate students finds that those with less understanding of AI are more likely to indicate using it for tasks like academic assignments.

The reason behind this link lies in how AI now performs tasks we once thought only humans could do. When AI creates a piece of art, writes a heartfelt response or plays a musical instrument, it can feel almost magical – like it’s crossing into human territory.

Of course, AI doesn’t actually possess human qualities. A chatbot might generate an empathetic response, but it doesn’t feel empathy. People with more technical knowledge about AI understand this.

They know how algorithms (sets of mathematical rules used by computers to carry out particular tasks), training data (used to improve how an AI system works) and computational models operate. This makes the technology less mysterious.

On the other hand, those with less understanding may see AI as magical and awe inspiring. We suggest this sense of magic makes them more open to using AI tools.

Our studies show this lower literacy-higher receptivity link is strongest for using AI tools in areas people associate with human traits, like providing emotional support or counselling. When it comes to tasks that don’t evoke the same sense of human-like qualities – such as analysing test results – the pattern flips. People with higher AI literacy are more receptive to these uses because they focus on AI’s efficiency, rather than any “magical” qualities.

It’s not about capability, fear or ethics

Interestingly, this link between lower literacy and higher receptivity persists even though people with lower AI literacy are more likely to view AI as less capable, less ethical, and even a bit scary. Their openness to AI seems to stem from their sense of wonder about what it can do, despite these perceived drawbacks.

This finding offers new insights into why people respond so differently to emerging technologies. Some studies suggest consumers favour new tech, a phenomenon called “algorithm appreciation”, while others show scepticism, or “algorithm aversion”. Our research points to perceptions of AI’s “magicalness” as a key factor shaping these reactions.

These insights pose a challenge for policymakers and educators. Efforts to boost AI literacy might unintentionally dampen people’s enthusiasm for using AI by making it seem less magical. This creates a tricky balance between helping people understand AI and keeping them open to its adoption.

To make the most of AI’s potential, businesses, educators and policymakers need to strike this balance. By understanding how perceptions of “magicalness” shape people’s openness to AI, we can help develop and deploy new AI-based products and services that take the way people view AI into account, and help them understand the benefits and risks of AI.

And ideally, this will happen without causing a loss of the awe that inspires many people to embrace this new technology.The Conversation

About the Author:

Chiara Longoni, Associate Professor, Marketing and Social Science, Bocconi University; Gil Appel, Assistant Professor of Marketing, School of Business, George Washington University, and Stephanie Tully, Associate Professor of Marketing, USC Marshall School of Business, University of Southern California

This article is republished from The Conversation under a Creative Commons license. Read the original article.


5 Stocks Ideas from December & January including 3 Tech Companies

By InvestMacro Research

The first quarter of 2025 is underway and we wanted to highlight some of the companies that have been recently added to our Cosmic Rays Watchlist. The Cosmic Rays Watchlist is the output from our proprietary fundamental analysis algorithm and these companies made the list in the last 30 days.

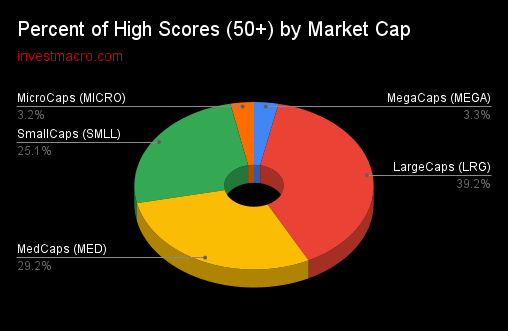
The algo examines company fundamental metrics, earnings trends and overall sector strength trends. The aim is identify quality dividend-paying companies on the NYSE and Nasdaq stock exchanges. If a company scores over 50, it gets added to our Watchlist for further analysis.

We use this system as a stock market ideas generator and to update our Watchlist every quarter. However, be aware the fundamental system does not take the stock price as a direct element in our rating so one must compare each idea with their current stock prices (this is not a timing tool).

Many studies are consistently showing overvalued markets at the current time and that has to be taken into consideration with any stock market idea. As with all investment ideas, past performance does not guarantee future results. A stock added to our list is not a recommendation to buy or sell the security.

Here we go with 5 of our Top Stocks scored in December 2024 & so far in January 2025:


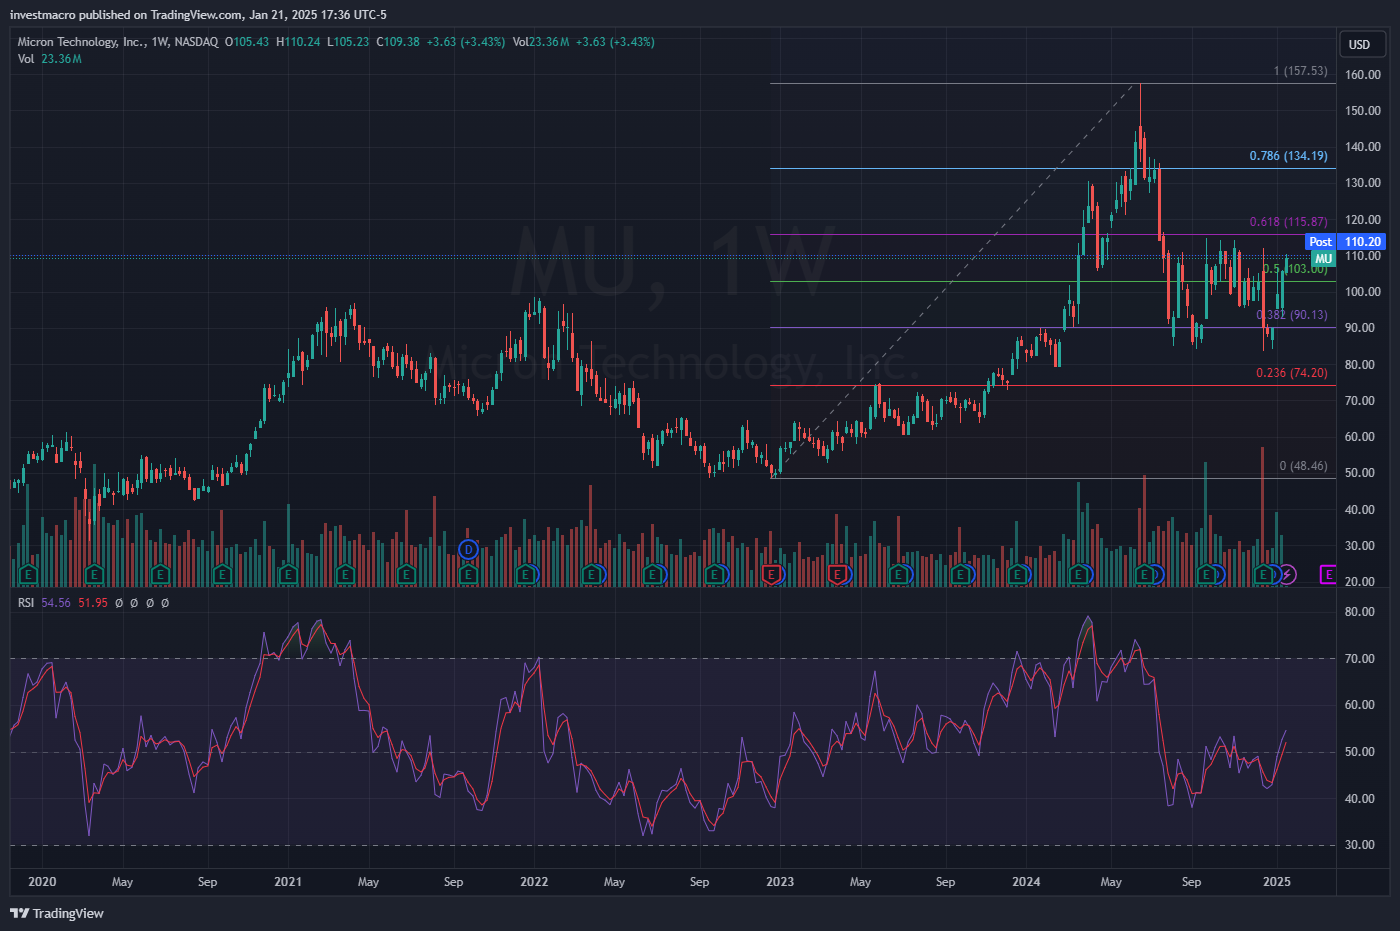
Micron Technology, Inc. (MU):

Micron Technology, Inc. (Symbol: MU) was recently added to our Cosmic Rays WatchList. MU scored a 62 in our fundamental rating system in late December 2024.

At time of writing, only 4.77% of stocks have scored a 60 or better out of a total of 10,772 scores in our earnings database. This stock is on our Watchlist for the first time and rose by 77 system points from our last update.

MU is a Large Cap stock and part of the Technology sector. The industry focus for MU is Semiconductors.

MU has beat earnings expectations four consecutive quarters and has a dividend of 0.43 percent with a payout ratio near just 7 percent. The MU stock price has outperformed the Technology Sector benchmark over the past 52 weeks by a small margin with a gain of nearly +26.00 percent.

Company Description (courtesy of SEC.gov):

Micron Technology, Inc. designs, manufactures, and sells memory and storage products worldwide. The company operates through four segments: Compute and Networking Business Unit, Mobile Business Unit, Storage Business Unit, and Embedded Business Unit. It provides memory and storage technologies comprises DRAM products, which are dynamic random access memory semiconductor devices with low latency that provide high-speed data retrieval.

Company Website: https://www.micron.com


Asset vs Sector Benchmark:*P/E Ratio (TTM)*52-Week Price Return*Beta (S&P500)
– Stock: Micron Technology, Inc. (MU)31.325.921.18
– Benchmark Symbol: XLK38.222.751.2


* Data through January 21, 2025


Conagra Brands, Inc. (CAG):

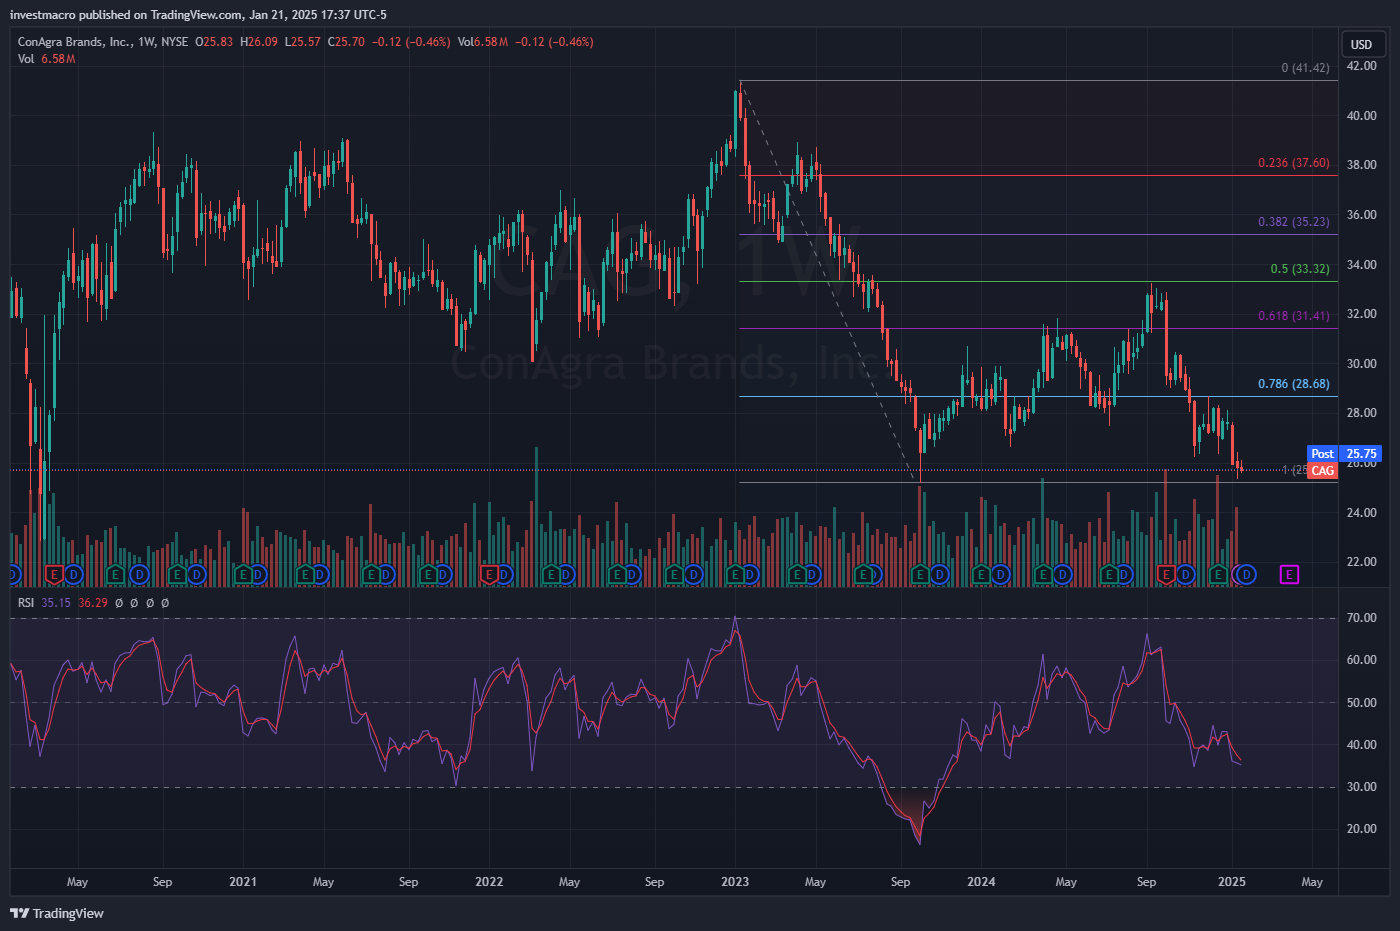
Conagra Brands, Inc. (Symbol: CAG) was recently added to our Cosmic Rays WatchList. CAG scored a 64 in our fundamental rating system in December 2024.

At time of writing, only 4.77% of stocks have scored a 60 or better out of a total of 10,772 scores in our earnings database. This stock has made our Watchlist a total of 4 times and rose by 23 system points from our last update.

CAG is a Large Cap stock and part of the Consumer Defensive sector. The industry focus for CAG is Packaged Foods.

CAG has beat earnings expectations in three out of the past four quarters and has a dividend of 5.42 percent with a payout ratio around 68 percent. The CAG stock price has under-performed the Consumer Defensive Sector benchmark over the past 52 weeks and has fallen by -10.74 percent compared with the benchmark gain of +6.91 percent.

Company Description (courtesy of SEC.gov):

Conagra Brands, Inc., together with its subsidiaries, operates as a consumer packaged goods food company in North America. The company operates in four segments: Grocery & Snacks, Refrigerated & Frozen, International, and Foodservice.

Company Website: https://www.conagrabrands.com


Asset vs Sector Benchmark:*P/E Ratio (TTM)*52-Week Price Return*Beta (S&P500)
– Stock: Conagra Brands, Inc. (CAG)25.0-10.740.33
– Benchmark Symbol: XLP22.76.910.6


* Data through January 21, 2025


TD SYNNEX Corporation (SNX):

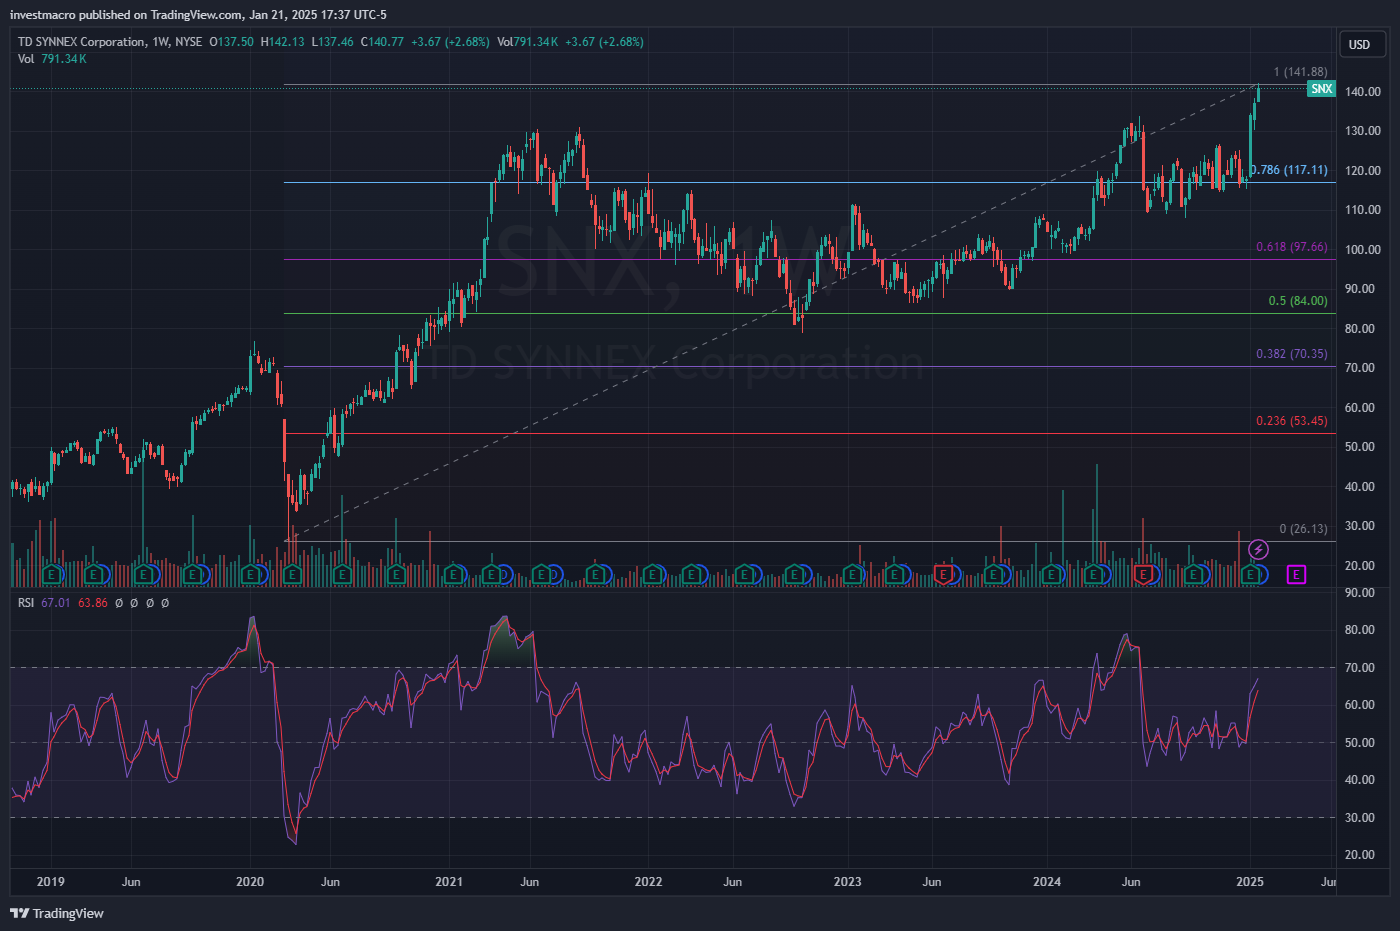
TD SYNNEX Corporation (Symbol: SNX) was recently added to our Cosmic Rays WatchList. SNX scored a 65 in our fundamental rating system on January 13, 2025.

At time of writing, only 4.77% of stocks have scored a 60 or better out of a total of 10,772 scores in our earnings database. This stock has made our Watchlist a total of 4 times and rose by 41 system points from our last update.

SNX is a Large Cap stock and part of the Technology sector. The industry focus for SNX is Technology Distributors.

SNX has beat earnings expectations two quarters in a row and in three out of the past four quarters. SNX sports a dividend of 1.28 percent with a payout ratio around 24 percent. The SNX stock price has beaten the Technology Sector benchmark over the past 52 weeks and has risen by 32.81 percent compared with the benchmark gain of +22.75 percent.

Company Description (courtesy of SEC.gov):

TD SYNNEX Corporation provides business process services in the United States and internationally. The company distributes PC systems, mobile phones and accessories, printers, peripherals, supplies, endpoint technology software, consumer electronics, information technology (IT) systems including data center server and storage solutions, system components, software, networking, communications and security equipment, technology software, and converged and hyper-converged infrastructure, as well as computing components.

Company Website: https://www.tdsynnex.com


Asset vs Sector Benchmark:*P/E Ratio (TTM)*52-Week Price Return*Beta (S&P500)
– Stock: TD SYNNEX Corporation (SNX)17.732.811.4
– Benchmark Symbol: XLK38.222.751.2


* Data through January 21, 2025


Science Applications International Corporation (SAIC):

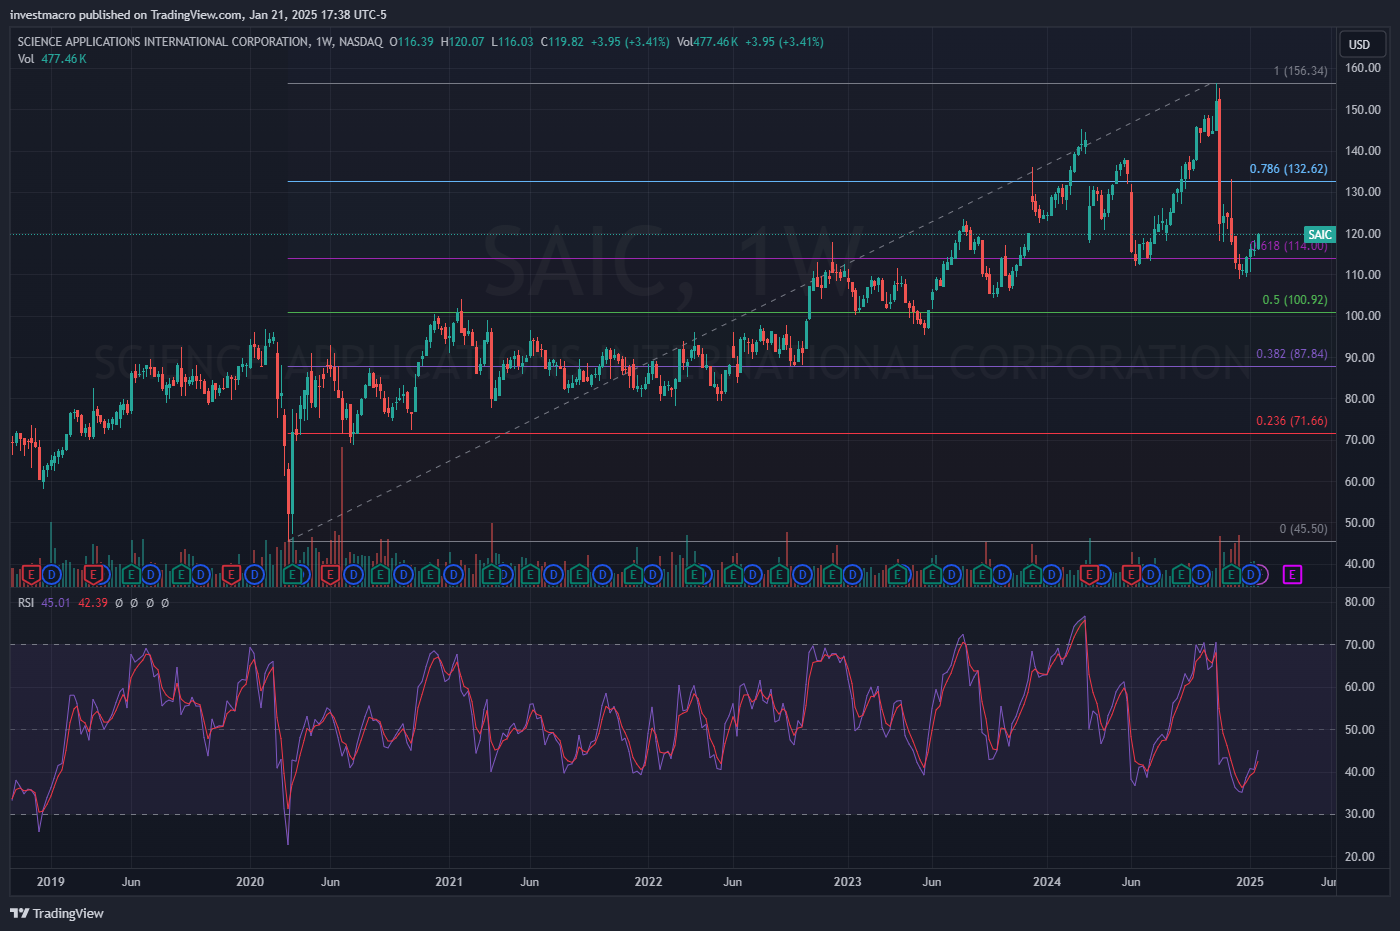
Science Applications International Corporation (Symbol: SAIC) was recently added to our Cosmic Rays WatchList. SAIC scored a 50 in our fundamental rating system in December 2024.

At time of writing, only 8.20% of stocks have scored a 50 or better out of a total of 10,772 scores in our earnings database. This stock is on our Watchlist for the first time and rose by 46 system points from our last update.

SAIC is a Medium Cap stock and part of the Technology sector. The industry focus for SAIC is Information Technology Services.

SAIC has beat earnings expectations two quarters in a row and gives out a dividend of 1.28 percent with a payout ratio around 16 percent. The SAIC stock price has under-performed the Technology Sector benchmark over the past 52 weeks with a shortfall of -8.2 percent compared with the benchmark gain of +22.75 percent.

Company Description (courtesy of SEC.gov):

Science Applications International Corporation provides technical, engineering, and enterprise information technology (IT) services primarily in the United States. The company’s offerings include engineering; technology integration; IT modernization; maintenance of ground and maritime systems; logistics; training and simulation; operation and program support services; and end-to-end services, such as design, development, integration, deployment,

Company Website: https://www.saic.com


Asset vs Sector Benchmark:*P/E Ratio (TTM)*52-Week Price Return*Beta (S&P500)
– Stock: Science Applications International Corporation (SAIC)20.2-8.20.69
– Benchmark Symbol: XLK38.222.751.2


* Data through January 21, 2025


Wipro Limited (WIT):

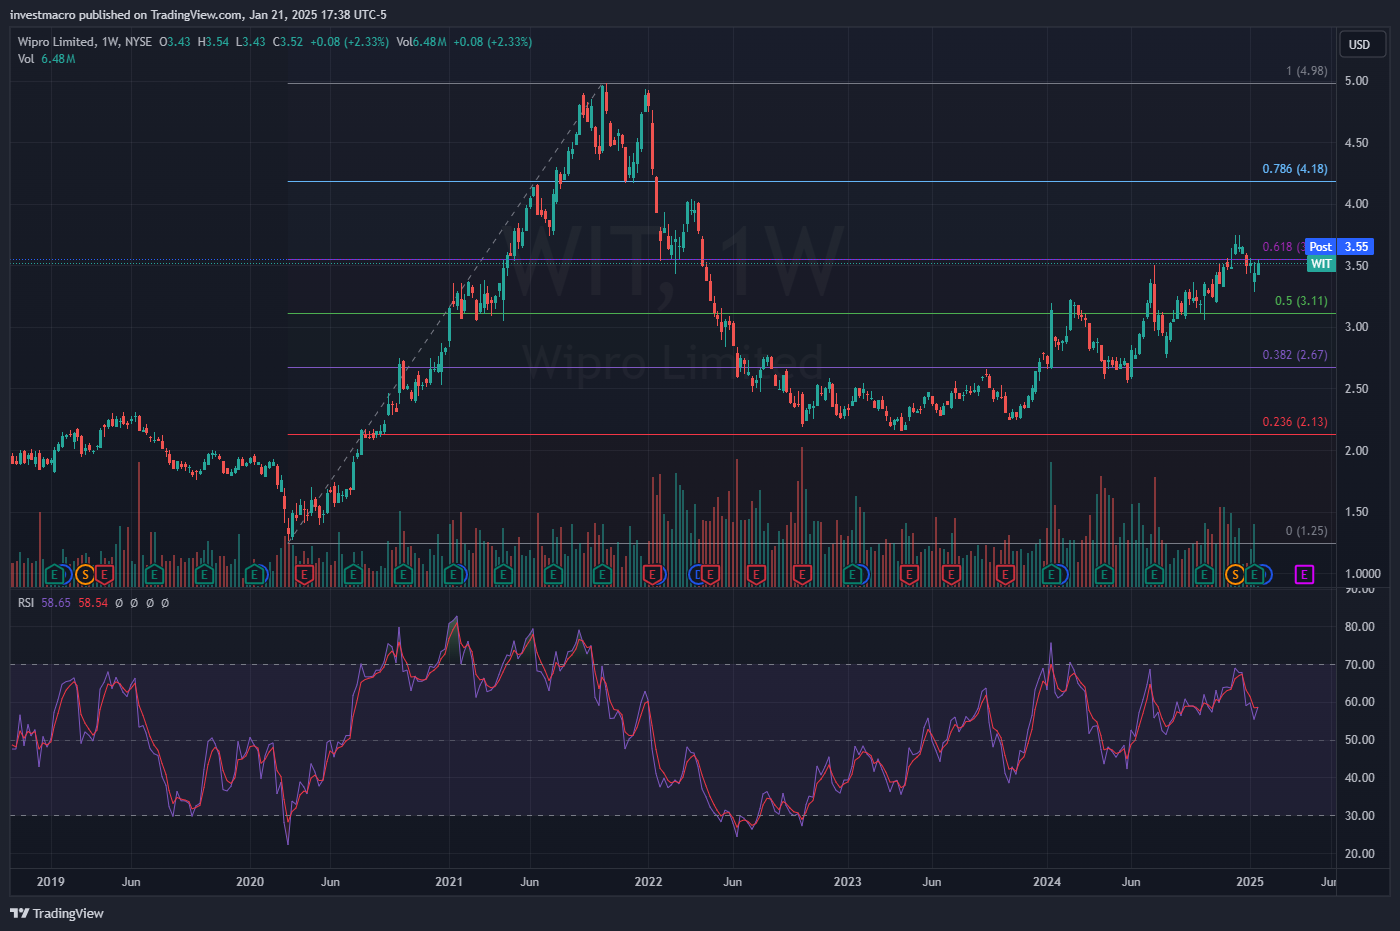
Wipro Limited (Symbol: WIT) was recently added to our Cosmic Rays WatchList. WIT scored a 53 in our fundamental rating system on January 21, 2025.

At time of writing, only 8.20% of stocks have scored a 50 or better out of a total of 10,772 scores in our earnings database. This stock is on our Watchlist for the first time and rose by 23 system points from our last update.

WIT is a Large Cap stock and part of the Technology sector. The industry focus for WIT is Information Technology Services.

WIT has beat earnings expectations in two out of the past fur quarters and met expectations in the others. WIT gives out a dividend of 2.02 percent with a payout ratio around 30 percent. The WIT stock price has slightly under-performed the Technology Sector benchmark over the past 52 weeks with a gain of 20.7 percent compared with the benchmark gain of +22.75 percent.

Company Description (courtesy of SEC.gov):

Wipro Limited operates as information technology (IT), consulting, and business process services company worldwide. It operates through three segments: IT Services, IT Products, and India State Run Enterprise Services (ISRE). The IT Services segment offers IT and IT-enabled services, including digital strategy advisory, customer-centric design, technology and IT consulting, custom application design, development, re-engineering and maintenance, s

Company Website: https://www.wipro.com


Asset vs Sector Benchmark:*P/E Ratio (TTM)*52-Week Price Return*Beta (S&P500)
– Stock: Wipro Limited (WIT)27.120.70.71
– Benchmark Symbol: XLK38.222.751.2


* Data through January 21, 2025


By InvestMacro – Be sure to join our stock market newsletter to get our updates and to see more top companies we add to our stock watch list.

All information, stock ideas and opinions on this website are for general informational purposes only and do not constitute investment advice. Stock scores are a data driven process through company fundamentals and are not a recommendation to buy or sell a security. Company descriptions provided by sec.gov.

Speculators continue to raise US Dollar Index Bets into 2025

By InvestMacro

Here are the latest charts and statistics for the Commitment of Traders (COT) data published by the Commodities Futures Trading Commission (CFTC).

The latest COT data is updated through Tuesday January 14th and shows a quick view of how large market participants (for-profit speculators and commercial traders) were positioned in the futures markets. All currency positions are in direct relation to the US dollar where, for example, a bet for the euro is a bet that the euro will rise versus the dollar while a bet against the euro will be a bet that the euro will decline versus the dollar.

Weekly Speculator Changes led by Canadian Dollar & US Dollar Index

The COT currency market speculator bets were just slightly lower this week as five out of the eleven currency markets we cover had higher positioning while the other six markets had lower speculator contracts.

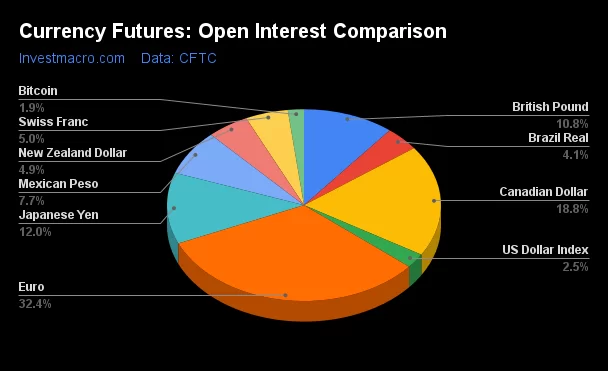
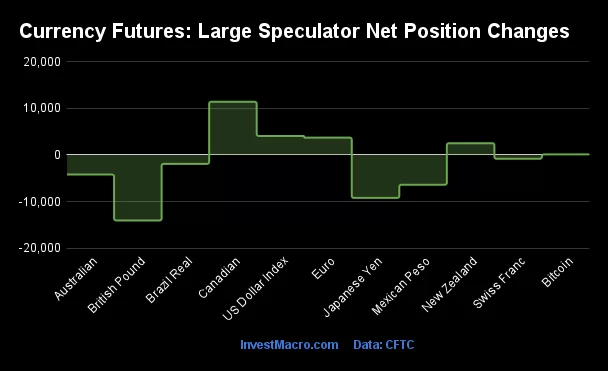
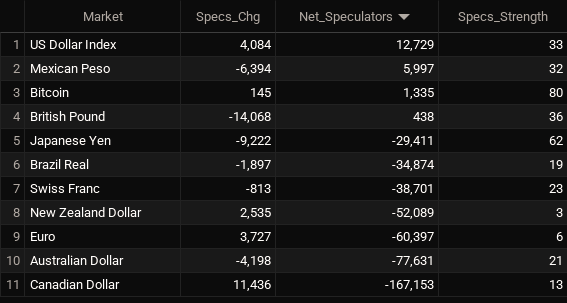
Leading the gains for the currency markets was the Canadian Dollar (11,436 contracts) with the US Dollar Index (4,084 contracts), the EuroFX (3,727 contracts), the New Zealand Dollar (2,535 contracts) and Bitcoin (145 contracts) also showing positive weeks.

The currencies seeing declines in speculator bets on the week were the British Pound (-14,068 contracts), the Japanese Yen (-9,222 contracts), the Australian Dollar (-4,198 contracts), the Mexican Peso (-6,394 contracts), the Brazilian Real (-1,897 contracts) and the Swiss Franc (-813 contracts) also registering lower bets on the week.

Speculators continue to raise US Dollar Index Bets into 2025

Highlighting the COT currency’s data this week is the increase in the speculator’s positioning for the US Dollar Index that’s carried over from December into the new year. The large speculative US Dollar Index positions rose this week by over 4,000+ contracts and have now gained for five consecutive weeks. This recent rise in speculator sentiment has been carried over each week from December 17th to January 14th for a total +15,953 net contract boost over the 5-week period.

This has pushed the overall bullish speculator position above the +10,000 contract threshold for the first time since September 10th. The Dollar Index bets, previously, had spent a total of seven weeks in October, November and early December in bearish or negative contract territory before finally turning around in mid-December.

The Dollar Index futures price (DX) was slightly lower to close this week but overall the trend has been higher for the DX. Since the last short-term bottom on the weekly charts in September – the DX has advanced by over 9 percent and broken through previous resistance areas from 107.50 to 109.00. Currently, the Dollar Index price is sitting right around the 109.40 level with the weekly RSI signaling a slightly overbought level of 70.10.


Currencies Net Speculators Leaderboard

Legend: Weekly Speculators Change | Speculators Current Net Position | Speculators Strength Score compared to last 3-Years (0-100 range)


Strength Scores led by Bitcoin & Japanese Yen

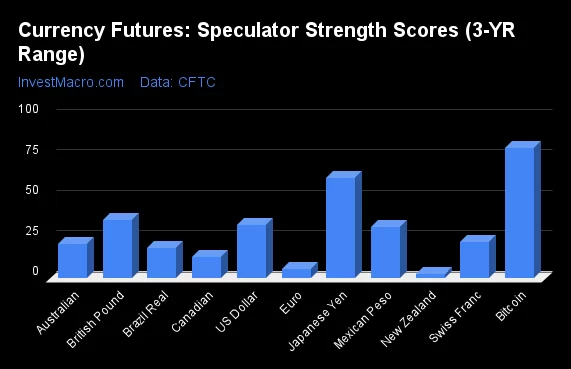
COT Strength Scores (a normalized measure of Speculator positions over a 3-Year range, from 0 to 100 where above 80 is Extreme-Bullish and below 20 is Extreme-Bearish) showed that the Bitcoin (80 percent) and the Japanese Yen (62 percent) lead the currency markets this week.

On the downside, the New Zealand Dollar (3 percent), the EuroFX (6 percent), the Canadian Dollar (13 percent) and the Brazilian Real (19 percent) come in at the lowest strength levels currently and are in Extreme-Bearish territory (below 20 percent).

3-Year Strength Statistics:
US Dollar Index (33.1 percent) vs US Dollar Index previous week (24.6 percent)
EuroFX (5.8 percent) vs EuroFX previous week (4.4 percent)
British Pound Sterling (36.3 percent) vs British Pound Sterling previous week (42.6 percent)
Japanese Yen (61.9 percent) vs Japanese Yen previous week (65.6 percent)
Swiss Franc (22.5 percent) vs Swiss Franc previous week (24.1 percent)
Canadian Dollar (13.0 percent) vs Canadian Dollar previous week (7.9 percent)
Australian Dollar (21.2 percent) vs Australian Dollar previous week (24.2 percent)
New Zealand Dollar (3.0 percent) vs New Zealand Dollar previous week (0.0 percent)
Mexican Peso (31.8 percent) vs Mexican Peso previous week (35.1 percent)
Brazilian Real (19.0 percent) vs Brazilian Real previous week (20.8 percent)
Bitcoin (80.4 percent) vs Bitcoin previous week (77.3 percent)


Bitcoin & US Dollar Index top the 6-Week Strength Trends

COT Strength Score Trends (or move index, calculates the 6-week changes in strength scores) showed that the Bitcoin (64 percent) and the US Dollar Index (33 percent) lead the past six weeks trends for the currencies.

The Australian Dollar (-70 percent) leads the downside trend scores currently with the New Zealand Dollar (-34 percent), Brazilian Real (-17 percent) and the Japanese Yen (-13 percent) following next with lower trend scores.

3-Year Strength Trends:
US Dollar Index (32.7 percent) vs US Dollar Index previous week (23.7 percent)
EuroFX (-1.1 percent) vs EuroFX previous week (-3.1 percent)
British Pound Sterling (-8.5 percent) vs British Pound Sterling previous week (-3.2 percent)
Japanese Yen (-12.7 percent) vs Japanese Yen previous week (1.0 percent)
Swiss Franc (4.8 percent) vs Swiss Franc previous week (3.6 percent)
Canadian Dollar (-3.5 percent) vs Canadian Dollar previous week (-11.0 percent)
Australian Dollar (-70.3 percent) vs Australian Dollar previous week (-74.6 percent)
New Zealand Dollar (-33.7 percent) vs New Zealand Dollar previous week (-35.4 percent)
Mexican Peso (0.9 percent) vs Mexican Peso previous week (4.6 percent)
Brazilian Real (-16.6 percent) vs Brazilian Real previous week (-24.1 percent)
Bitcoin (63.9 percent) vs Bitcoin previous week (52.1 percent)


Individual COT Forex Markets:

US Dollar Index Futures:

US Dollar Index Forex Futures COT ChartThe US Dollar Index large speculator standing this week resulted in a net position of 12,729 contracts in the data reported through Tuesday. This was a weekly lift of 4,084 contracts from the previous week which had a total of 8,645 net contracts.

This week’s current strength score (the trader positioning range over the past three years, measured from 0 to 100) shows the speculators are currently Bearish with a score of 33.1 percent. The commercials are Bullish with a score of 65.9 percent and the small traders (not shown in chart) are Bearish with a score of 39.7 percent.

Price Trend-Following Model: Uptrend

Our weekly trend-following model classifies the current market price position as: Uptrend.

US DOLLAR INDEX StatisticsSPECULATORSCOMMERCIALSSMALL TRADERS
– Percent of Open Interest Longs:64.524.08.8
– Percent of Open Interest Shorts:36.755.25.4
– Net Position:12,729-14,2881,559
– Gross Longs:29,51210,9784,033
– Gross Shorts:16,78325,2662,474
– Long to Short Ratio:1.8 to 10.4 to 11.6 to 1
NET POSITION TREND:
– Strength Index Score (3 Year Range Pct):33.165.939.7
– Strength Index Reading (3 Year Range):BearishBullishBearish
NET POSITION MOVEMENT INDEX:
– 6-Week Change in Strength Index:32.7-31.73.2


Euro Currency Futures:

Euro Currency Futures COT ChartThe Euro Currency large speculator standing this week resulted in a net position of -60,397 contracts in the data reported through Tuesday. This was a weekly advance of 3,727 contracts from the previous week which had a total of -64,124 net contracts.

This week’s current strength score (the trader positioning range over the past three years, measured from 0 to 100) shows the speculators are currently Bearish-Extreme with a score of 5.8 percent. The commercials are Bullish-Extreme with a score of 97.7 percent and the small traders (not shown in chart) are Bearish-Extreme with a score of 0.0 percent.

Price Trend-Following Model: Downtrend

Our weekly trend-following model classifies the current market price position as: Downtrend.

EURO Currency StatisticsSPECULATORSCOMMERCIALSSMALL TRADERS
– Percent of Open Interest Longs:26.956.412.0
– Percent of Open Interest Shorts:36.948.410.0
– Net Position:-60,39748,33712,060
– Gross Longs:162,760341,02572,682
– Gross Shorts:223,157292,68860,622
– Long to Short Ratio:0.7 to 11.2 to 11.2 to 1
NET POSITION TREND:
– Strength Index Score (3 Year Range Pct):5.897.70.0
– Strength Index Reading (3 Year Range):Bearish-ExtremeBullish-ExtremeBearish-Extreme
NET POSITION MOVEMENT INDEX:
– 6-Week Change in Strength Index:-1.14.7-24.4


British Pound Sterling Futures:

British Pound Sterling Futures COT ChartThe British Pound Sterling large speculator standing this week resulted in a net position of 438 contracts in the data reported through Tuesday. This was a weekly reduction of -14,068 contracts from the previous week which had a total of 14,506 net contracts.

This week’s current strength score (the trader positioning range over the past three years, measured from 0 to 100) shows the speculators are currently Bearish with a score of 36.3 percent. The commercials are Bullish with a score of 67.3 percent and the small traders (not shown in chart) are Bearish with a score of 29.8 percent.

Price Trend-Following Model: Strong Downtrend

Our weekly trend-following model classifies the current market price position as: Strong Downtrend.

BRITISH POUND StatisticsSPECULATORSCOMMERCIALSSMALL TRADERS
– Percent of Open Interest Longs:40.147.010.9
– Percent of Open Interest Shorts:39.939.518.5
– Net Position:43814,985-15,423
– Gross Longs:80,55794,31321,817
– Gross Shorts:80,11979,32837,240
– Long to Short Ratio:1.0 to 11.2 to 10.6 to 1
NET POSITION TREND:
– Strength Index Score (3 Year Range Pct):36.367.329.8
– Strength Index Reading (3 Year Range):BearishBullishBearish
NET POSITION MOVEMENT INDEX:
– 6-Week Change in Strength Index:-8.59.5-10.7


Japanese Yen Futures:

Japanese Yen Forex Futures COT ChartThe Japanese Yen large speculator standing this week resulted in a net position of -29,411 contracts in the data reported through Tuesday. This was a weekly decrease of -9,222 contracts from the previous week which had a total of -20,189 net contracts.

This week’s current strength score (the trader positioning range over the past three years, measured from 0 to 100) shows the speculators are currently Bullish with a score of 61.9 percent. The commercials are Bearish with a score of 39.9 percent and the small traders (not shown in chart) are Bullish with a score of 59.8 percent.

Price Trend-Following Model: Downtrend

Our weekly trend-following model classifies the current market price position as: Downtrend.

JAPANESE YEN StatisticsSPECULATORSCOMMERCIALSSMALL TRADERS
– Percent of Open Interest Longs:40.839.318.0
– Percent of Open Interest Shorts:54.025.518.7
– Net Position:-29,41131,023-1,612
– Gross Longs:91,43488,11340,268
– Gross Shorts:120,84557,09041,880
– Long to Short Ratio:0.8 to 11.5 to 11.0 to 1
NET POSITION TREND:
– Strength Index Score (3 Year Range Pct):61.939.959.8
– Strength Index Reading (3 Year Range):BullishBearishBullish
NET POSITION MOVEMENT INDEX:
– 6-Week Change in Strength Index:-12.711.51.4


Swiss Franc Futures:

Swiss Franc Forex Futures COT ChartThe Swiss Franc large speculator standing this week resulted in a net position of -38,701 contracts in the data reported through Tuesday. This was a weekly decline of -813 contracts from the previous week which had a total of -37,888 net contracts.

This week’s current strength score (the trader positioning range over the past three years, measured from 0 to 100) shows the speculators are currently Bearish with a score of 22.5 percent. The commercials are Bullish-Extreme with a score of 91.3 percent and the small traders (not shown in chart) are Bearish-Extreme with a score of 4.0 percent.

Price Trend-Following Model: Strong Downtrend

Our weekly trend-following model classifies the current market price position as: Strong Downtrend.

SWISS FRANC StatisticsSPECULATORSCOMMERCIALSSMALL TRADERS
– Percent of Open Interest Longs:8.083.77.8
– Percent of Open Interest Shorts:49.223.826.5
– Net Position:-38,70156,343-17,642
– Gross Longs:7,55778,6907,316
– Gross Shorts:46,25822,34724,958
– Long to Short Ratio:0.2 to 13.5 to 10.3 to 1
NET POSITION TREND:
– Strength Index Score (3 Year Range Pct):22.591.34.0
– Strength Index Reading (3 Year Range):BearishBullish-ExtremeBearish-Extreme
NET POSITION MOVEMENT INDEX:
– 6-Week Change in Strength Index:4.84.9-22.8


Canadian Dollar Futures:

Canadian Dollar Forex Futures COT ChartThe Canadian Dollar large speculator standing this week resulted in a net position of -167,153 contracts in the data reported through Tuesday. This was a weekly lift of 11,436 contracts from the previous week which had a total of -178,589 net contracts.

This week’s current strength score (the trader positioning range over the past three years, measured from 0 to 100) shows the speculators are currently Bearish-Extreme with a score of 13.0 percent. The commercials are Bullish-Extreme with a score of 90.8 percent and the small traders (not shown in chart) are Bearish-Extreme with a score of 0.1 percent.

Price Trend-Following Model: Downtrend

Our weekly trend-following model classifies the current market price position as: Downtrend.

CANADIAN DOLLAR StatisticsSPECULATORSCOMMERCIALSSMALL TRADERS
– Percent of Open Interest Longs:6.683.67.9
– Percent of Open Interest Shorts:54.331.811.9
– Net Position:-167,153181,481-14,328
– Gross Longs:23,031292,95727,533
– Gross Shorts:190,184111,47641,861
– Long to Short Ratio:0.1 to 12.6 to 10.7 to 1
NET POSITION TREND:
– Strength Index Score (3 Year Range Pct):13.090.80.1
– Strength Index Reading (3 Year Range):Bearish-ExtremeBullish-ExtremeBearish-Extreme
NET POSITION MOVEMENT INDEX:
– 6-Week Change in Strength Index:-3.56.6-21.6


Australian Dollar Futures:

Australian Dollar Forex Futures COT ChartThe Australian Dollar large speculator standing this week resulted in a net position of -77,631 contracts in the data reported through Tuesday. This was a weekly decline of -4,198 contracts from the previous week which had a total of -73,433 net contracts.

This week’s current strength score (the trader positioning range over the past three years, measured from 0 to 100) shows the speculators are currently Bearish with a score of 21.2 percent. The commercials are Bullish-Extreme with a score of 82.0 percent and the small traders (not shown in chart) are Bearish with a score of 23.6 percent.

Price Trend-Following Model: Downtrend

Our weekly trend-following model classifies the current market price position as: Downtrend.

AUSTRALIAN DOLLAR StatisticsSPECULATORSCOMMERCIALSSMALL TRADERS
– Percent of Open Interest Longs:13.669.912.1
– Percent of Open Interest Shorts:54.024.417.2
– Net Position:-77,63187,297-9,666
– Gross Longs:26,135134,23923,314
– Gross Shorts:103,76646,94232,980
– Long to Short Ratio:0.3 to 12.9 to 10.7 to 1
NET POSITION TREND:
– Strength Index Score (3 Year Range Pct):21.282.023.6
– Strength Index Reading (3 Year Range):BearishBullish-ExtremeBearish
NET POSITION MOVEMENT INDEX:
– 6-Week Change in Strength Index:-70.365.3-27.8


New Zealand Dollar Futures:

New Zealand Dollar Forex Futures COT ChartThe New Zealand Dollar large speculator standing this week resulted in a net position of -52,089 contracts in the data reported through Tuesday. This was a weekly advance of 2,535 contracts from the previous week which had a total of -54,624 net contracts.

This week’s current strength score (the trader positioning range over the past three years, measured from 0 to 100) shows the speculators are currently Bearish-Extreme with a score of 3.0 percent. The commercials are Bullish-Extreme with a score of 97.2 percent and the small traders (not shown in chart) are Bearish with a score of 20.9 percent.

Price Trend-Following Model: Downtrend

Our weekly trend-following model classifies the current market price position as: Downtrend.

NEW ZEALAND DOLLAR StatisticsSPECULATORSCOMMERCIALSSMALL TRADERS
– Percent of Open Interest Longs:11.983.83.9
– Percent of Open Interest Shorts:68.424.46.7
– Net Position:-52,08954,644-2,555
– Gross Longs:10,92177,1443,632
– Gross Shorts:63,01022,5006,187
– Long to Short Ratio:0.2 to 13.4 to 10.6 to 1
NET POSITION TREND:
– Strength Index Score (3 Year Range Pct):3.097.220.9
– Strength Index Reading (3 Year Range):Bearish-ExtremeBullish-ExtremeBearish
NET POSITION MOVEMENT INDEX:
– 6-Week Change in Strength Index:-33.733.1-1.7


Mexican Peso Futures:

Mexican Peso Futures COT ChartThe Mexican Peso large speculator standing this week resulted in a net position of 5,997 contracts in the data reported through Tuesday. This was a weekly reduction of -6,394 contracts from the previous week which had a total of 12,391 net contracts.

This week’s current strength score (the trader positioning range over the past three years, measured from 0 to 100) shows the speculators are currently Bearish with a score of 31.8 percent. The commercials are Bullish with a score of 72.3 percent and the small traders (not shown in chart) are Bearish-Extreme with a score of 10.3 percent.

Price Trend-Following Model: Strong Downtrend

Our weekly trend-following model classifies the current market price position as: Strong Downtrend.

MEXICAN PESO StatisticsSPECULATORSCOMMERCIALSSMALL TRADERS
– Percent of Open Interest Longs:40.054.52.7
– Percent of Open Interest Shorts:35.857.14.2
– Net Position:5,997-3,765-2,232
– Gross Longs:57,18877,8423,823
– Gross Shorts:51,19181,6076,055
– Long to Short Ratio:1.1 to 11.0 to 10.6 to 1
NET POSITION TREND:
– Strength Index Score (3 Year Range Pct):31.872.310.3
– Strength Index Reading (3 Year Range):BearishBullishBearish-Extreme
NET POSITION MOVEMENT INDEX:
– 6-Week Change in Strength Index:0.9-1.00.6


Brazilian Real Futures:

Brazil Real Futures COT ChartThe Brazilian Real large speculator standing this week resulted in a net position of -34,874 contracts in the data reported through Tuesday. This was a weekly reduction of -1,897 contracts from the previous week which had a total of -32,977 net contracts.

This week’s current strength score (the trader positioning range over the past three years, measured from 0 to 100) shows the speculators are currently Bearish-Extreme with a score of 19.0 percent. The commercials are Bullish-Extreme with a score of 83.0 percent and the small traders (not shown in chart) are Bearish-Extreme with a score of 14.1 percent.

Price Trend-Following Model: Downtrend

Our weekly trend-following model classifies the current market price position as: Downtrend.

BRAZIL REAL StatisticsSPECULATORSCOMMERCIALSSMALL TRADERS
– Percent of Open Interest Longs:26.168.02.8
– Percent of Open Interest Shorts:71.820.74.3
– Net Position:-34,87436,067-1,193
– Gross Longs:19,95151,8992,111
– Gross Shorts:54,82515,8323,304
– Long to Short Ratio:0.4 to 13.3 to 10.6 to 1
NET POSITION TREND:
– Strength Index Score (3 Year Range Pct):19.083.014.1
– Strength Index Reading (3 Year Range):Bearish-ExtremeBullish-ExtremeBearish-Extreme
NET POSITION MOVEMENT INDEX:
– 6-Week Change in Strength Index:-16.616.30.2


Bitcoin Futures:

Bitcoin Crypto Futures COT ChartThe Bitcoin large speculator standing this week resulted in a net position of 1,335 contracts in the data reported through Tuesday. This was a weekly gain of 145 contracts from the previous week which had a total of 1,190 net contracts.

This week’s current strength score (the trader positioning range over the past three years, measured from 0 to 100) shows the speculators are currently Bullish-Extreme with a score of 80.4 percent. The commercials are Bearish with a score of 25.5 percent and the small traders (not shown in chart) are Bearish with a score of 24.0 percent.

Price Trend-Following Model: Uptrend

Our weekly trend-following model classifies the current market price position as: Uptrend.

BITCOIN StatisticsSPECULATORSCOMMERCIALSSMALL TRADERS
– Percent of Open Interest Longs:81.73.73.7
– Percent of Open Interest Shorts:77.98.03.2
– Net Position:1,335-1,520185
– Gross Longs:28,9661,3301,304
– Gross Shorts:27,6312,8501,119
– Long to Short Ratio:1.0 to 10.5 to 11.2 to 1
NET POSITION TREND:
– Strength Index Score (3 Year Range Pct):80.425.524.0
– Strength Index Reading (3 Year Range):Bullish-ExtremeBearishBearish
NET POSITION MOVEMENT INDEX:
– 6-Week Change in Strength Index:63.9-63.9-27.4


Article By InvestMacroReceive our weekly COT Newsletter

*COT Report: The COT data, released weekly to the public each Friday, is updated through the most recent Tuesday (data is 3 days old) and shows a quick view of how large speculators or non-commercials (for-profit traders) were positioned in the futures markets.

The CFTC categorizes trader positions according to commercial hedgers (traders who use futures contracts for hedging as part of the business), non-commercials (large traders who speculate to realize trading profits) and nonreportable traders (usually small traders/speculators) as well as their open interest (contracts open in the market at time of reporting). See CFTC criteria here.

Speculator Extremes: Live Cattle, Coffee, NZD & Euro lead Bullish & Bearish Positions

By InvestMacro

The latest update for the weekly Commitment of Traders (COT) report was released by the Commodity Futures Trading Commission (CFTC) on Friday for data ending on January 14th.

This weekly Extreme Positions report highlights the Most Bullish and Most Bearish Positions for the speculator category. Extreme positioning in these markets can foreshadow strong moves in the underlying market.

To signify an extreme position, we use the Strength Index (also known as the COT Index) of each instrument, a common method of measuring COT data. The Strength Index is simply a comparison of current trader positions against the range of positions over the previous 3 years. We use over 80 percent as extremely bullish and under 20 percent as extremely bearish. (Compare Strength Index scores across all markets in the data table or cot leaders table)


Here Are This Week’s Most Bullish Speculator Positions:

Live Cattle


The Live Cattle speculator position comes in as the most bullish extreme standing this week. The Live Cattle speculator level is currently at a 100.0 percent score of its 3-year range.

The six-week trend for the percent strength score totaled 25.3 this week. The overall net speculator position was a total of 123,285 net contracts this week with a gain of 4,740 contract in the weekly speculator bets.


Speculators or Non-Commercials Notes:

Speculators, classified as non-commercial traders by the CFTC, are made up of large commodity funds, hedge funds and other significant for-profit participants. The Specs are generally regarded as trend-followers in their behavior towards price action – net speculator bets and prices tend to go in the same directions. These traders often look to buy when prices are rising and sell when prices are falling. To illustrate this point, many times speculator contracts can be found at their most extremes (bullish or bearish) when prices are also close to their highest or lowest levels.

These extreme levels can be dangerous for the large speculators as the trade is most crowded, there is less trading ammunition still sitting on the sidelines to push the trend further and prices have moved a significant distance. When the trend becomes exhausted, some speculators take profits while others look to also exit positions when prices fail to continue in the same direction. This process usually plays out over many months to years and can ultimately create a reverse effect where prices start to fall and speculators start a process of selling when prices are falling.


Coffee


The Coffee speculator position comes next in the extreme standings this week. The Coffee speculator level is now at a 96.7 percent score of its 3-year range.

The six-week trend for the percent strength score was 5.8 this week. The speculator position registered 72,642 net contracts this week with a weekly rise by 8,508 contracts in speculator bets.
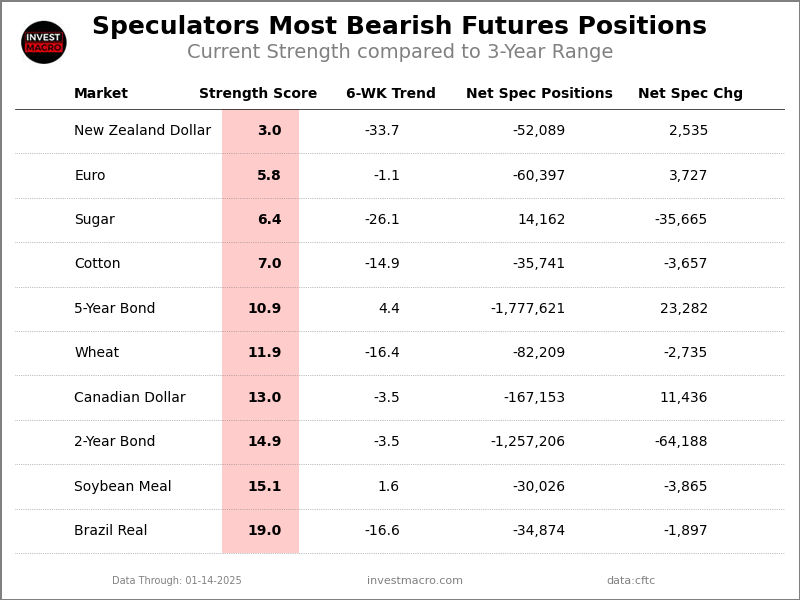

Steel


The Steel speculator position comes in third this week in the extreme standings. The Steel speculator level resides at a 88.0 percent score of its 3-year range.

The six-week trend for the speculator strength score came in at -0.7 this week. The overall speculator position was -2,183 net contracts this week with an edge higher by 414 contracts in the weekly speculator bets.
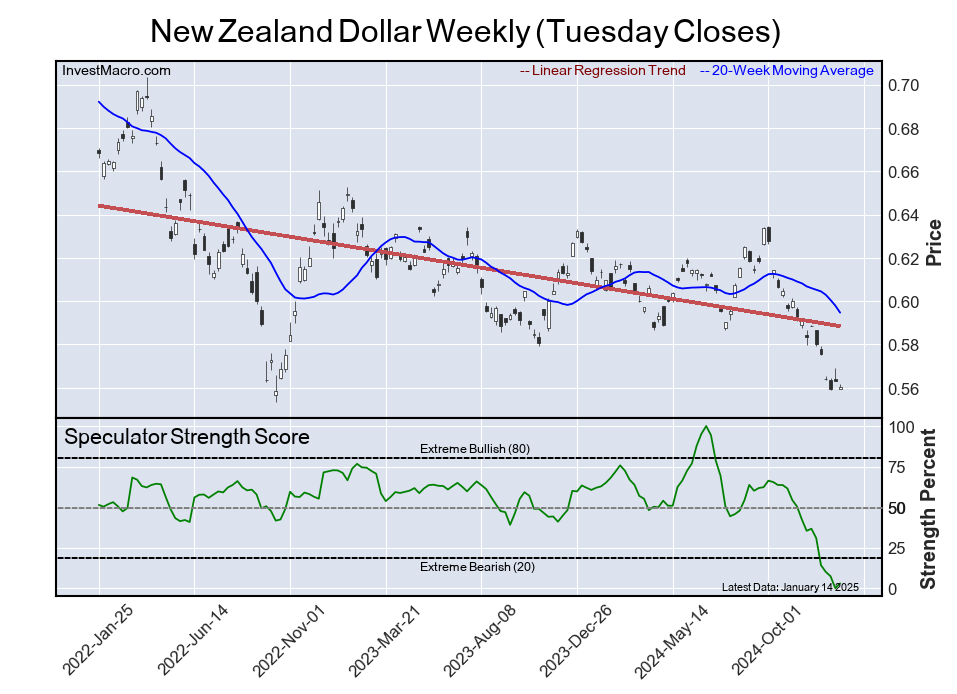

Lean Hogs


The Lean Hogs speculator position comes up number four in the extreme standings this week. The Lean Hogs speculator level is at a 87.0 percent score of its 3-year range.

The six-week trend for the speculator strength score totaled a change of -11.7 this week. The overall speculator position was 76,542 net contracts this week with an increase by 3,797 contracts in the speculator bets.
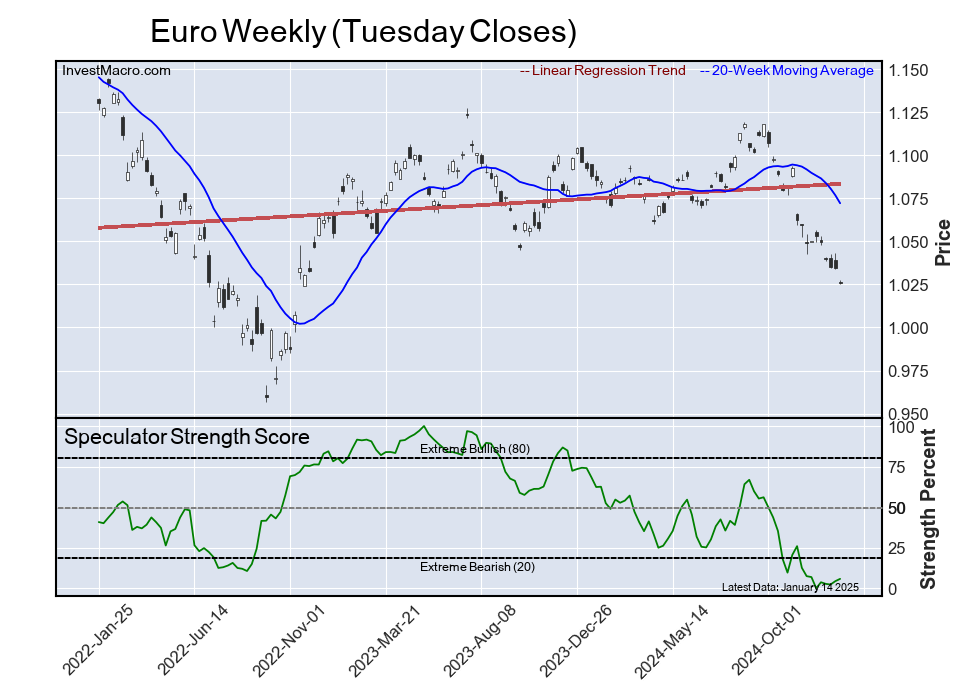

Gold


The Gold speculator position rounds out the top five in this week’s bullish extreme standings. The Gold speculator level sits at a 86.3 percent score of its 3-year range. The six-week trend for the speculator strength score was 7.5 this week.

The speculator position was 279,363 net contracts this week with a rise of 24,452 contracts in the weekly speculator bets.
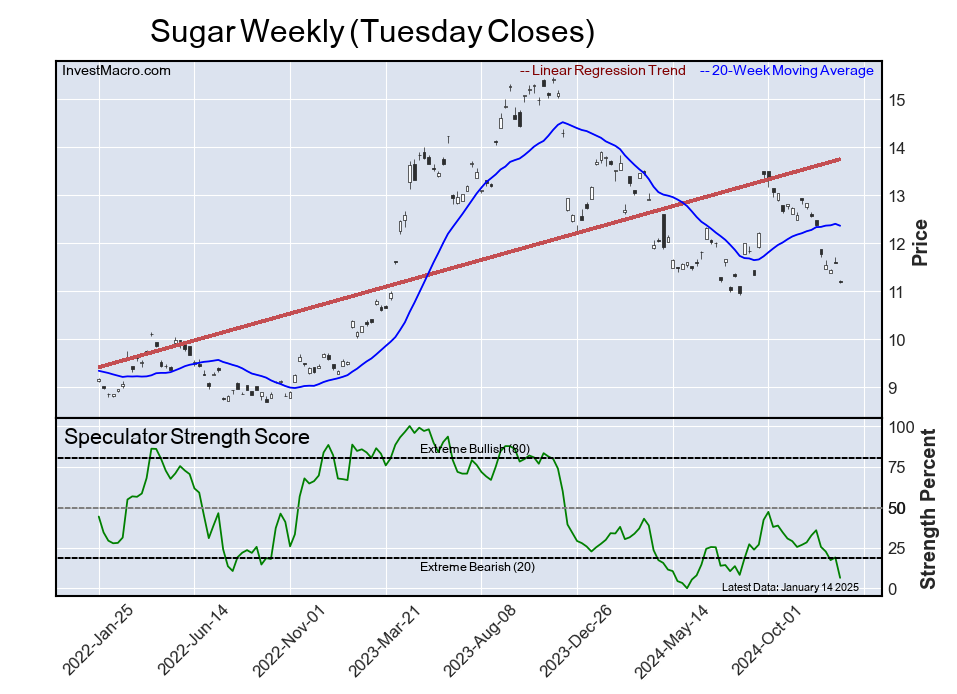


This Week’s Most Bearish Speculator Positions:

New Zealand Dollar


The New Zealand Dollar speculator position comes in as the most bearish extreme standing this week. The New Zealand Dollar speculator level is at a 3.0 percent score of its 3-year range.

The six-week trend for the speculator strength score was -33.7 this week. The overall speculator position was -52,089 net contracts this week with an increase of 2,535 contracts in the speculator bets.


Euro


The Euro speculator position comes in next for the most bearish extreme standing on the week. The Euro speculator level is at a 5.8 percent score of its 3-year range.

The six-week trend for the speculator strength score was -1.1 this week. The speculator position was -60,397 net contracts this week with a move up by 3,727 contracts in the weekly speculator bets.


Sugar


The Sugar speculator position comes in as third most bearish extreme standing of the week. The Sugar speculator level resides at a 6.4 percent score of its 3-year range.

The six-week trend for the speculator strength score was -26.1 this week. The overall speculator position was 14,162 net contracts this week with a drop of -35,665 contracts in the speculator bets.


Cotton


The Cotton speculator position comes in as this week’s fourth most bearish extreme standing. The Cotton speculator level is at a 7.0 percent score of its 3-year range.

The six-week trend for the speculator strength score was -14.9 this week. The speculator position was -35,741 net contracts this week with a decline by -3,657 contracts in the weekly speculator bets.


5-Year Bond


Finally, the 5-Year Bond speculator position comes in as the fifth most bearish extreme standing for this week. The 5-Year Bond speculator level is at a 10.9 percent score of its 3-year range.

The six-week trend for the speculator strength score was 4.4 this week. The speculator position was -1,777,621 net contracts this week with a boost of 23,282 contracts in the weekly speculator bets.


Article By InvestMacroReceive our weekly COT Newsletter

*COT Report: The COT data, released weekly to the public each Friday, is updated through the most recent Tuesday (data is 3 days old) and shows a quick view of how large speculators or non-commercials (for-profit traders) were positioned in the futures markets.

The CFTC categorizes trader positions according to commercial hedgers (traders who use futures contracts for hedging as part of the business), non-commercials (large traders who speculate to realize trading profits) and nonreportable traders (usually small traders/speculators) as well as their open interest (contracts open in the market at time of reporting). See CFTC criteria here.