
By RoboForex Analytical Department
Gold stabilised around 2,940 USD per troy ounce on Tuesday, remaining close to record highs. The metal continues to benefit from strong demand for safe-haven assets amid growing concerns over US President Donald Trump’s tariff policies.
Key factors driving Gold prices
On Monday, Trump confirmed that tariffs on Canadian and Mexican imports will proceed as planned. This triggered fresh market concerns over inflation risks, which could influence the Federal Reserve’s future monetary policy.
In addition to geopolitical tensions, Gold is receiving support from the SPDR Gold Trust, the world’s largest gold-backed exchange-traded fund. The fund reported increased assets to 904.38, marking the highest level since August 2023.
Investors focus now shifts to Friday’s Personal Consumption Expenditures (PCE) report, the Fed’s preferred inflation gauge. The data is expected to show the slowest price growth since June 2024. However, persistent inflationary pressures may keep the Fed cautious about cutting interest rates too soon.
Free Reports:
 Download Our Metatrader 4 Indicators – Put Our Free MetaTrader 4 Custom Indicators on your charts when you join our Weekly Newsletter
 Get our Weekly Commitment of Traders Reports - See where the biggest traders (Hedge Funds and Commercial Hedgers) are positioned in the futures markets on a weekly basis.
Technical analysis of XAU/USD
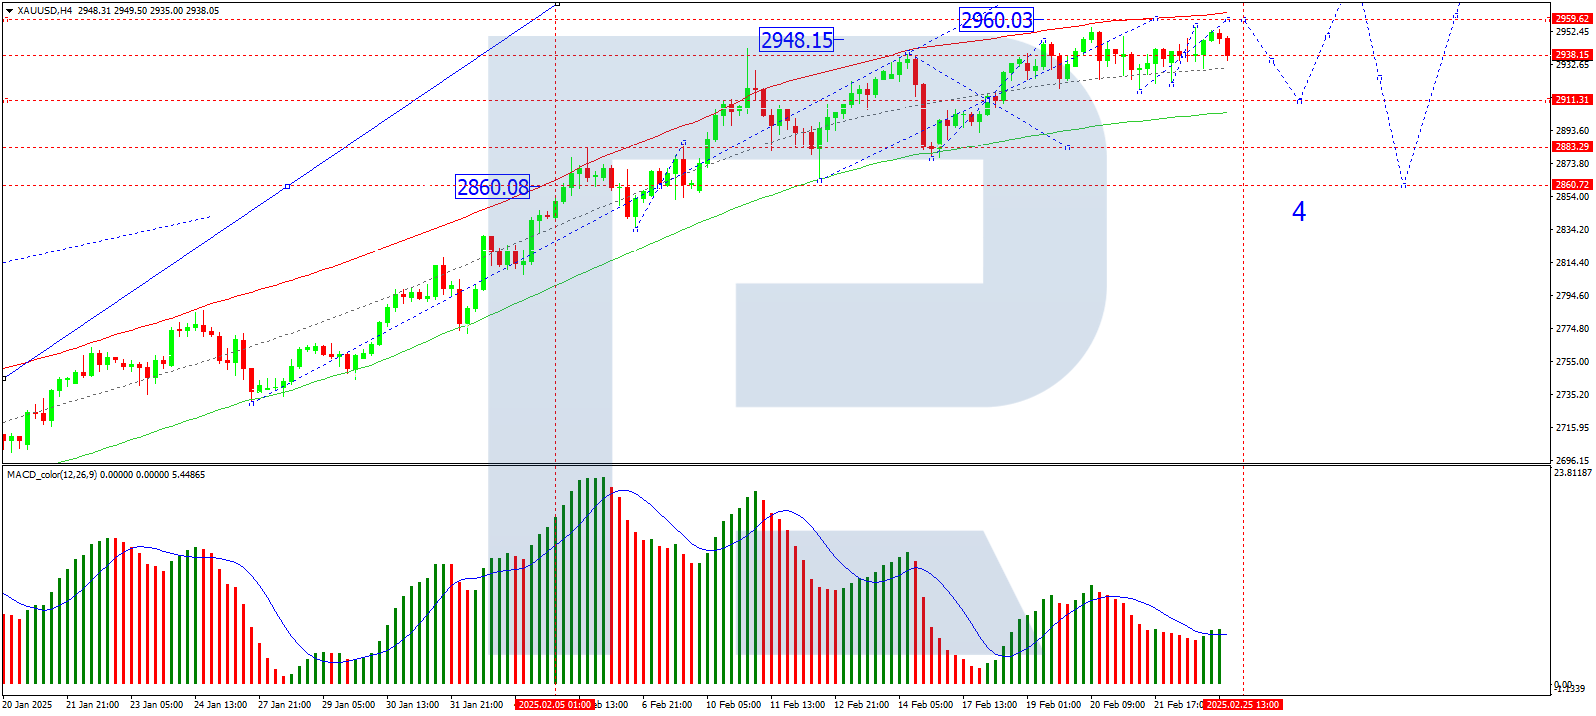
On the H4 chart, XAU/USD is consolidating around 2,938. A potential downward move towards 2,911 (a test from above) is likely before a renewed growth wave targets 2,960 as a local high. Once this level is reached, a corrective decline towards 2,860 could begin. The MACD indicator confirms this outlook, with its signal line above the zero level and pointing decisively upwards.
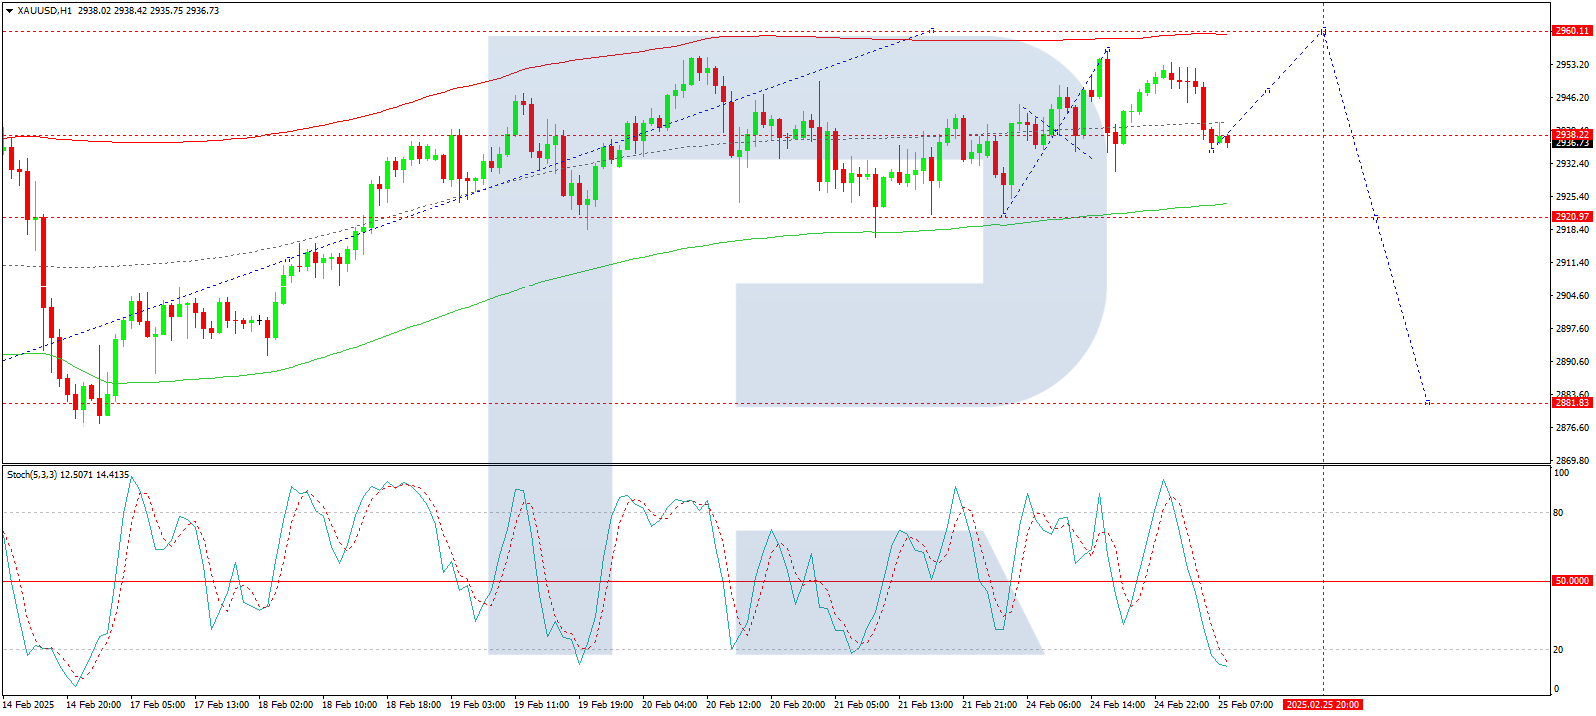
On the H1 chart, Gold recently formed a growth wave to 2,956 before correcting back to 2,938. A consolidation range is expected to develop around this level. If the price breaks downwards, a move towards 2,920 could occur before another upward impulse targets 2,960. The Stochastic oscillator supports this scenario, with its signal line below 20, indicating an imminent rise towards 80.
Conclusion
Gold remains in a strong uptrend, supported by safe-haven demand, geopolitical uncertainties, and increased holdings in gold-backed ETFs. Technical indicators suggest a potential short-term dip before another move higher towards 2,960. However, investors should watch upcoming inflation data, which could influence the Fed’s rate outlook and Gold’s trajectory.
Disclaimer
Any forecasts contained herein are based on the author’s particular opinion. This analysis may not be treated as trading advice. RoboForex bears no responsibility for trading results based on trading recommendations and reviews contained herein.

- Australian trade balance returned to positive territory Aug 6, 2026
- Results in Line for Most Reporting Companies Aug 5, 2026
- Stock indices continue to break records. Oil is falling amid intensified diplomatic dialogue between the US and Iran Aug 5, 2026
- USD/JPY Holds Steady After Intervention: Outlook Remains Uncertain Aug 5, 2026
- EUR/USD: Busy Week Ahead Aug 3, 2026
- Positive sentiment in the AI sector supported stock indices. Oil prices remain volatile Aug 3, 2026
- The Tech‑heavy NASDAQ Index jumped by more than 3.3%. The offshore yuan is trading at its highest level since 2023 Jul 31, 2026
- USD/JPY After Volatility: Multiple Events in One Day Jul 31, 2026
- The US indices sell off amid renewed US-Iran clashes. Oil jumps by 7% Jul 30, 2026
- USD/JPY Temporary in Equilibrium: Multiple Factors in Focus Jul 30, 2026
