Source: Michael Ballanger (1/11/23)
Michael Ballanger of GGM Advisory Inc. reviews the current state of U.S debt, the value of the dollar, the resource sector, and more to tell you where he believes the market is heading in 2023.
As I sat down in mid-December to write the GGMA 2023 Forecast Issue, I was mindful of the one I published in January 2020, where I laid out my conviction that due to rising debt levels around the globe — and this was PRE-COVID — governments would eventually be forced to reprice the collateral backing their skyrocketing sovereign debt (said collateral being gold, of course) sharply higher as a means of shoring up equity.
I surmised that at 10% coverage, the U.S. would need to reprice gold to ~ US$15,700 per ounce because if they wished to achieve a 1:1 ratio of national debt to their 8,311 metric tonnes of gold (allegedly on the books), they would need gold at over US$157,000 per ounce. Again, that was pre-Covid.
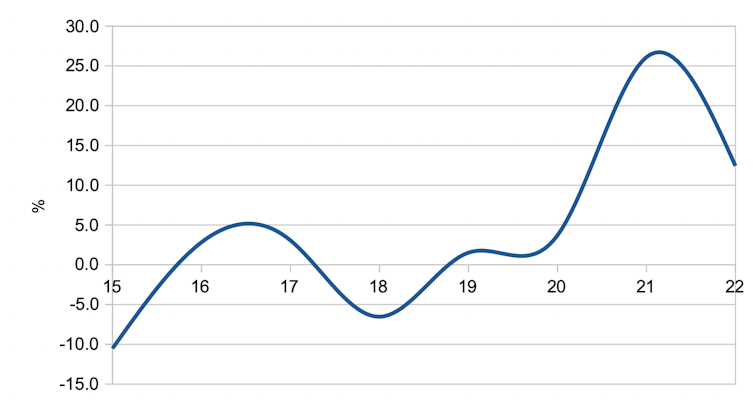
Since the beginning of the Great Bull Market, there has been a direct correlation between stock prices and the Federal Reserve Board’s balance sheet.
Of all the gold forecasters and podcasters and self-professed gurus, there was nobody mentioning it as a final solution to the debt bomb that is about to go off in 2023.
The closest is Luke Gromen, a brilliant macro analyst from the U.S. Midwest that believes that a gold-for-oil payment system is soon to be implemented by the major oil producers and consumers to avoid the penalties that result from massive U.S. dollar debasement that can only get worse in 2023 as economic conditions weaken and tax receipts begin to shrink.
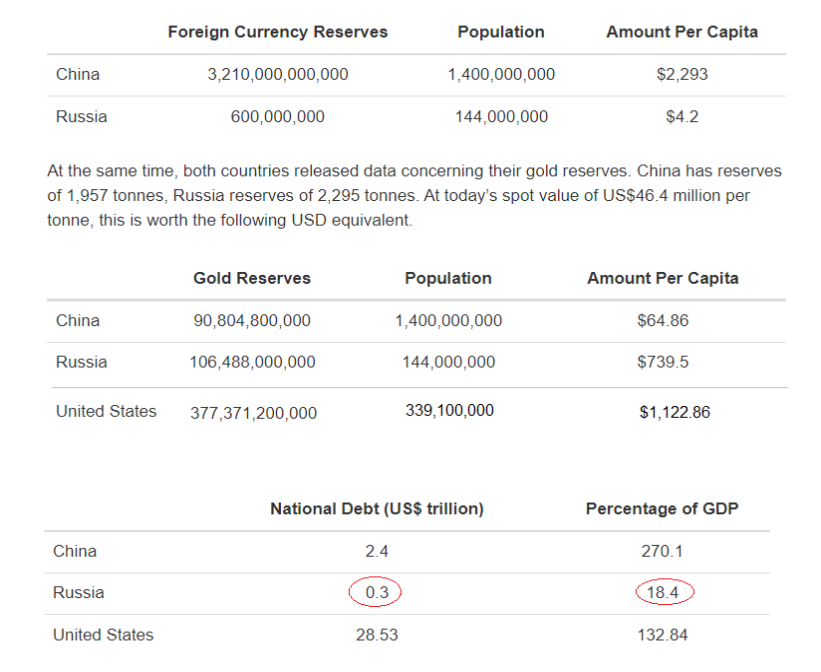
It is no coincidence that those countries that are net oil importers are the same ones adding aggressively to gold holdings led by Germany, China, and Japan, the second, sixth, and eighth largest holders of gold in the world.
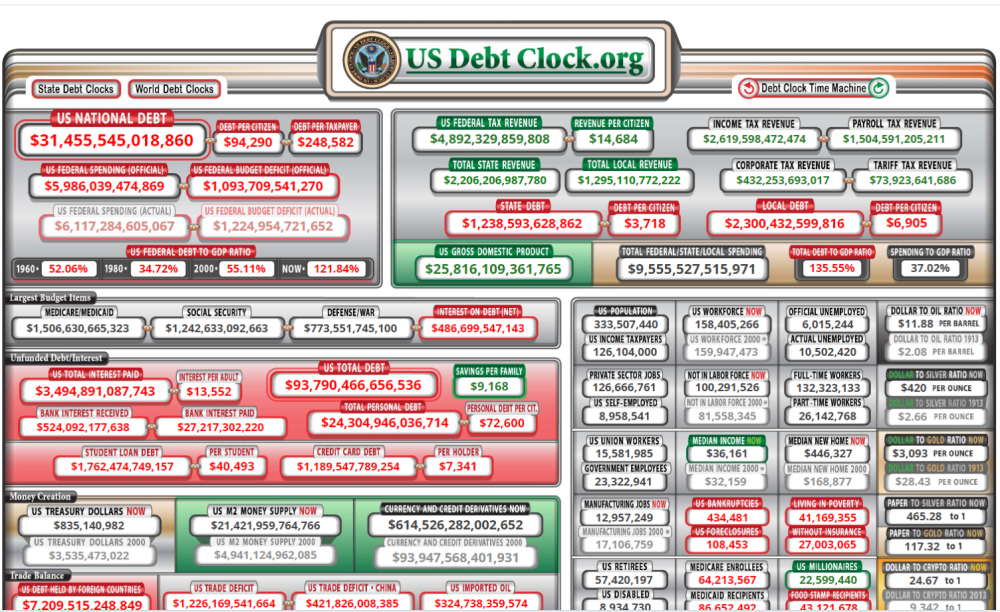
U.S. Debt
Also, in the GGMA 2000 Forecast Issue was the following paragraph:
“As we look out to the next decade — the “Roaring Twenties” of the 21st Century — I try to identify wherein lies the greatest risk to not only global growth but also global STABILITY. The four-letter answer is the same one I used all throughout 2019 — DEBT. Now, unsubordinated debt is risky, but uncollateralized debt is a nightmare, and all around the world, governments have issued some US$17 trillion of negative-yielding debt (as of August 31), and while that figure will be soon revised downward, all of this debt is riding atop the crest of a fiat wave that is about to break upon a rigid reef of reality.
The only point of debate is “when” because there is no basis whatsoever for the question of “if”. Debt to GDP levels around the world are soaring with little sign of abatement, and since the only collateral behind that debt is the “full faith and confidence of government” (to tax its citizens and repay the debt), I submit that investors around the world are going to demand security before they shell out hard-earned savings, and if you step past tax receipts, you go to “Crown Land” (Canada) or Federal Lands (U.S.), but since that still evokes incendiary responses from the electorate, the only other collateral left is sovereign holdings of one other form of collateral, and that collateral is none other than gold.
I wrote that paragraph prior to the global economic shutdown that was triggered by a virus that was purported to be the second coming of the bubonic plague, which wiped out an estimated sixty million people (up to 60%) of the European population in the 1400s.
The response to the threat was a simultaneous cessation of global trade accompanied by an airdrop of over US$6 trillion in the U.S. alone in the form of cheques to literally anyone with a pulse and to any business alleged to have workers. The total U.S. national debt is estimated to be in excess of US$32 trillion, so the debt bomb referred to in 2020 has grown by over 20% in less than three years.
Furthermore, it is now at the breaking point with debt serviceability, a major obstacle to the U.S. dollar reserve status and hegemony.
So, how does this affect investment strategy for the year 2023? Well, over the forty-five years that I have waged war against those hideous demons that dominate the capital markets, I have learned through many painful judgemental failures that the greatest danger lies within.
When you are manning a trading terminal, there are only two buttons that count. The first one is a “BUY” button, usually green on the old Quotron terminals, and the second one is a “SELL” button, often sporting a reddish hue. There is no “HOLD” button, and do not attempt to locate the “CANCEL” button because in the trading pits, as in warfare, there is only “ATTACK” or “RETREAT,” although General Patton knew not the meaning of the latter and regaled in the former.
Whenever I am in the “set-up” mode for a big trade, such as the GDX:US in mid-March 2020 (16th to be exact, the exact low for the crash), by the time I sit down at the terminal, I have already processed all of the relevant information pertinent to the trade. Now, when I was a younger man filled with all of the audacity of youth, I would visualize the item I was going to buy with the profits from this “CAN’T MISS” trade, and whether it was a new car or a condo in Florida, there was never the slightest consideration of the likelihood of loss.
This may have stemmed from growing up with aspirations of making the NHL in a sport where hesitancy and uncertainty could result in more than simply losing a game. I saw more than a few promising young men run out of the league due to those character flaws but in the world of trading and investing, they are absolutely invaluable. However, as I was to learn very early in my trading career, successful trading carries none of the prerequisites demanded for success on the hockey rink.
There is a terrific book I read last year that was written in 1989 by Jack D. Schwager, where he interviews a number of famous traders from prior decades. When asked what was the singular most important attribute of a great trader, the recurring theme amongst all of the subjects in the book was the ability to manage risk. Essential to managing risk was the tendency to utilize doubt as a tool in tempering drawdowns, and the two behaviors integral to the process included hesitancy and self-examination (also described as uncertainty).
Since the beginning of the Great Bull Market, which began in 1982 with the Dow Jones Industrials at 785 (and national debt at US$900 billion), there has been a direct correlation between stock prices and the Federal Reserve Board’s balance sheet (debt). Also ingrained in this correlation are tax receipts which are generated by stock market profits, and the financial services industry, which has largely replaced manufacturing as the primary driver for the U.S. economy. Now that the era of globalization has been replaced by a return to “on-shoring,” wide profit margins once enjoyed by multinationals due to cheap labor in Asia and Latin America are going to be no more.
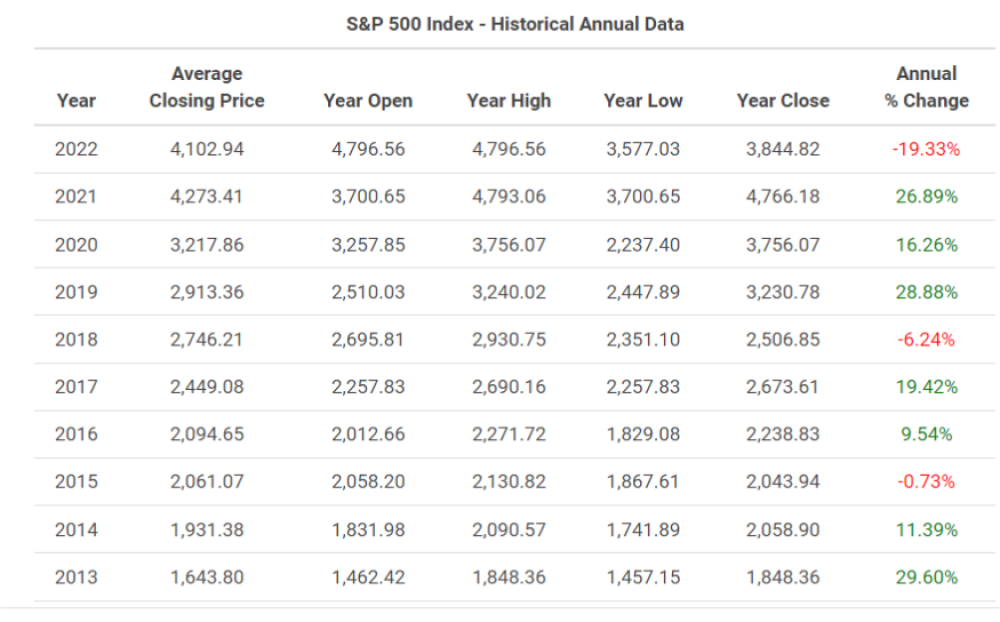
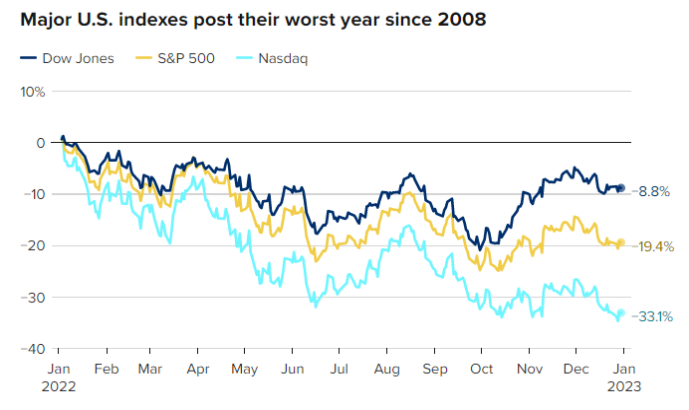
The S&P 500 has posted its third losing year in the past ten, but with the best three being +29.16% (2013), +28.88% (2019), and +26.89% (2021), those up years dwarf the three worst years, which were this year -15.66% (2022), -6.24% (2018), and -0.73% (2015). What gives me pause is that this was the first year in a decade that Federal Reserve monetary policy shifted into full tightening mode.
While its dual mandate is well advertised as “price stability” and “maximum full employment,” a third and somewhat covert mandate is beginning to find its way into the current narrative, and that third mandate is “ensuring that the government is adequately funded.” In being allowed to magically create credit in order to keep the U.S. government afloat, it needs no adherence to General Accepted Accounting Principles or “GAAP” guidelines in order to be compliant.
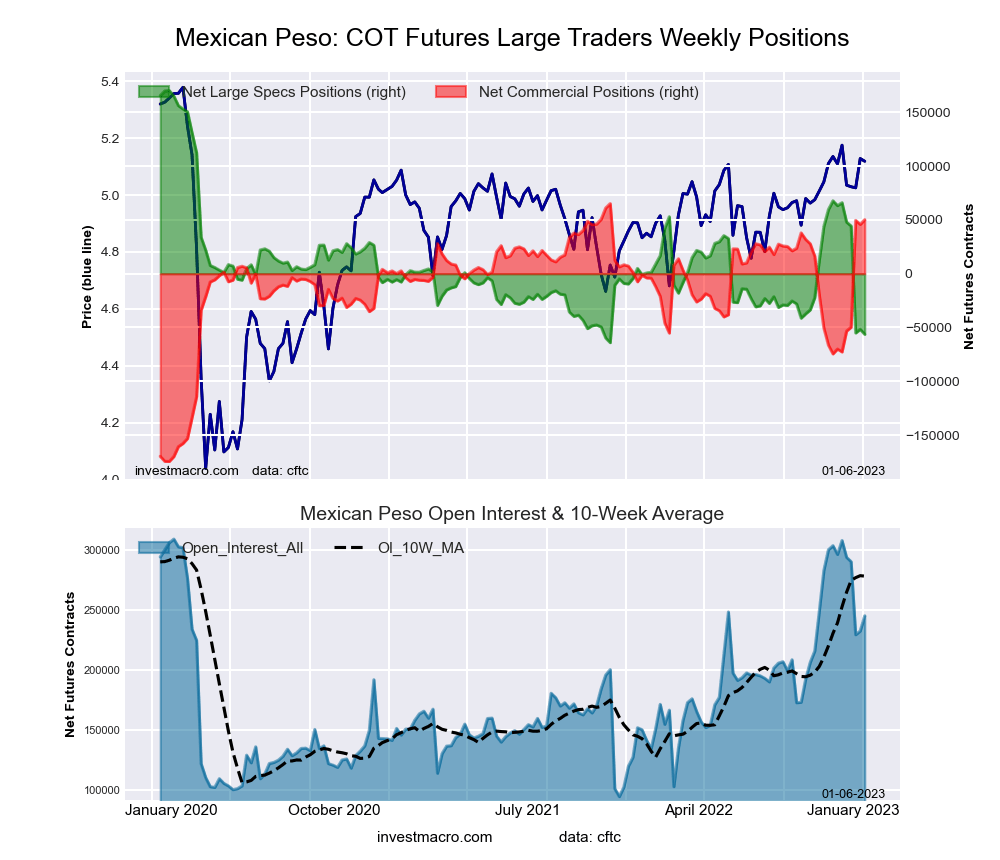
Given that the Saudis have opted in favor of the yuan over dollars as payment-in-kind for their oil, I see a seismic in-process shift now in place as the dollar gets replaced by non-dollar currency reserves, which would include gold.
If U.S. government budgets were constrained by balanced budget controls, it would be insolvent in the blink of an eye. This, I believe, is where the demise of the petrodollar — as in elimination thereof — will put increasing pressure on the “full, faith, and credit” assumptions of sovereign debt levels around the globe, but with the greatest impact those countries that are either “overweight debt” or “short energy.”
While the U.S. is certainly not energy-challenged, it is the world’s largest debtor nation where the purchasing power of its treasury bonds may appear superior to those issued by energy-starved Europe, Japan, and China, 2023 will be the year that the OPEC members decide to accept payment methods for oil and gas in denominations other than U.S. dollars. It could be an SDR or gold or a combination of both, but if this series of events leads to a confrontation concerning the most credit-worthy and default-protected currency in circulation, I see the ultimate measuring stick being central bank gold holdings. If that is the case, then would an OPEC member rather take U.S. dollars or Russian rubles?
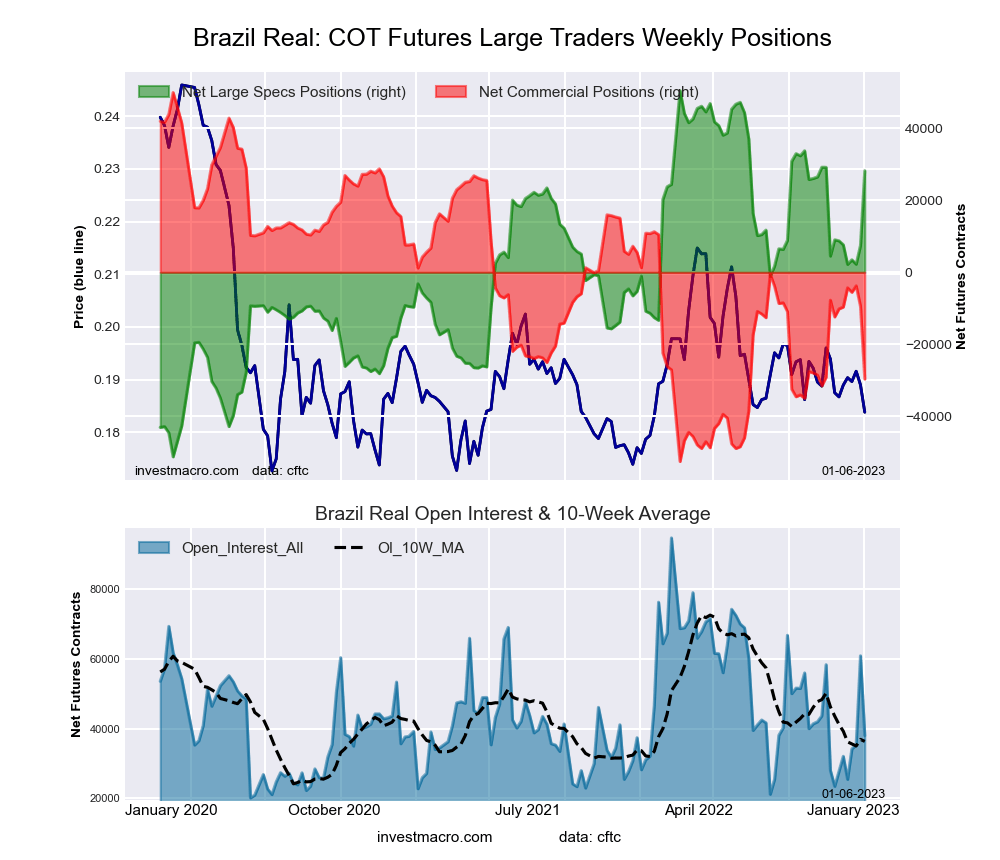
Given that the Saudis have opted in favor of the yuan over dollars as payment-in-kind for their oil, I see a seismic in-process shift now in place as the dollar gets replaced by non-dollar currency reserves, which would include gold. Europe is already paying for Russian oil and gas in rubles, and Brazil appears to be aligning itself within the BRIC bloc of nations all hellbent on removing the shackled encumbrances of U.S. dollar servitude.
In the end, if this gold-for-oil movement is to play out, then it is the non-gold-owning treasuries around the world that will be effectively “short oil” by being “short gold” (meaning owning “no gold” such as Canada). That will set off a buying spree in gold as a means of hedging their energy costs which is effectively the same as arbitrarily re-pricing gold to fortify the value of central bank collateral and, given the American’s 8,311 metric tonnes of gold, this is actually a cloaked benefit to the U.S. dollar’s integrity.
One way or the other, gold seems destined for higher valuations versus North American currencies which will put a punctuative end to this two-and-a-quarter year-long bear market in gold miners and their junior brethren.
Here is a question: If you were an accountant with years of experience dealing with balance sheets and income statements, what would be your advice to the Canadian government today? Or the Eurozone? Or the Fed or U.S. Treasury?
If you were applying the rules of accounting to government management of sovereign finances, what on earth could you possibly say?
When I get a notice from a credit card company, I can either pay the bill or lose the card as well as my credit rating. I am not permitted by law to manufacture either cash or credit or “alternative currency” to satisfy a debt that requires the draining of savings. If stressed, we citizens are required to “get a second job” or “ask a relative,” but we do not have a “phantom sugar daddy” like the U.S. Fed or the ECB, or the BoJ to bail us out of near-term financial difficulties.
2023 is going to be the year that the world decided to abandon mindless obedience to U.S. dollar hegemony.
If we do not have sufficient savings to satisfy obligations taken on in the true honor of commerce, we all lose the privilege and, with it, lifestyle and community standing.
Indeed, what would be the correct words or actions when the tax department demands that one pay a bill now that the government has been able to “inflate away” tomorrow?
The new generations of those children of the elite that are now back living in the basement with the widescreen TV and unlimited Internet access (and Mom’s secret credit card that Dad doesn’t know about) are about to receive a very rude awakening when they step out onto Richmond Street to protest and someone their own age (as opposed to a Babyboomer) tells them to get the **** off the street because they have to get to work.
Markets hate this kind of uncertainty on a near-term basis, but they absolutely love it when the opposing factions from a different regimes finally unite under a common cause.
Volcker told Wall Street that they had “better get short” in late 1979, just as Jerome Powell told Wall Street the same thing late last year. Remember all the “we’ll call his bluff” podcasts from the YouTube crowd in the first six months of 2022? In 1980, the Wall Street crowd actually listened to Paul Volcker, but the retail clients were so few, and far between that they were mere echoes in the price-direction narrative.
Between 1966 and 1982, the Dow Jones Industrial Index vacillated between 785 and 1,024, and by the time we got through the Volcker anti-inflation assault, household ownership of stocks had fallen to under 5% of total equity ownership. The retail impact was not only negligible; it was irrelevant.
In the year 1980, the Japanese citizens had worked so incredibly hard since 1945 that, along with the immense power and impact of The Marshall Plan, Japanese industry along with German industry, had moved to the top of the manufacturing “food chain.” The great diamond marketing company founded by DeBeers called the CSO (“Central Selling Organization”) had completed a marketing survey in Asia, which determined that the only country on the planet rejecting diamonds as a traditional engagement or wedding gift was Japan.
The CSO, located at 17 Charterhouse Street in London at the time, was assigned the task of implementing a marketing campaign with a view to attracting the Japanese to the idea that “Diamonds Are Forever.” In 1980, when the campaign began, no young Japanese males ever used diamonds as a symbol of their commitment; by 1990, ten years later, after a Hiroshima-style bombardment of Japanese media with the campaign, not only were young, newly-rich males buying 5-10 carat diamonds worth tens of thousands of U.S. dollars as engagement rings, the upwardly-mobile and now very-affluent female businesswomen were buying diamonds as investments!
The reason I can relate to this is that I was an early financier in the exploration campaign for Mountain Province Diamonds Inc. (MPVD:TSX), which asked me to help them navigate the world of corporate finance in mid-1995. The company was invited to meet with DeBeers in 1996, shortly after the AK-5037 diamond discovery, during which our stock, all acquired under US$0.50 through various private placements, soared to US$9.75 and enriched a great many of my friends and colleagues, none of whom thought that my US$30 target price was either realistic or achievable.
We all err on the side of unreasonable expectations from time to time, but the reason I mention Mountain Province is that nobody that was associated with the company during the early days is still there. The stock that we were selling in the US$6-9 range has a diamond mine (Gaucho Kwé), of which they own 49%, that earned US$34 million last year, yet the stock is currently quoted at a CA$0.50 bid. I have zero holdings, and every single risk-taker from the 1990s took their money and ran for their life. Lesson learned.
2023 is going to be the year that the world decided to abandon mindless obedience to U.S. dollar hegemony, and ironically, the trigger was in 2022 when the U.S. arbitrarily decided that a suitable “sanction” against Russia would be to confiscate approximately US$300 billion of its foreign exchange reserves held outside of Russia. Countries like Brazil, India, and Saudi Arabia were suddenly forced to take a hard look in the mirror relative to the degree of control they have over their assets. It was a sobering moment when they all collectively realized that with the flick of a computer key, their national property could be stolen with little or no adherence to the rules of international law.
As this de-dollarization trend grows, the COMEX exchange that governs the “paper price” for gold and silver will take on a diminishing role
The BRIC nations have all aligned in a concerted effort to establish an international payments system independent of the SWIFT system, which is a U.S.-controlled mechanism for moving money around the world. The ramifications of defying American foreign policy demands can be felt by any nation using the American system, and while the Saudis have historically relied upon the West for security, recent events have accelerated their distancing from U.S. policy guidelines.
This is all fodder for a cannon aimed directly at the U.S. dollar’s international role as the world’s reserve currency. For gold and silver investors, it is particularly significant as more and more sovereigns opt for non-dollar settlements for crucial commodities like oil and iron ore — and precious metals. As this de-dollarization trend grows, the COMEX exchange that governs the “paper price” for gold and silver will take on a diminishing role such that the shares of north American mining companies begin to respond to the Shanghai gold quote rather than those posted by the COMEX or the London Metals Exchange.
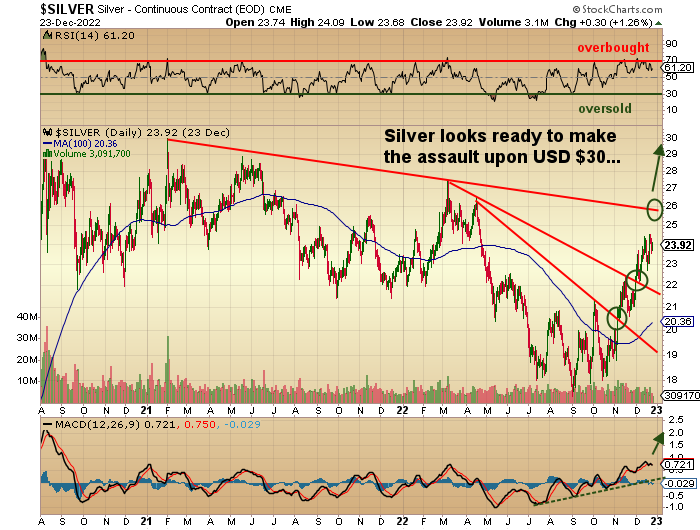
Silver Short-Term Chart
The New Year 2023 brings with it a whole new set of challenges due largely to the uncertainty that remains physical silver closely followed by a basket of junior exploration and development companies that are awaiting the inevitable upturn in the Senior Gold Miners before heading higher themselves. It is well past the time for this group of companies to finally feel the love of the new generations of stock investors that have largely avoided the sector, and to their credit, I might add.
Old, grizzled veterans like me have wallowed in the nostalgia of those great discoveries of the 1980s and 1990s, like Hemlo and Eskay Creek, Ekati and Voisey’s Bay while the youngsters had huge wins in cannabis, crypto, and technology issues from just after the GFC in 2008 until 2022. The Fed-fuelled bull market that acted as a financial aphrodisiac for millions of Millennials and Gen-Exers created a psychological effect known as the “Buy-The-Dip” mentality that was more of a Pavlovian phenomenon born out of the Federal Reserve’s incessant habit of rescuing the stock market through monetary stimulus or well-scripted bullish narratives jawboned through financial media outlets every time there was a 5% correction.
The need to sustain the asymmetrical wealth effect through ever-rising stock prices as the policy was replaced in late 2021 by a newly-crafted focus upon price stability rather than maximum full employment, where galloping stock prices have a subliminal effect upon corporate planners in their hiring and firing habits and intentions.
Silver is a chameleon of sorts, taking on the visage of a monetary metal one moment, then transforming itself into an industrial metal the next and when one least expects it. This would explain the near 1:1 correlation between the price of copper and the price of silver during certain periods when economic conditions are tilted toward global growth or accelerating inflation. During the 1970s, when silver soared from US$1.50 to US$50, only in the latter part of the decade did copper catch a bid during the final spike in U.S. inflation, moving from US$0.60/lb. to US$1.50/lb. in twenty-four months.
Absent the competition from other investible distractions, I believe that fund flows will gravitate to the precious metals with greater attention to silver because of the belief that it is much closer to “green” metals than gold or copper, largely because of its application in the EV and medical fields.
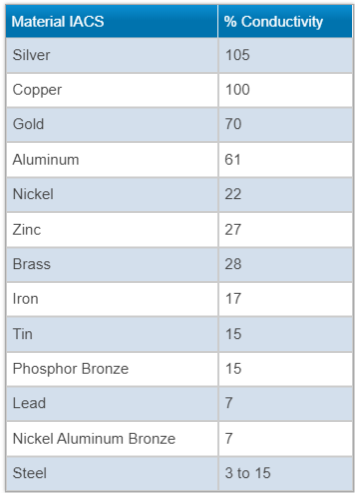
However, observe the chart to the left that lists the percentage conductivity of the various metals.
Silver has greater conductive properties than copper, and both silver, copper, cand gold are ranked well ahead of two more notable battery metals, namely, lead and nickel.
While the sexagenarian community of stock players sees little excitement in the climate-change attributes of gold and silver, the new generations of investors have been educated in a climate-friendly environment where policies related to curricula decisions are heavily tilted toward ecological activism.
This plays quite favorably in the junior exploration space as, in the past few years, I have seen an accelerated interest in battery metals and in copper as a proxy for the electrification movement.
Since youngsters go wild over anything that discourages or replaces the carbon footprint power source, valuations for lithium deposits have been staggeringly large relative to an equally-large deposit of lead or nickel.
Also leaping into the current investment consciousness has been lithium. A major component in the “lithium-ion battery,” lithium allows for the recharging and storing of electrical energy.
Since youngsters go wild over anything that discourages or replaces the carbon footprint power source, valuations for lithium deposits have been staggeringly large relative to an equally-large deposit of lead or nickel.
As enlightenment in the field spreads (and as the table above would prove), silver’s premier rank as an electrical conductor will eventually allow the chameleon to morph into a poster-child “green” metal, attracting millions upon millions of new, well-heeled investors to the party.
This development will allow for the absorption of a great deal of excess supply that is derived from base metals, where silver is mined and stored as a byproduct of copper, lead, and zinc extraction facilities.
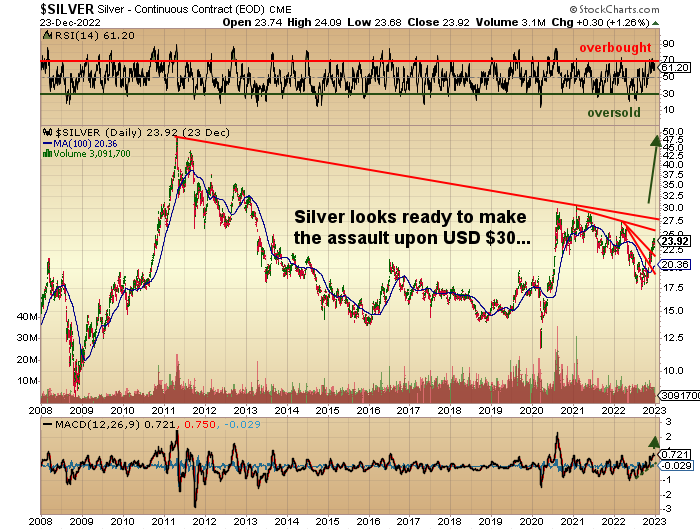
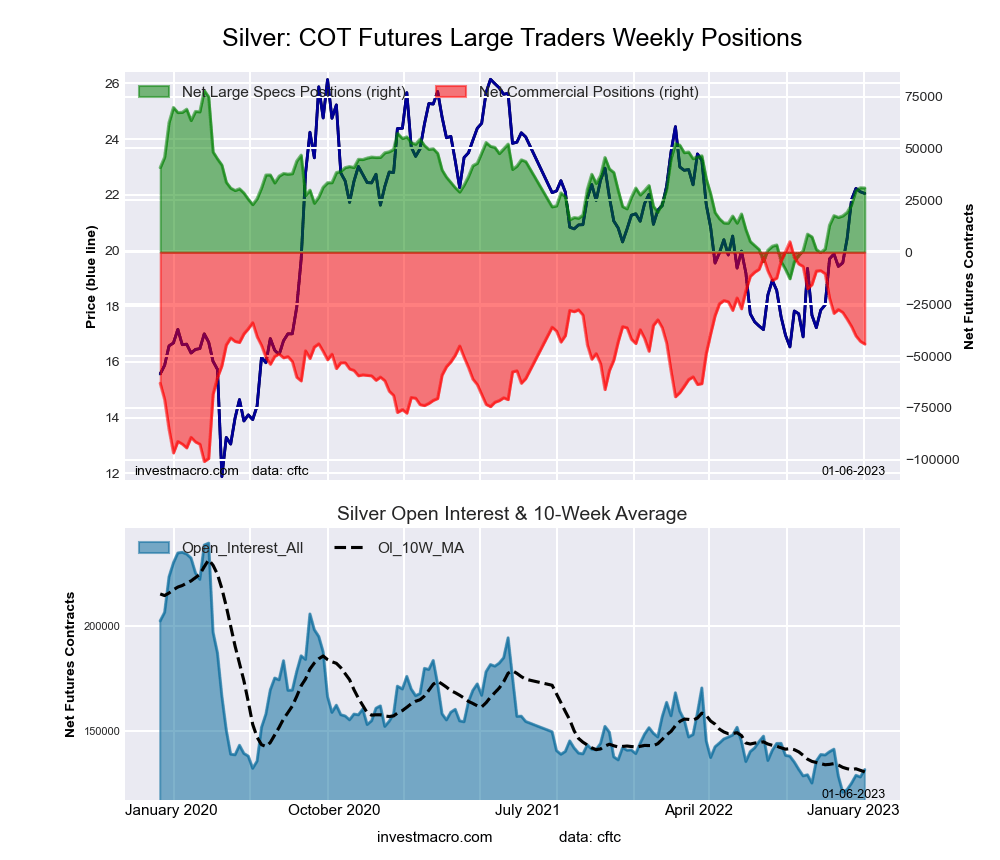
Silver Long-Term Chart
Technically, over the shorter term, silver has reversed the downtrend from the peaks in 2021 and 2020 with two distinct breakouts at US$20.75 and US$22.00 and looks poised for a run to US$25.75-26.00. However, the longer-term chart shown above has major resistance at around US$27.50 to overcome before the big test of the February 2021 “Silver Squeeze” top at US$30.00, which will be formidable.
Silver will need to have a confluence of bullish tailwinds propelling it by the time it tests $30 because it is undoubtedly the most popular shorting candidate of all the metals by the bullion bank behemoths.
We all know painfully well the history of the paper market takedowns that have plagued silver investors for decades. It all began in the late 1970s when the Hunt Brothers from Texas attempted to corner the market through massive purchases of silver futures. The reality is that under exchange rules in place at the time, they actually did corner the market, but with the bullion banks in serious trouble from their short positions, they lobbied the government and the COMEX and got the rules changed such that no further silver could be purchased with the only new orders accepted being “SELL” orders.
As I pointed out in an earlier email alert, famous technical analyst Bob Farrell’s Rule #9 for Investing says: “When all experts and forecasts agree, something else I going to happen.”
A few enormous increases in maintenance margin requirements added to the stress, and within weeks of “Silver Thursday,” the market crashed from US$47 to US$11, costing the Hunts about US$1.7 billion and forcing them into bankruptcy.
Since that time, silver has had a history of wild swings and headline-grabbing controversy, and while it has greatly enhanced the fortunes of traders that get it “right,” there are countless body bags piled on both shoulders of the Road to Riches. For those of us that have ridden the silver bull in more than a few earlier rodeos, it has always been the safest entry point when no one cares and volatility is muted, such as early last September when the Relative Strength Index dipped briefly under 30 with price at US$17.56/ounce. Hovering around the US$24.00 mark, silver has suddenly caught a bid, and if this continues into the New Year, an entirely new wave of newbie buying will take silver higher before you can spell the word “breakout.”
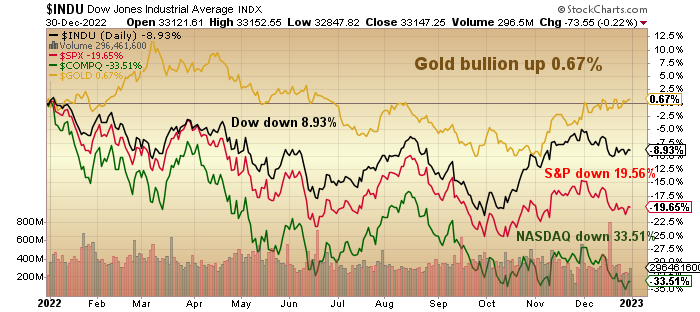
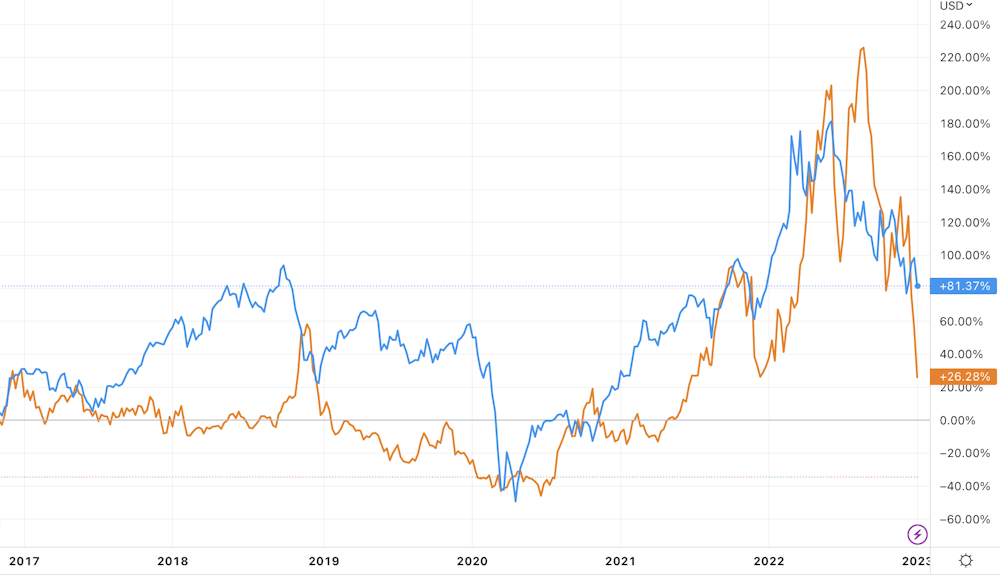
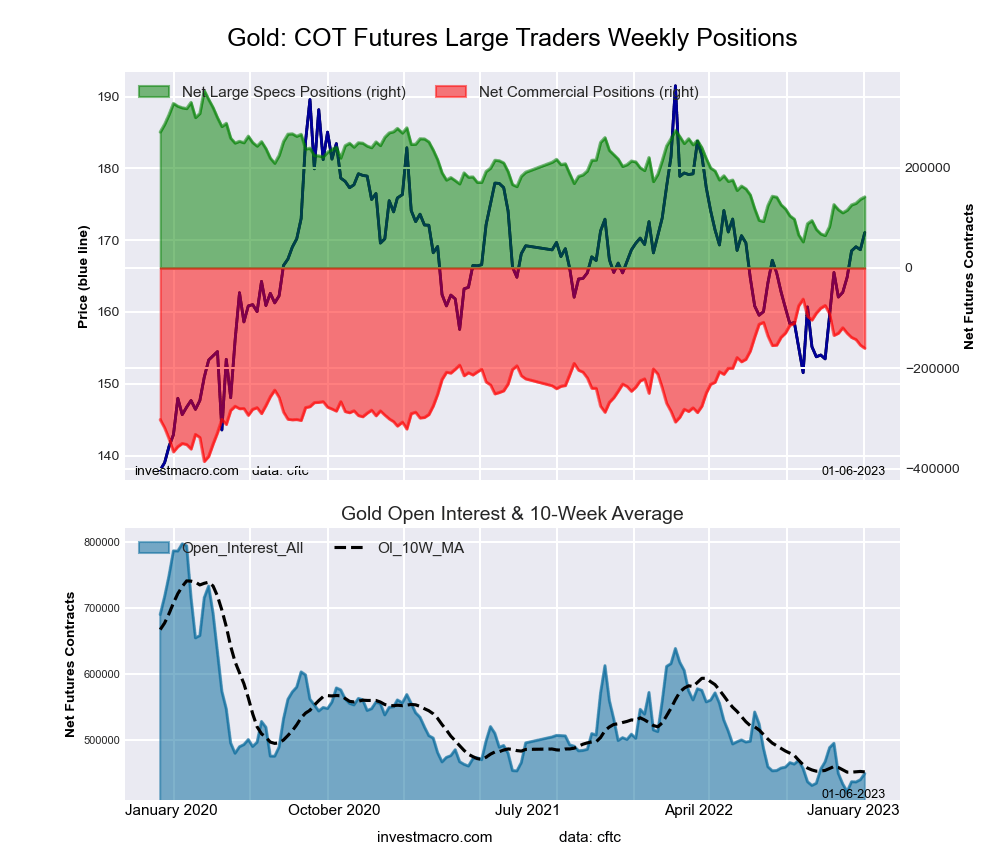
The chart shown here speaks volumes about the utility of gold as a safe haven asset. Even a modest portfolio allocation to physical gold would have mitigated the damage done by the 2022 bear market mauling.
As for the broad stock markets, I always wait for the results of the period of December 23rd to the end of the first five trading days of the New Year before launching the Forecast Issue. I am a staunch believer in the predictive power of the January Barometer, which includes the “early warning signal” of the first five days in combination with the results of the Santa Claus Rally.
First Five Days “Early Warning” Indicator
The last forty-seven up First five Days were followed by full-year gains thirty-nine times for an 83.0% accuracy ratio and a 14% average in all forty-seven years.
With the S&P 500 ahead 52.59 points (1.37%) at the end of the first five trading days of this year, it increases the likelihood that the lows seen in October at 3,491.58 were “THE” lows for the 2022 bear market. With the Santa Claus Rally actually eking out a modest gain of 0.03%, these two outcomes are simply indications that the more important January Barometer may register a positive outcome, and since it sports an 83.3% accuracy rating since 1952, I look for the mid-January reading in order to lock-and-load strategy for the year.
At the end of December, I read hundreds of pages of investment forecasts from dozens of market strategists, and if there is one theme that has been dominating the 2023 investment narrative, it is that the first half of the year is going to see new lows as the U.S. economy sinks into a severe recession brought about by a behind-the-curve Fed and rapidly-dwindling inflation rates.
I will summarize 2023 with this simple comment: what worked in the period 2009 to 2022 will not work in 2023 and beyond.
Every single newsletter has “something breaking” in H1/2023, forcing the Fed to change policy in order to maintain the integrity of the financial system resulting in a massive recovery in stocks and commodities (risk assets).
As I pointed out in an earlier email alert, famous technical analyst Bob Farrell’s Rule #9 for Investing says: “When all experts and forecasts agree, something else I going to happen.”
I cannot overestimate this unanimity of opinion as to the outlook for 2023, and it is coming from people that I generally follow and whose advice has been remarkably consistent. The problem I have is that every one of these gurus has been calling for a Fed “pivot” through most of the latter half of 2022, and if there is one thing that I have learned after nearly five decades of following markets, it is this: never try to tell the market what it is going to do; let the market tell you what it wants to do.
I will summarize 2023 with this simple comment: what worked in the period 2009 to 2022 will not work in 2023 and beyond. Given that the reverse of that will turn out to be true, an overweight position in the junior gold and silver developers seems both timely and prudent.
Good luck in 2023.
Michael Ballanger Disclaimer:
This letter makes no guarantee or warranty on the accuracy or completeness of the data provided. Nothing contained herein is intended or shall be deemed to be investment advice, implied or otherwise. This letter represents my views and replicates trades that I am making but nothing more than that. Always consult your registered advisor to assist you with your investments. I accept no liability for any loss arising from the use of the data contained on this letter. Options and junior mining stocks contain a high level of risk that may result in the loss of part or all invested capital and therefore are suitable for experienced and professional investors and traders only. One should be familiar with the risks involved in junior mining and options trading and we recommend consulting a financial adviser if you feel you do not understand the risks involved.
Disclosures:
1) Michael J. Ballanger: I, or members of my immediate household or family, own securities of the following companies mentioned in this article: None. I personally am, or members of my immediate household or family are, paid by the following companies mentioned in this article: My company, Bonaventure Explorations Ltd., has a consulting relationship with: None.
2) The following companies mentioned in this article are billboard sponsors of Streetwise Reports: None. Click here for important disclosures about sponsor fees. As of the date of this article, an affiliate of Streetwise Reports has a consulting relationship with: None. Please click here for more information.
3) Statements and opinions expressed are the opinions of the author and not of Streetwise Reports or its officers. The author is wholly responsible for the validity of the statements. The author was not paid by Streetwise Reports for this article. Streetwise Reports was not paid by the author to publish or syndicate this article. Streetwise Reports requires contributing authors to disclose any shareholdings in, or economic relationships with, companies that they write about. Streetwise Reports relies upon the authors to accurately provide this information and Streetwise Reports has no means of verifying its accuracy.
4) This article does not constitute investment advice. Each reader is encouraged to consult with his or her individual financial professional and any action a reader takes as a result of information presented here is his or her own responsibility. By opening this page, each reader accepts and agrees to Streetwise Reports’ terms of use and full legal disclaimer. This article is not a solicitation for investment. Streetwise Reports does not render general or specific investment advice and the information on Streetwise Reports should not be considered a recommendation to buy or sell any security. Streetwise Reports does not endorse or recommend the business, products, services or securities of any company mentioned on Streetwise Reports.
5) From time to time, Streetwise Reports LLC and its directors, officers, employees or members of their families, as well as persons interviewed for articles and interviews on the site, may have a long or short position in securities mentioned. Directors, officers, employees or members of their immediate families are prohibited from making purchases and/or sales of those securities in the open market or otherwise from the time of the decision to publish an article until three business days after the publication of the article. The foregoing prohibition does not apply to articles that in substance only restate previously published company releases.


