
Source: Ron Struthers (1/17/23)
Ron Struthers believes that specifically, the debt market could break. The U.S. ran about a US$1.4 trillion deficit in 2022 (ended September) that Struthers believes will swell to US$2.5 trillion in 2023.
Key Points
- US Deficit to double.
- The election of House Leader McCarthy will have a huge impact.
- Fed forced to pivot for the wrong reason.
- Market narrative wrong again.
- Inflation back up and interest rates higher.
- Energy to go higher in 2023.
- A huge gold rally takes hold.
Specifically, the debt market could break. The U.S. ran about a US$1.4 trillion deficit in 2022 (ended September) that will swell to US$2.5 trillion in 2023. For some round numbers, Interest on the debt is going up with higher rates adding about US$200 billion.
In 2022 about US$600 billion in capital gains tax got paid and that won’t happen in 2023. There was an 8.7% increase in social security etc. that adds about US$120 billion. Then you have student loan forgiveness and Ukraine aid so we can easily go to a US$2.5 trillion deficit. And if a recession sets in, tax receipts will go down too.
McCarthy
Most people don’t understand the implications of the election of new house leader Kevin McCarthy over the majority Republican House. Most media focused on the 15 rounds of voting it took. Republicans divided and it was the evil, extreme far right that forced the situation.
McCarthy made concessions that will weaken his power, make it easier for lawmakers to oust him, and give the right-wing rank-and-file greater input in legislation and in lawmakers’ assignments to committees. Bigger consequences will unfold months from now if these ultraconservatives again withhold their votes until they have their way on looming spending bills and the debt ceiling. One of their main goals is to shrink the size of the government.
“If you don’t stop spending money that we don’t have to fund the bureaucracy that is undermining the American people, we cannot win,” said Chip Roy, a Republican who voted against McCarthy in 11 ballots.
They want an end to massive spending bills moved forward with little time to read the legislation. They want a minimum 72-hour review period and a reduction of massive omnibus bills, to allow members and the public to better understand what is being passed.
The market narrative currently is along the lines that inflation will continue downward, the Fed will stop raising rates, and soon start easing. I will try to explain why this is wrong again.
The concessions reportedly include “open rules” on all major rules bills, such as appropriations, to allow lawmakers to offer amendments on the floor. It would restore an amendment process that was gutted in recent sessions, benefiting both parties. They would reinstate “Calendar Wednesday,” which permits committee chairs to bring reported bills directly to the House floor.
Massive bills are a way to hide personal perks and pork projects under fraudulent packaging like the “Inflation Reduction Act” which had little to do with inflation. The omnibus bill recently pushed through the House and Senate is an example of this abusive, opaque process. It was a collection of 7,200 earmarks and pork projects, including tens of millions for libraries for the papers of a couple of retiring senators; five senators grabbed half a billion dollars for their favorite colleges. You had to swallow it whole or kill the whole spending bill.
Fed Forced to Pivot
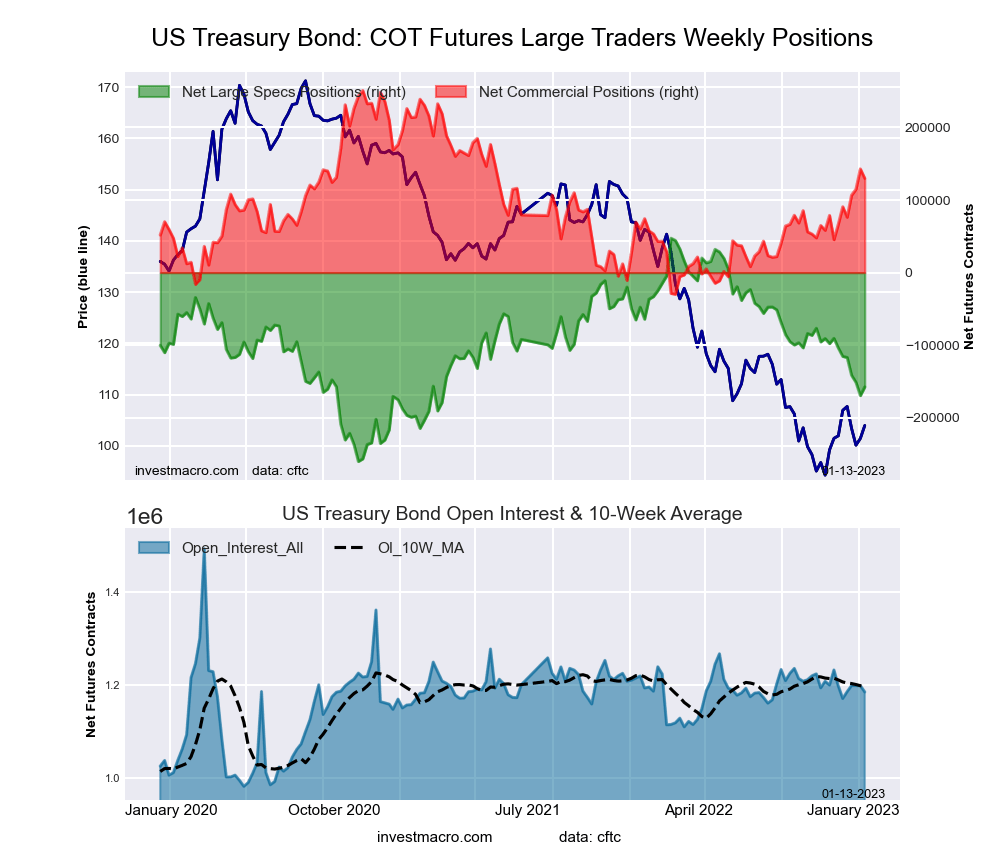
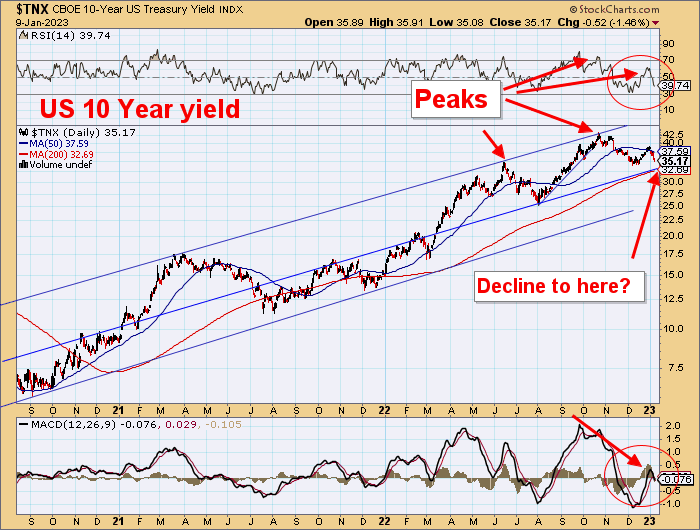
There is only so much supply the bond market can take, and it won’t like a U.S. debt default scare. So the Fed could be forced to pivot, not because inflation comes down but because the bond market breaks. Most people believe the Fed is bigger than the market and so does the Fed but at times reality sets in. How long will investors and other countries buy bonds yielding 3.5% when inflation is 6% or 7%?
Perhaps the Fed can hold the bond market together this year, but it certainly can’t continue until 2024; something is going to break.
I say it is a good thing that the so-called far-right Republicans will have influence, government spending has to get back to some control and restraint, it has totally gone bonkers in the U.S. and Canada too. This could also cause problems in the bond market, and the first test of this will be passing legislation to extend the debt ceiling. This could drag out a long time, and these Republicans will demand spending cuts. It is probably a good thing in the long run, but the short term could cause market turmoil, raising longer-term interest rates.
The market narrative currently is along the lines that inflation will continue downward, the Fed will stop raising rates, and soon start easing. I will try to explain why this is wrong again.
I made the comment numerous times, such as in June 2022 that the inflation problem was created by Covid-19 policies, specifically all the money printing. In previous QE, after the 2008 financial crash, it was all money created in banking reserves, but that does not mean the money gets into the economy but certainly helps the bank. My point with Covid-19 money printing, a lot was going right to consumers. I highlighted the high personal savings rate and swelling Robinhood stock accounts.
The Fed has now quantified how much Covid-19 stimulus went directly into bank accounts. A friend sent me an excellent video that analysis the Fed’s numbers in the report. This chart from the Fed report shows a strong move above baseline growth.
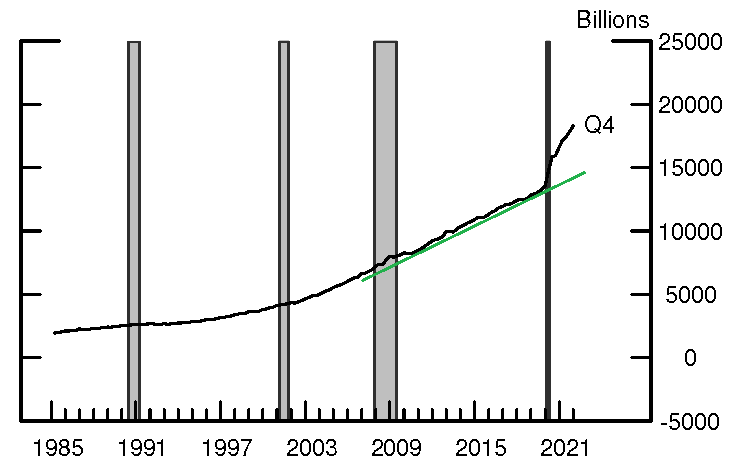
Bank deposits grew by over US$5 trillion, and that is shown better in the next table below.
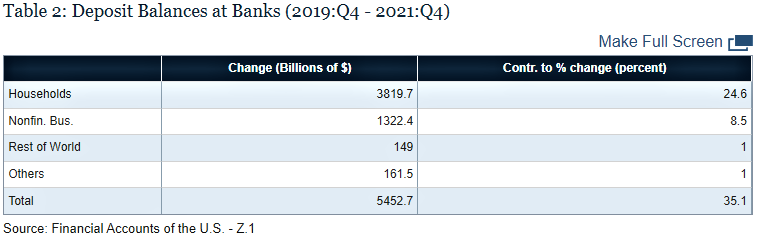
The Fed report concludes that “Data from the U.S. Financial Accounts, shown in Table 2 broadly confirm the evidence, specifically, household deposit balances at banks (the sum of checkable, time, and savings deposits) rose by substantially more than deposits held by nonfinancial businesses between 2019:Q4 and 2021:Q4, accounting for nearly two-thirds of the overall increase in aggregate deposits. “
Households got US$3.8 trillion, and that is a huge number. There is your smoking gun that caused the current inflation and now that inflation has become entrenched. The QE from the Fed went mostly to banks that ended up inflating bubbles in stocks, bonds, and somewhat crypto.
Households got US$3.8 trillion, and that is a huge number. There is your smoking gun that caused the current inflation and now that inflation has become entrenched.
About 10% of the Fed’s QE bought nonbank financial assets highlighted in the video, and this is something new and significant from past QE. Households added significantly to stock, crypto, and housing bubbles, but also, a lot of the funds went into the economy, spiking demand for goods at a time of shortages from Covid-19 policies, thus the high inflation.
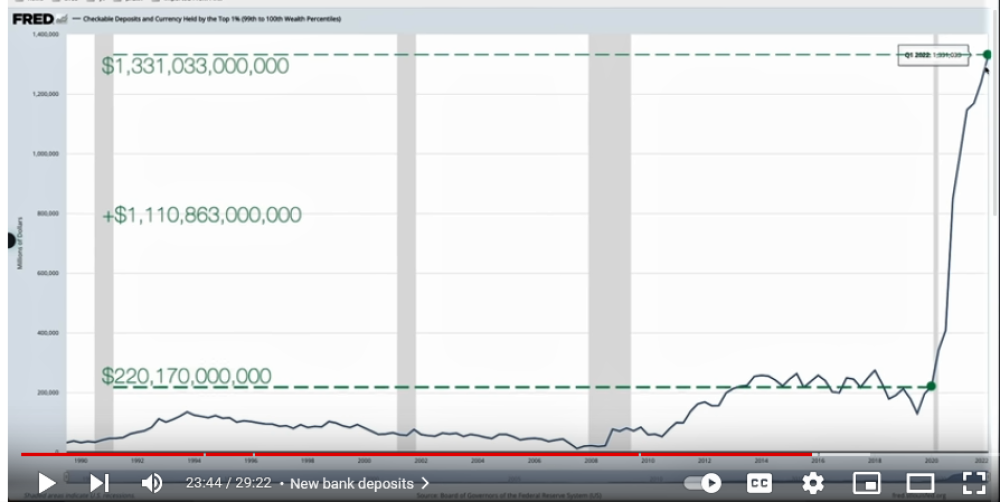
Some interesting numbers in the video, by wealth, the bottom 50% saw bank deposits increase an additional US$167 billion. The 50% to 90% group saw an increase of US$784.5 billion. Now the bottom 9% of the top 10% or you could say the 90% to 99% group saw an additional US$1.1 trillion, and the wealthiest, the top 1%, also had an increase of US$1.1 trillion.
I took a screenshot of the screen in the video showing this increase. You get a better perspective on how large the increase was relative to pre Covid-19. As always the wealthy get the most, and a lot of this could be related to Covid-19 wage subsidies and loans that went to business owners.
The Fed cannot remove the stimulus already out there, and they cannot control the Biden Administration’s inflationary fiscal policy, although the Republican house might be able to curtail it.
As I mentioned, we probably have a temporary reprieve with energy inflation, but most important for 2023 is a continued labor shortage and tight labor market. This is highlighted by all the problems you see at medical facilities and airlines, and that is because you cannot quickly train new pilots, aircraft mechanics, doctors, nurses, etc. These services affect our day-to-day lives, so another reason there is lots of press coverage. There are three main factors at work here.
1 – The shot mandates for workers in many sectors caused them to quit or be fired. Although ongoing court rulings are allowing them to come back, in many cases, the mandates were enough to tip the scale to an earlier-than-planned retirement. This affected between 10% and 20% of the workforce in some sectors.
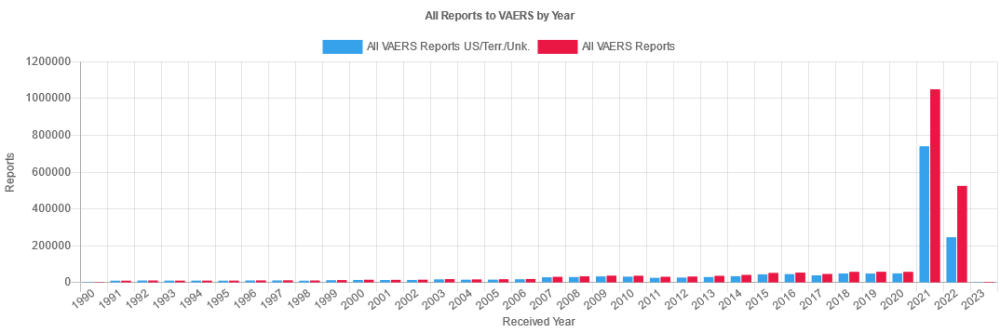
2 – Spike in sickness and death post Covid-19 shots along with Covid-19 sickness leave policy. I know this is controversial, and you can argue the cause, but you cannot argue the factual data. In Canada, 80 young doctors have died suddenly or unexpectedly. We need those 80 doctors. As of December 23, 2022, the U.S. Vaccine Adverse Events Reporting System (VAERS) had received 33,334 reports of post-jab deaths, 26,045 cases of myocarditis, and 15,970 heart attacks. Only a small fraction of vaccine problems get officially reported, but it is easy to see it has gone through the roof since the mRNA shots.
The U.S. government suspiciously has data only up to March or June 2020, but more recently, for example, from January 1, 2022, to December 31, 2022, California required most employers to provide workers up to 80 hours of supplemental paid sick leave for COVID-19 reasons. I think sick leave is a bigger factor for businesses trying to cope with worker shortages.
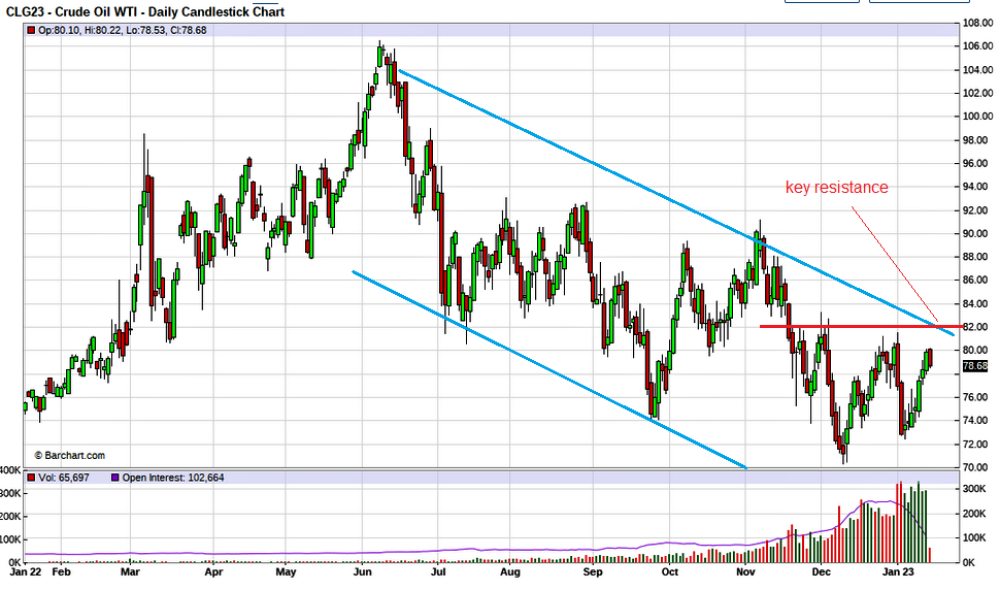
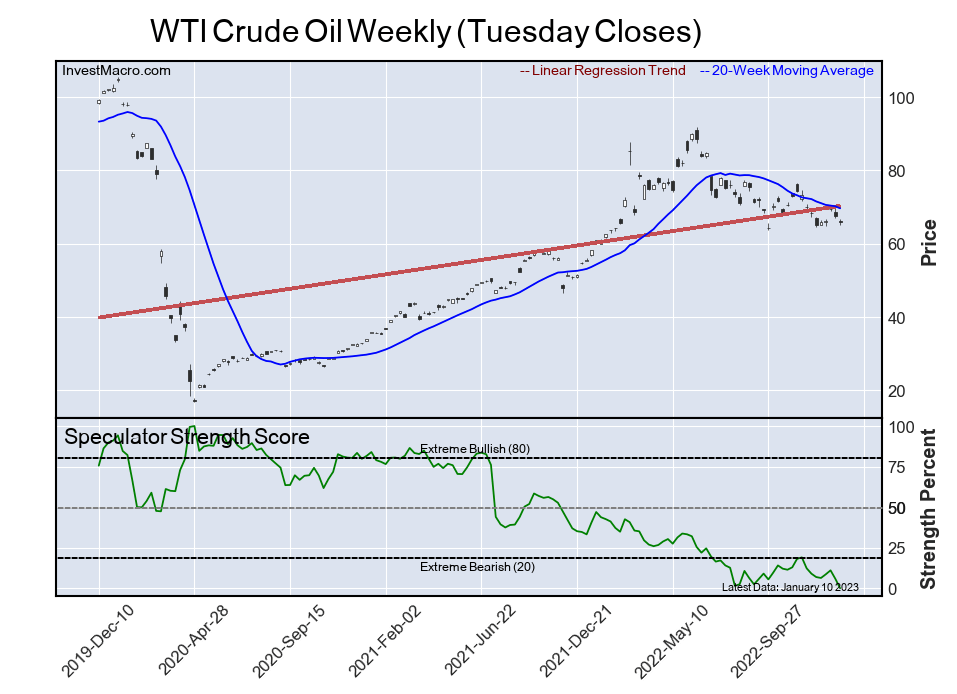
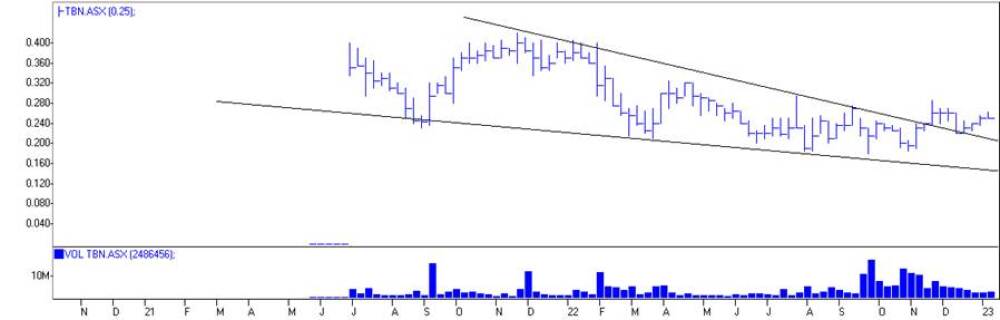
With oil, the key level to watch is US$82. If oil breaks above that, it would be a higher high and break the downtrend channel.
From a US Census Bureau survey in June 2022, they estimated around 16 million working-age Americans had long Covid (3 months and longer).
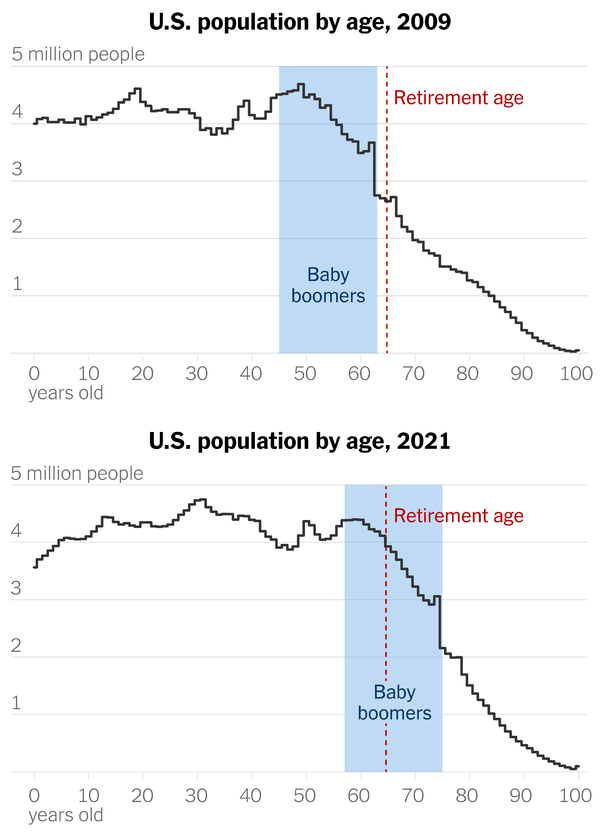
3 – Boomers are leaving the workforce. In 2019, just before the pandemic, 57% of Americans in their early 60s were still working, compared with 46% of that age group two decades earlier. The outsize importance of the boomers is the result of the generation’s size: Some 76 million Americans were born between 1946 and 1964. By comparison, just 47 million people were born into the so-called silent generation that preceded the boomers and 55 million into Generation X.
Labor Shortage
Although the Covid-19 factors are significant, the boomers’ retirement is the biggest factor, and Covid-19 caused many to retire perhaps a few years ahead of plans. This is a chart from a NY Times article that illustrates well this big group moving into retirement years.
The country has a “structural labor shortage” that is unlikely to be resolved anytime soon, Jerome Powell, the Federal Reserve chair, said last month.
Last Friday’s job report showed that 2022 was the second-best year on record in terms of raw job growth, behind only 2021. The tight labor market is going to continue upward pressure on inflation with higher wages.
Food inflation will likely get worse. Few are talking about the effect of fertilizer shortages and prices because of the Ukraine war. “This could be the end of an era of cheap food. While almost everyone will feel the effects of that on their weekly shop, it’s the poorest people in society, who may already struggle to afford enough healthy food, who will be hit hardest,” said Dr. Peter Alexander, citing a study led by the University of Edinburgh’s School of GeoSciences.
Using computer model simulations, the research team estimated that the combined effect of elevated fertilizer prices, rising energy costs, and export restrictions could push up food costs by 81% in 2023 when compared to 2021.
Nutrien Ltd. (NTR:NYSE) ($74) would be a good stock; it mainly produces from fertilizers from six mines in Canada.
Markets are in for a nasty surprise in 2023 as high inflation, and interest rates prove very sticky. In fact, there is a substantial risk that we even see inflation go back up. As mentioned, food prices will probably rise, and energy markets are still very tight.
Oil and Gas
So far, a milder winter has helped, but there is lots of time for cold spells. Gasoline inventories normally build in the winter before the summer driving season, but after a decent start, it is not looking as good. Gasoline futures bottomed in December just above US$2.00 and now moved up to US$2.50.
Wars are uncertain. Russia is or will soon be launching a winter offensive. How successful will either side be? In a prolonged war, can the West keep providing for Ukraine?
Navy Secretary Carlos Del Toro acknowledged before a naval warfare conference in Arlington, Virginia, last Wednesday that the U.S., within the next six months, could face a decision of whether to arm itself or Ukraine due to rapidly depleting stockpiles due to supplying Ukraine.
Will the sanctions with price caps take much oil off the market? The West has pulled out of Russia, and specifically, BP ran one of the largest oil fields.
Will the Russians be able to keep production going? War in itself is a big consumer of energy, so demand is increasing some here. In a few months’ time, we might have a more clear picture of the war, but there is plenty of uncertainty in oil markets, particularly regarding the timing of China’s demand recovery as it moves away from its zero-Covid policy.
There are no more releases from the SPR, and China demand will gradually recover post-zero-Covid policy. Oil and gas companies are focused on shareholder returns, so we won’t have much new supply either. Energy inventories in all forms are around or below 5-year averages, so there is no buffer to any disruptions. The fundamentals support oil going back above US$100 in 2023
With oil, the key level to watch is US$82. If oil breaks above that, it would be a higher high and break the downtrend channel. On the downside, it would be very bearish if oil dropped below US$70 or new lows in this recent trend.
The Recession Is the End Game
I believe it will take a significant recession and weak jobs market to get inflation under control, and we are headed in that direction. The World Bank has slashed its 2023 global growth forecast by almost half — from 3% to 1.7% — as elevated inflation, higher interest rates, reduced investment, and Russia’s invasion of Ukraine constrain economic activity.
If that wasn’t enough, the Washington-based lender warned that any new adverse shocks could push the global economy into recession, which would mark the first time in more than 80 years that two global recessions occurred within the same decade.
Over in the U.S., the economy is expected to experience 0.5% growth in 2023, 1.9 percentage points below previous forecasts and the weakest performance outside of official recessions since 1970.
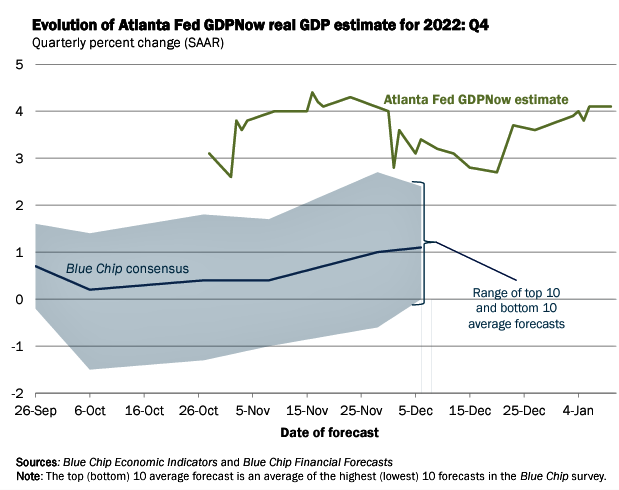
Currently, we are not near a recession. In my experience, what is unusual is the huge spread between mainstream analysts at a median of around 1% and the Atlanta Fed at 4%. Usually, the Atlanta Fed has a lower forecast than the mainstream. I expect this is optimism from the mainstream for slower growth and a Fed pivot.
The market is pricing in a Fed pivot and soft landing. Part of the pivot is when the Fed stops raising rates, but as I mentioned above, bond markets could push long rates higher no matter what the Fed does. I think Powel wants to be a Volcker, and he will drive the economy into the ground to do so.
Unfortunately, that is what it will take. Near term, if inflation keeps easing, the Fed slows or stops the rate increases, and it could be viewed very positively. However, before long, the inflation decreases will stop and remand stubbornly high, and there is considerable risk inflation heads back up. The Fed will keep tightening and force a recession and hard landing. And if they cause a bad recession, it may be difficult to stimulate back out of it. The Fed is walking a tightrope and usually falls.
On the recession watch — In a recession, housing goes, then cars, and then jobs.
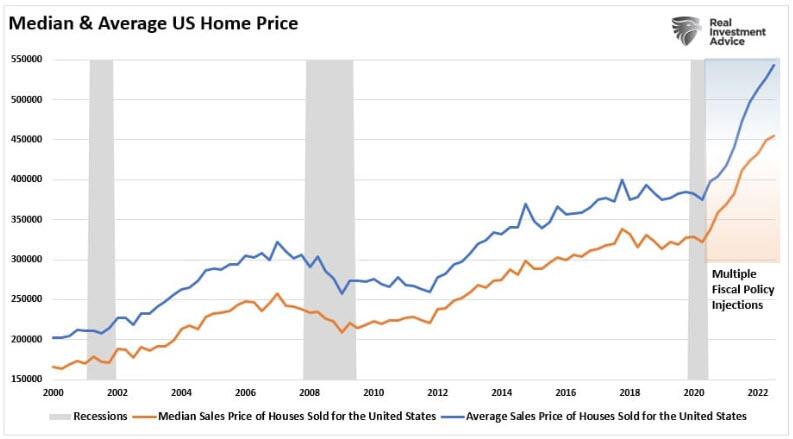
Existing home sales are down to 2020 lows. Sales plunged 35.4% from November last year. Excluding the steep sales downturn that occurred in May 2020 at the start of the pandemic, sales are now at the slowest annual pace since November 2010, when the housing market was mired in the aftermath of the foreclosure crisis of 2007/08.
I have focused mostly on the Canadian housing bubble as it is more overpriced in the U.S., but the bubble in the U.S. is no slouch either. Prices went too far with the easy Covid-19 money, so they have a long way to pull back.
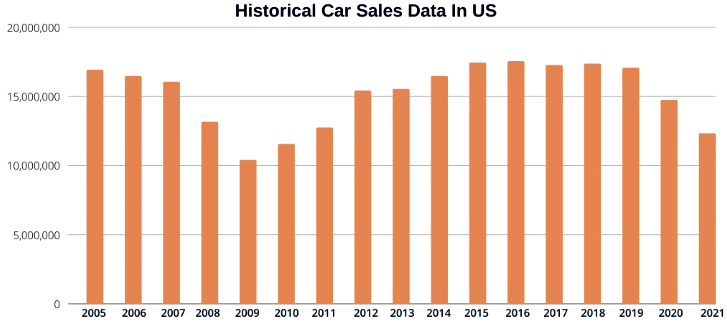
U.S. Auto Sales
U.S. auto sales were negatively impacted in 2020/21 by Covid-19 lockdowns and restrictions and then by chip shortages in 2021 and 2022.
Sales dropped another -7.4% in 2022 to 13,899,871. Most analysts now expect a rebound because we have moved from a chip shortage to a surplus. I expect a rebound too, but new car financing will be tougher, and if we are or do go into recession, this will be a negative for Auto sales. I will be watching this closely this year.
Workforce Cuts
The latest: Salesforce Inc. (CRM:NYSE) is cutting 10% of its workforce and is closing some offices, leading to US$1.4B-$2.1B in charges for the company and around 8,000 layoffs.
Amazon.com Inc. (AMZN:NASDAQ) is also slashing its headcount — by over double that figure.
The retail behemoth has confirmed that 18,000 employees will get the axe, with the bulk of the roles due for elimination concentrated in the firm’s e-commerce and human resources.
According to the tracking website “layoffs.fyi,” more than 150K tech workers were fired in 2022, and that number is poised to grow this year. However, there are growth and labor shortages in many other sectors that are offsetting this resulting in continued job growth and rising wages.
The tech sector is basically shedding excess, and they have further to go. The days of easy debt and equity financing are over that tech companies used to grow. In Canada, Bay Street is full of junior bankers who were not even alive the last time Canadian capital markets had a year as slow as 2022. The Globe’s Jameson Berkow writes that the total value of new stock issued by companies last year fell 73% to US$14.4-billion from US$52.7-billion in 2021. It was much worse in the U.S. as IPO deals plummeted 94%, according to Ernst&Young.
The U.S. economy grew an annualized 3.2% per quarter in Q3 2022, better than 2.9% in the second estimate and rebounding from two straight quarters of contraction. I watch the Atlanta GDP now forecasts, and they are way up at 4% growth for Q4 2022.
Currently, we are not near a recession. In my experience, what is unusual is the huge spread between mainstream analysts at a median of around 1% and the Atlanta Fed at 4%. Usually, the Atlanta Fed has a lower forecast than the mainstream. I expect this is optimism from the mainstream for slower growth and a Fed pivot. Again, a surprise on inflation resilience is around the corner.
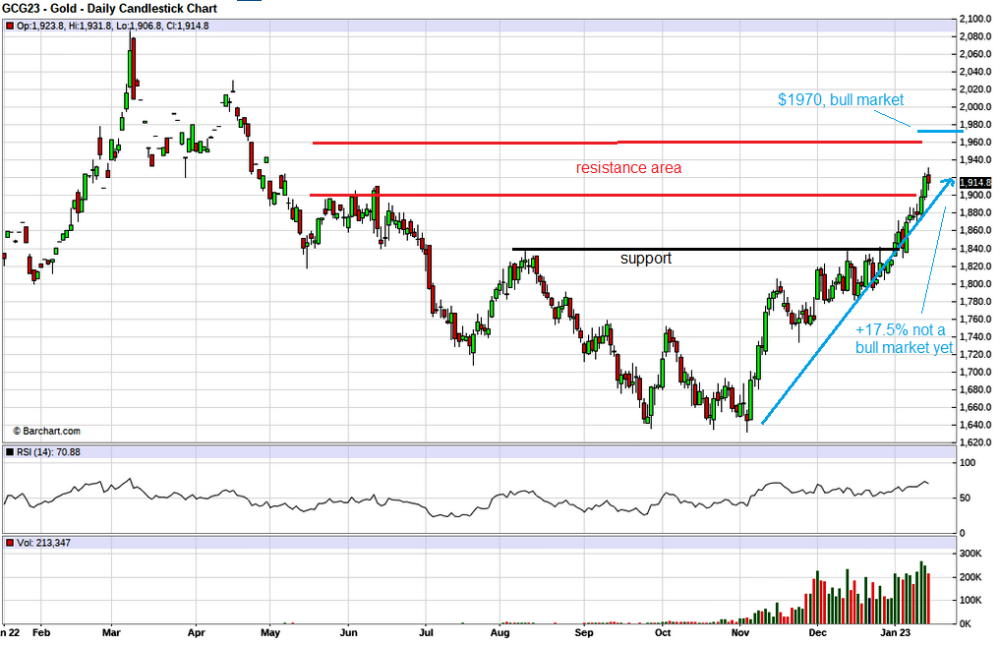
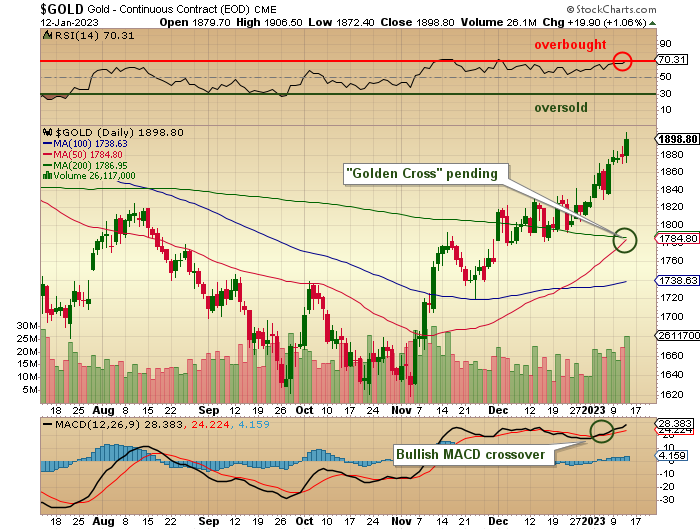
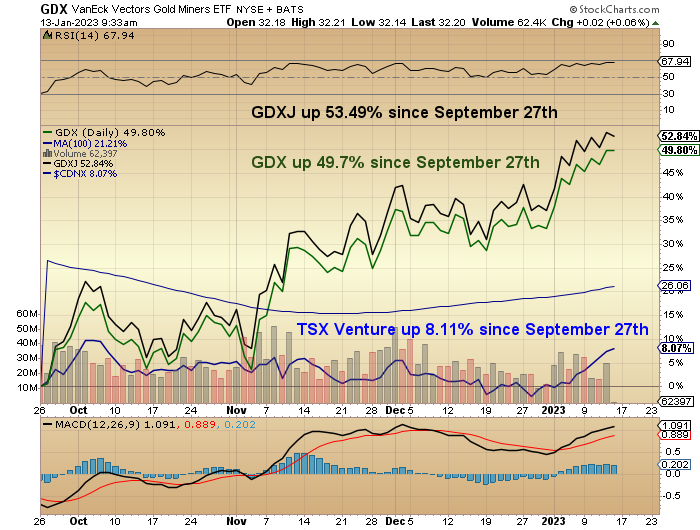
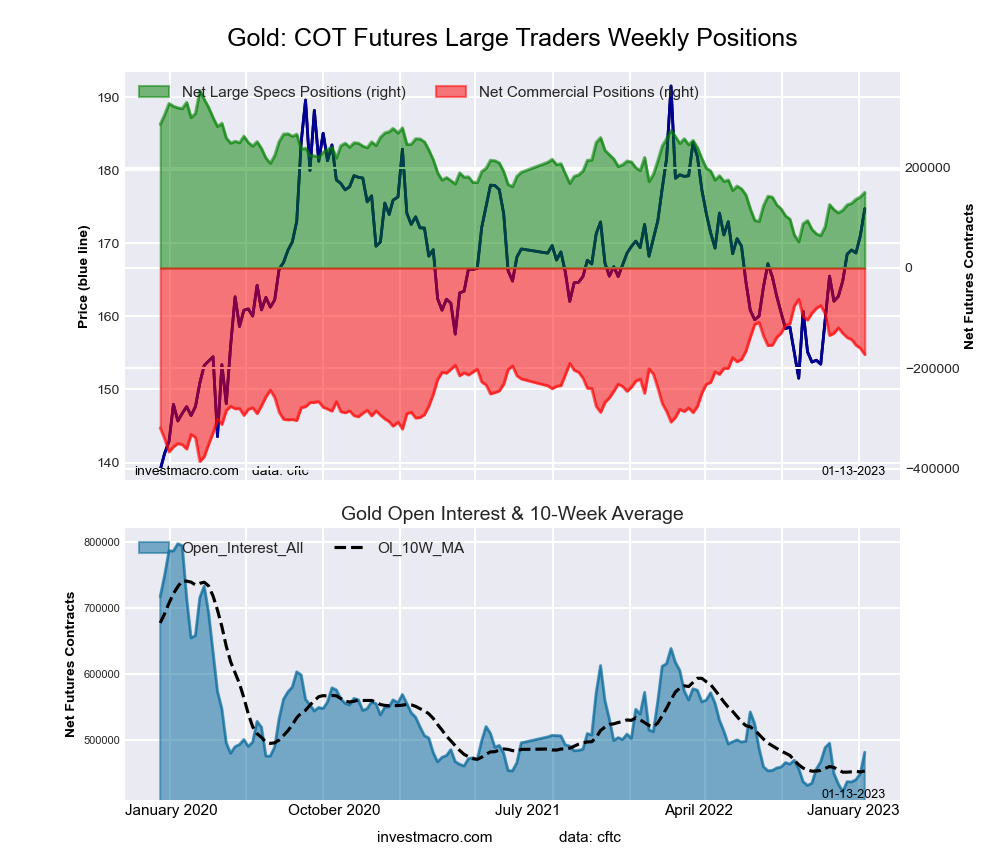
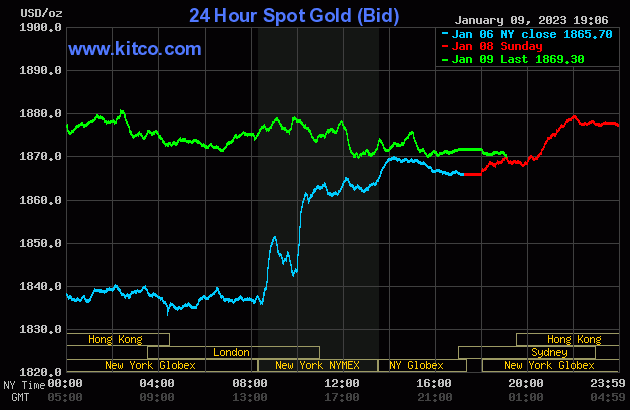
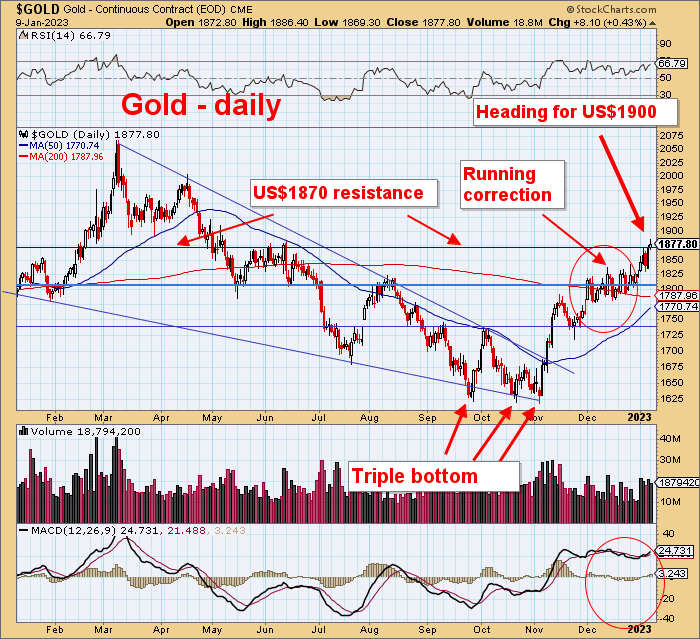
Gold has moved strongly from the November bottom and is now around the middle of my resistance area. I am expecting some consolidation and/or a pullback.
On the bullish side, the US$1970 price signifying a new bull market, may act as a magnet. Gold might also be pricing in a Fed slowdown in rate increases and a pivot.
As noted above, I am skeptical about this.
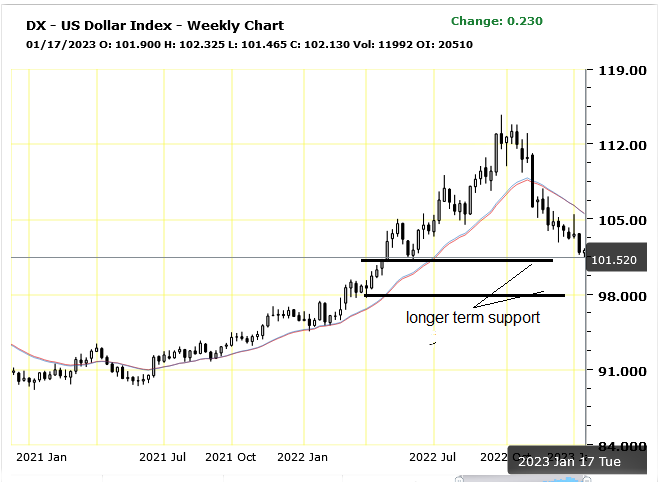
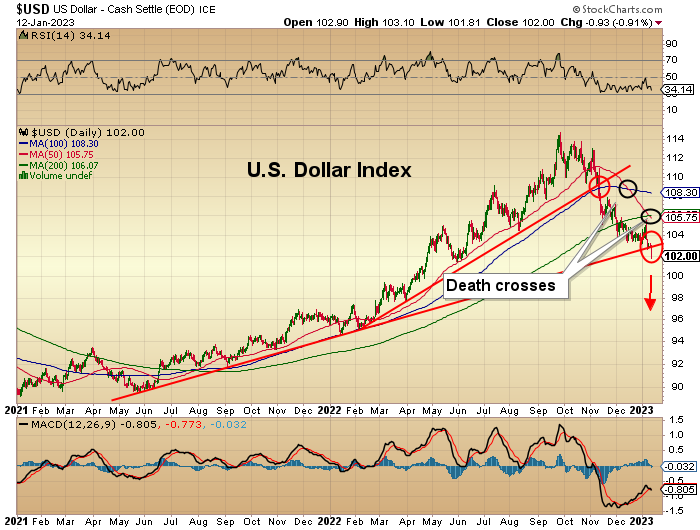
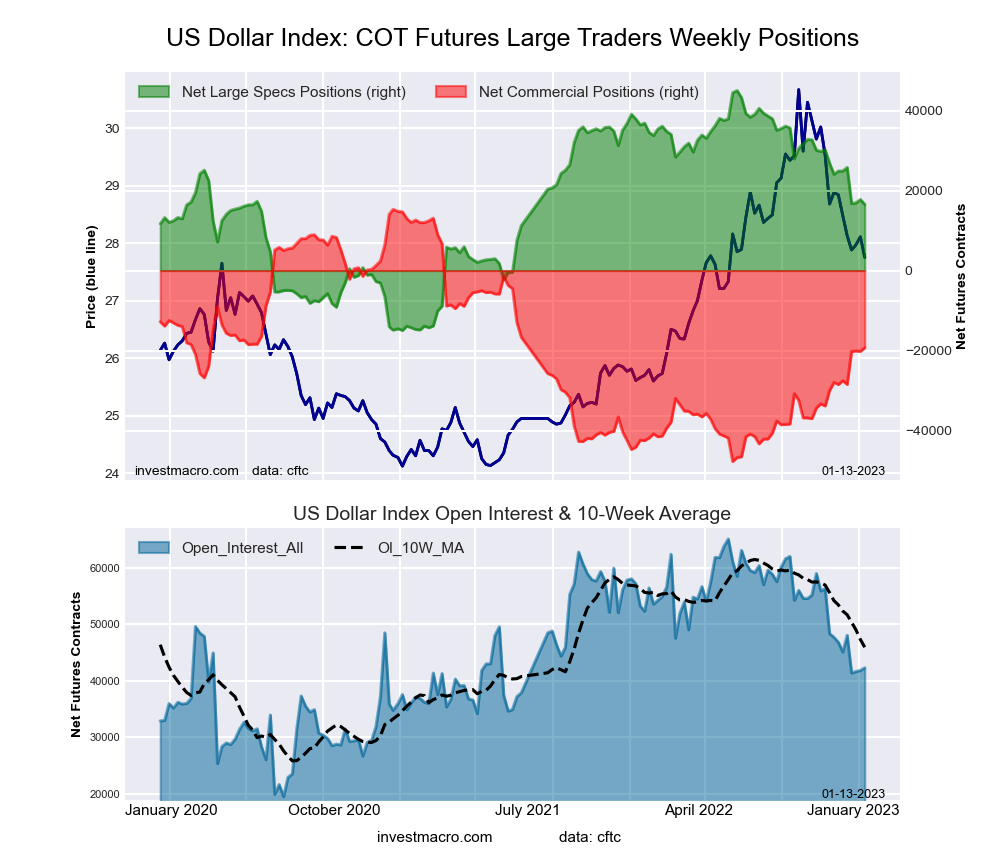
Short term, it is the fall in the U.S. dollar index that has been a significant bullish factor for gold. The U.S. dollar index is nearing a long-term support area, so I do not expect much more weakness in 2023.
In Summary From Above
The market is pricing in a Fed pivot and soft landing. Part of the pivot is when the Fed stops raising rates, but as I mentioned, bond markets could push long rates higher no matter what the Fed does. I think Powel wants to be a Volcker, and he will drive the economy into the ground to do so.
Unfortunately, that is what it will take. Near term, if inflation keeps easing, the Fed slows or stops the rate increases, it could be viewed very positively. However, before long, the inflation decreases will stop and remand stubbornly high and there is considerable risk inflation heads back up. The Fed will keep tightening and force a recession and hard landing. And if they cause a bad recession, it may be difficult to stimulate back out of it.
The Fed is walking a tightrope and usually falls.
Struthers Stock Report Disclaimers:
All forecasts and recommendations are based on opinion. Markets change direction with consensus beliefs, which may change at any time and without notice. The author/publisher of this publication has taken every precaution to provide the most accurate information possible. The information & data were obtained from sources believed to be reliable, but because the information & data source are beyond the author’s control, no representation or guarantee is made that it is complete or accurate.
The reader accepts information on the condition that errors or omissions shall not be made the basis for any claim, demand or cause for action. Because of the ever-changing nature of information & statistics the author/publisher strongly encourages the reader to communicate directly with the company and/or with their personal investment adviser to obtain up to date information.
Past results are not necessarily indicative of future results. Any statements non-factual in nature constitute only current opinions, which are subject to change. The author/publisher may or may not have a position in the securities and/or options relating thereto, & may make purchases and/or sales of these securities relating thereto from time to time in the open market or otherwise. Neither the information, nor opinions expressed, shall be construed as a solicitation to buy or sell any stock, futures or options contract mentioned herein. The author/publisher of this letter is not a qualified financial adviser & is not acting as such in this publication.
Disclosures:
Charts provided by the author.
1) Ron Struthers: I, or members of my immediate household or family, own shares of the following companies mentioned in this article: None. I personally am, or members of my immediate household or family are, paid by the following companies mentioned in this article: None. My company currently has a financial relationship with the following companies mentioned in this article: None. I determined which companies would be included in this article based on my research and understanding of the sector.
2) The following companies mentioned in this article are billboard sponsors of Streetwise Reports: None. Click here for important disclosures about sponsor fees. The information provided above is for informational purposes only and is not a recommendation to buy or sell any security.
3) Statements and opinions expressed are the opinions of the author and not of Streetwise Reports or its officers. The author is wholly responsible for the validity of the statements. The author was not paid by Streetwise Reports for this article. Streetwise Reports was not paid by the author to publish or syndicate this article. Streetwise Reports requires contributing authors to disclose any shareholdings in, or economic relationships with, companies that they write about. Streetwise Reports relies upon the authors to accurately provide this information and Streetwise Reports has no means of verifying its accuracy.
4) This article does not constitute investment advice. Each reader is encouraged to consult with his or her individual financial professional and any action a reader takes as a result of information presented here is his or her own responsibility. By opening this page, each reader accepts and agrees to Streetwise Reports’ terms of use and full legal disclaimer. This article is not a solicitation for investment. Streetwise Reports does not render general or specific investment advice and the information on Streetwise Reports should not be considered a recommendation to buy or sell any security. Streetwise Reports does not endorse or recommend the business, products, services, or securities of any company mentioned on Streetwise Reports.
5) From time to time, Streetwise Reports LLC and its directors, officers, employees, or members of their families, as well as persons interviewed for articles and interviews on the site, may have a long or short position in the securities mentioned. Directors, officers, employees, or members of their immediate families are prohibited from making purchases and/or sales of those securities in the open market or otherwise from the time of the decision to publish an article until three business days after the publication of the article. The foregoing prohibition does not apply to articles that in substance only restate previously published company releases.


 4
4


