By InvestMacro

Here are the latest charts and statistics for the Commitment of Traders (COT) data published by the Commodities Futures Trading Commission (CFTC).
The latest COT data is updated through Tuesday October 4th and shows a quick view of how large market participants (for-profit speculators and commercial traders) were positioned in the futures markets. All currency positions are in direct relation to the US dollar where, for example, a bet for the euro is a bet that the euro will rise versus the dollar while a bet against the euro will be a bet that the euro will decline versus the dollar.
Weekly Speculator Changes
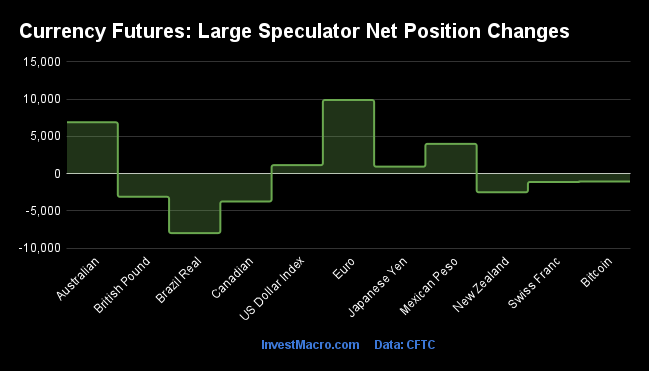
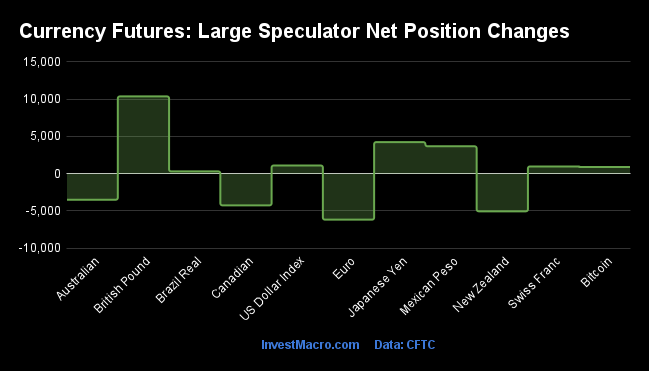
The COT currency market speculator bets were slightly lower this week as five out of the eleven currency markets we cover had higher positioning while the other six markets had lower speculator contracts.
Leading the gains for the currency markets was the Euro (9,885 contracts) with the Australian dollar (6,889 contracts), the Mexican peso (4,001 contracts), the US Dollar Index (1,135 contracts) and the Japanese yen (933 contracts) also showing a positive week.
The currencies leading the declines in speculator bets this week were the Brazilian real (-7,985 contracts) with the Canadian dollar (-3,741 contracts), the British pound sterling (-3,115 contracts), the New Zealand dollar (-2,507 contracts), the Swiss franc (-1,122 contracts) and Bitcoin (-1,056 contracts) also registering lower bets on the week.
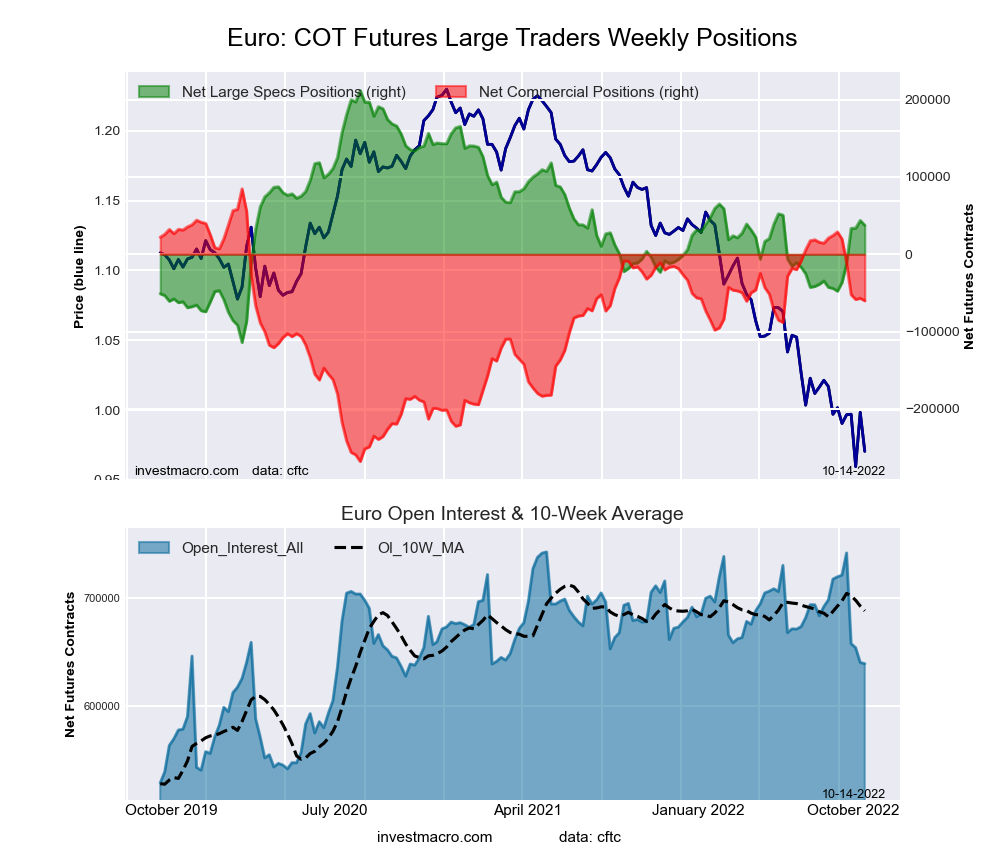
Highlighting the COT currency positioning this week is the Euro speculators positioning that has improved for the fifth straight week. Euro speculators have now boosted their net positions by a total of +91,358 contracts over these past five weeks. This has taken the net positioning from -47,676 contracts on August 30th to a total of +43,682 contracts this week and to the most bullish level since June 7th, a span of 17 weeks.
Speculators are clearly betting that the Euro is near or getting near a bottom against the US dollar as the Euro prices have been testing 20-year lows versus its American counterpart.
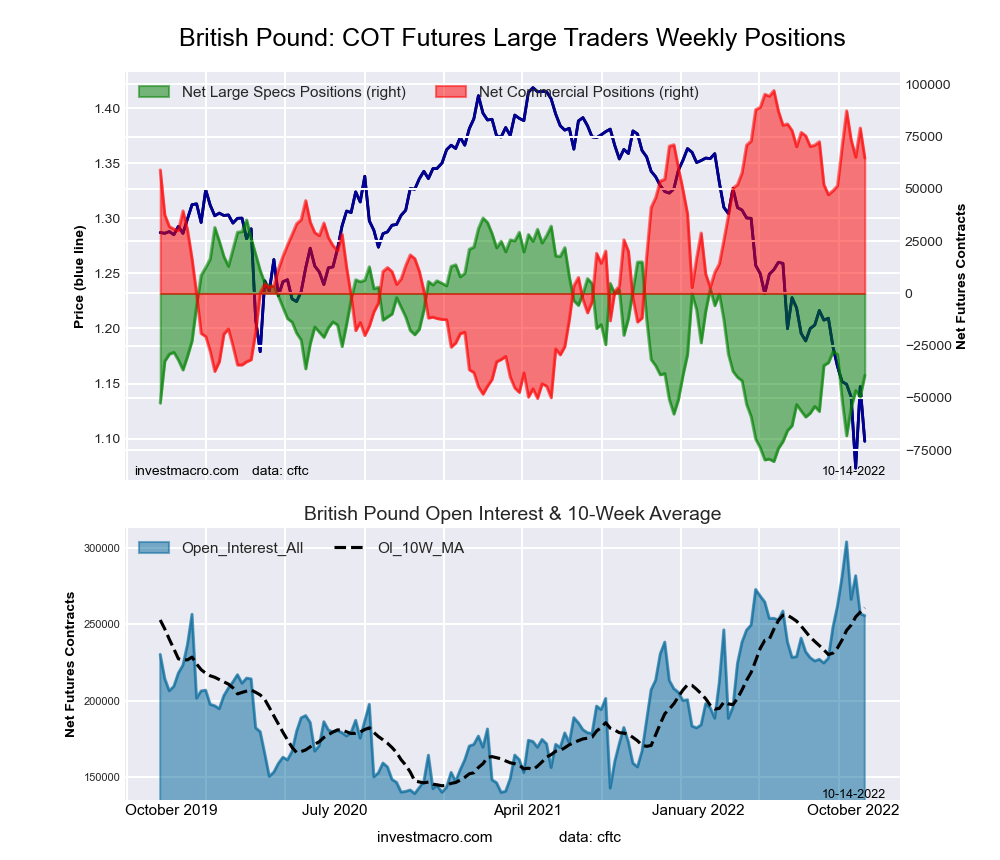
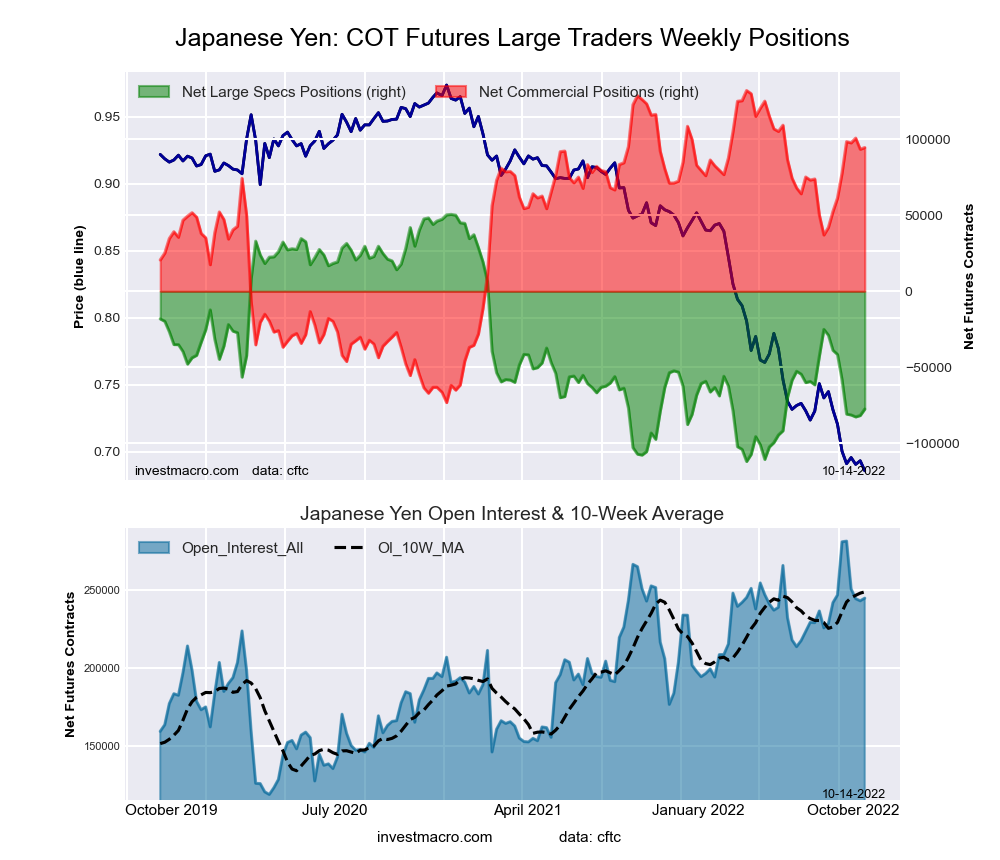
Speculator contracts are usually trend-following and stay relatively in lock-step with prices. The current unusual situation in the Euro contracts can be contrasted with other major currencies at the moment. The British pound sterling net positions are currently at -49,539 contracts while its currency is at similar multi-decade lows and the Japanese yen speculator level is at -81,623 contracts while its currency is also near its own 25-year lows.
The European economic situation seems to be as uncertain as the UK (recession?) and the Japanese (low interest rates) situations with an energy crisis potentially looming and a recession on the horizon. However, speculators are feeling differently at the moment.
Meanwhile in the markets, the EURUSD exchange rate remained below parity this week and fell modestly by less than -1.00 percent, closing out the week at the 0.9742 exchange rate.
| Oct-04-2022 | OI | OI-Index | Spec-Net | Spec-Index | Com-Net | COM-Index | Smalls-Net | Smalls-Index |
|---|
| USD Index | 54,638 | 77 | 31,697 | 78 | -36,817 | 17 | 5,120 | 73 |
| EUR | 640,458 | 55 | 43,682 | 48 | -56,848 | 60 | 13,166 | 0 |
| GBP | 256,906 | 71 | -49,539 | 26 | 79,116 | 88 | -29,577 | 0 |
| JPY | 243,289 | 76 | -81,623 | 19 | 93,324 | 81 | -11,701 | 30 |
| CHF | 43,121 | 27 | -6,852 | 39 | 16,022 | 69 | -9,170 | 26 |
| CAD | 141,799 | 25 | -21,407 | 15 | 17,947 | 84 | 3,460 | 37 |
| AUD | 139,490 | 37 | -27,764 | 59 | 38,804 | 48 | -11,040 | 26 |
| NZD | 48,487 | 41 | -13,978 | 46 | 17,259 | 59 | -3,281 | 14 |
| MXN | 192,352 | 46 | -37,321 | 11 | 31,914 | 86 | 5,407 | 66 |
| RUB | 20,930 | 4 | 7,543 | 31 | -7,150 | 69 | -393 | 24 |
| BRL | 39,984 | 27 | 25,779 | 76 | -27,570 | 24 | 1,791 | 86 |
| Bitcoin | 14,230 | 82 | -32 | 76 | -421 | 0 | 453 | 23 |
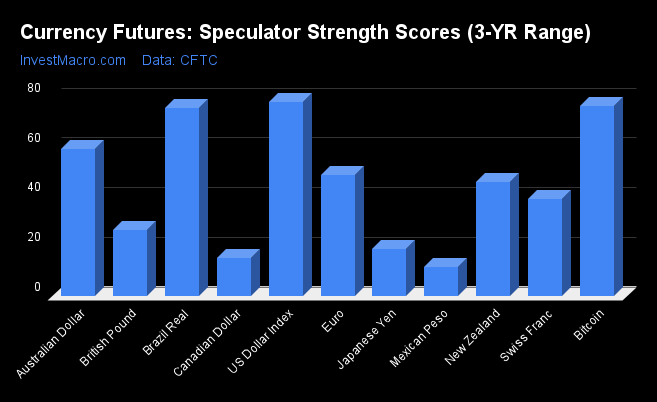
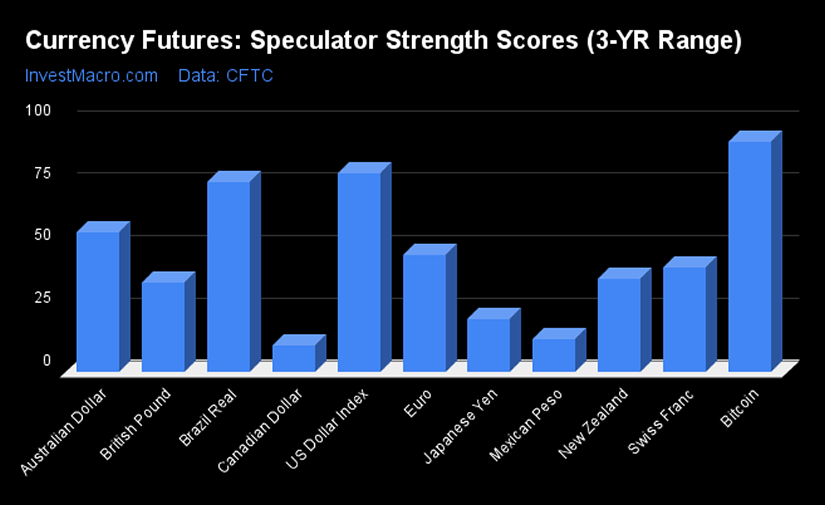
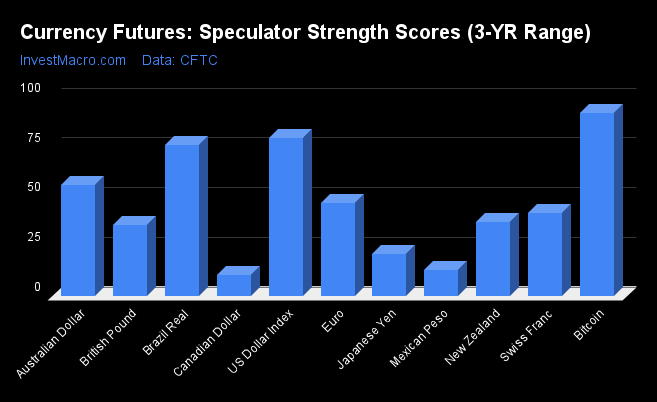
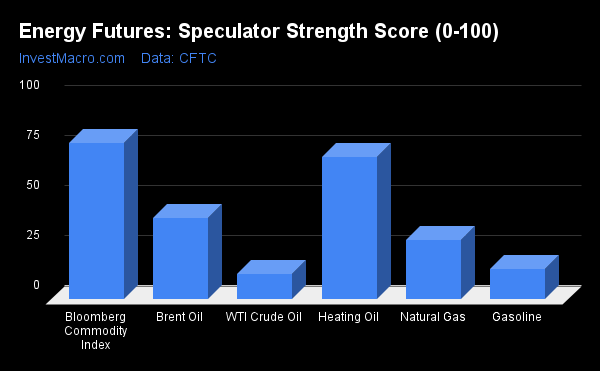
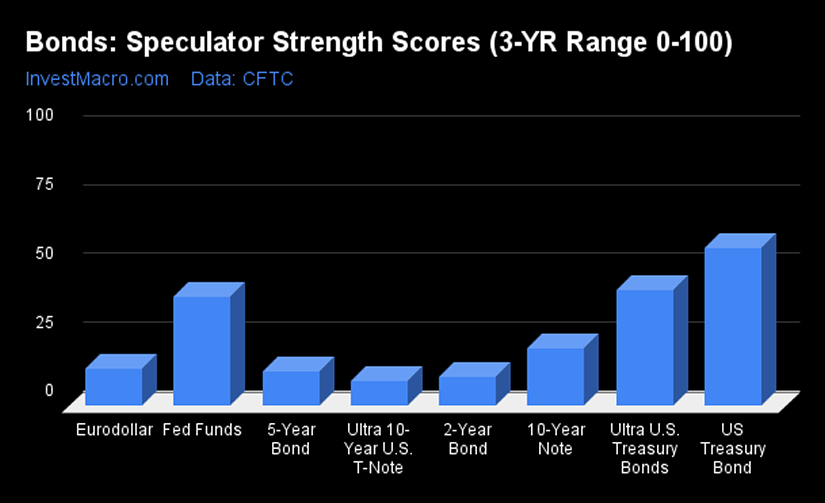
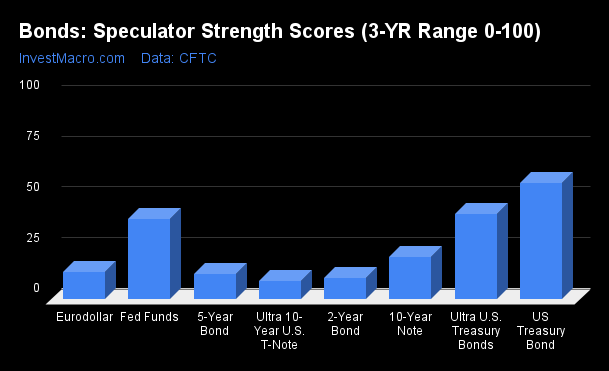
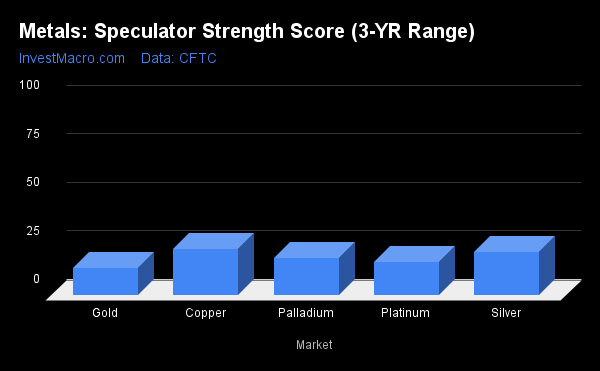
US Dollar Index (77.8 percent) leads Strength Scores
Strength Scores (a normalized measure of Speculator positions over a 3-Year range, from 0 to 100 where above 80 is extreme bullish and below 20 is extreme bearish) showed that the US Dollar Index (77.8 percent) is back in the lead for the currency markets scores. Bitcoin (76.4 percent) and the Brazilian Real (75.7 percent) come in as the next highest in the currency markets in strength scores.
On the downside, the Mexican Peso (11.4 percent), Canadian Dollar (15.3 percent) and the Japanese Yen (18.6 percent) come in at the lowest strength level currently. All three of these markets are in bearish extreme positions with scores under the 20 percent level.
Strength Statistics:
US Dollar Index (77.8 percent) vs US Dollar Index previous week (75.9 percent)
EuroFX (48.4 percent) vs EuroFX previous week (45.4 percent)
British Pound Sterling (26.5 percent) vs British Pound Sterling previous week (29.2 percent)
Japanese Yen (18.6 percent) vs Japanese Yen previous week (18.0 percent)
Swiss Franc (39.1 percent) vs Swiss Franc previous week (42.0 percent)
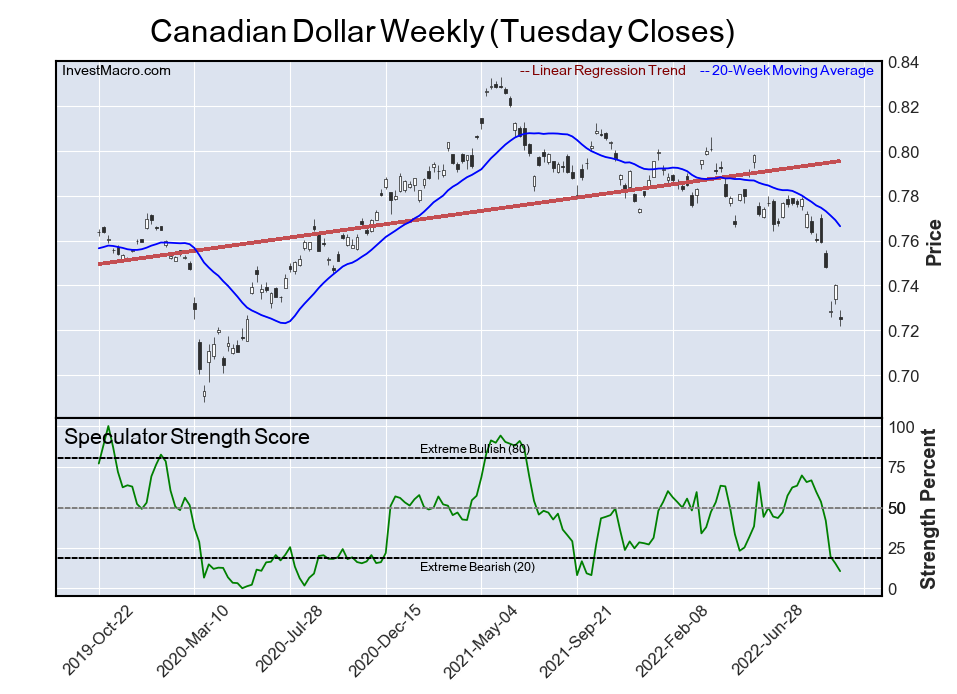
Canadian Dollar (15.3 percent) vs Canadian Dollar previous week (19.5 percent)
Australian Dollar (59.1 percent) vs Australian Dollar previous week (52.7 percent)
New Zealand Dollar (45.9 percent) vs New Zealand Dollar previous week (50.3 percent)
Mexican Peso (11.4 percent) vs Mexican Peso previous week (9.7 percent)
Brazilian Real (75.7 percent) vs Brazilian Real previous week (83.6 percent)
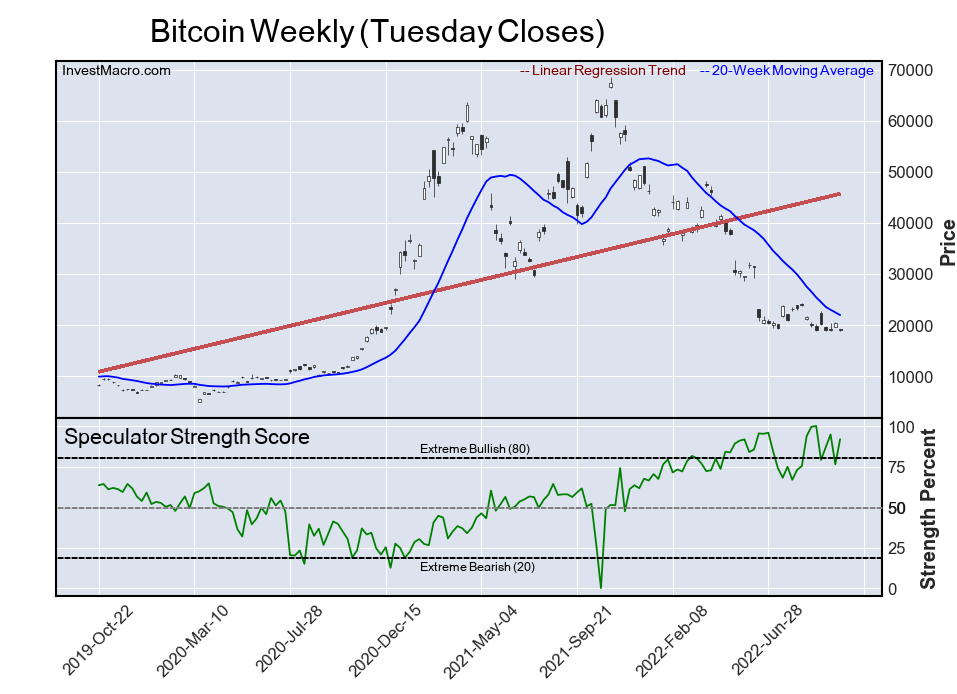
Bitcoin (76.4 percent) vs Bitcoin previous week (94.8 percent)
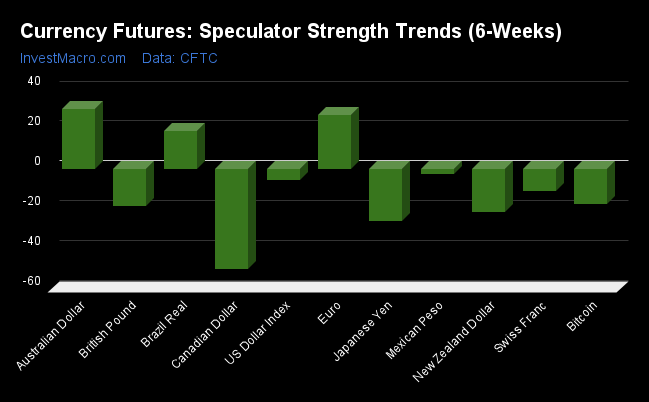
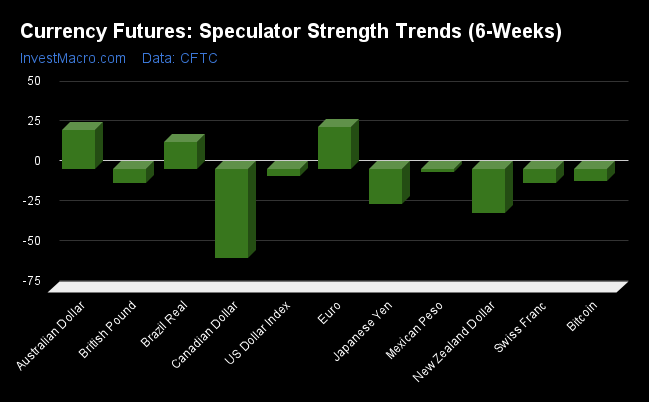
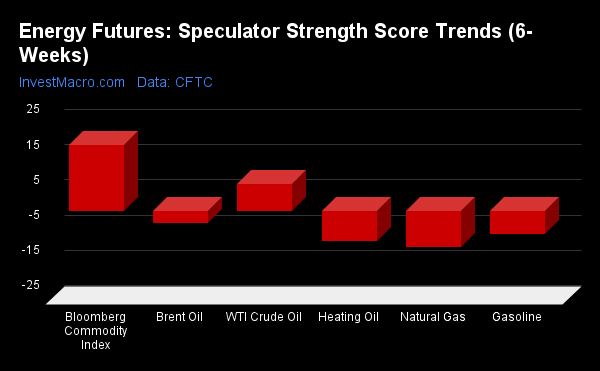
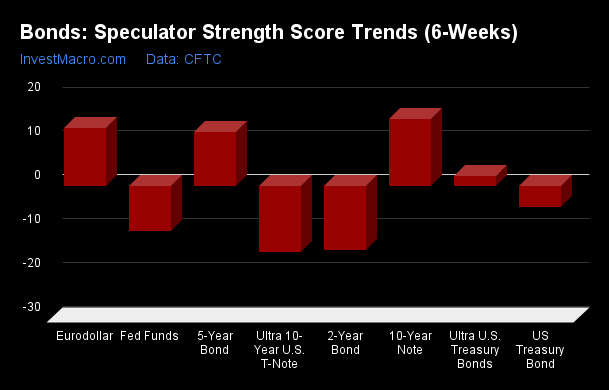
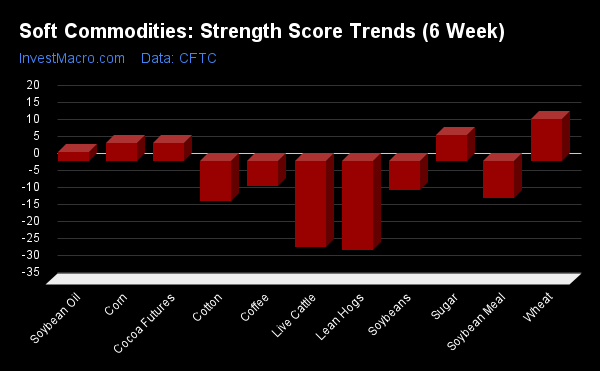
Australian Dollar (29.9 percent) leads Strength Trends
Strength Score Trends (or move index, calculates the 6-week changes in strength scores) show that the Australian Dollar (29.9 percent) leads the past six weeks trends for the currency markets this week. The EuroFX (26.9 percent) and the Brazilian Real (19.1 percent) fill out the rest of the positive movers in the latest trends data.
The Canadian Dollar (-50.1 percent) leads the downside trend scores currently while the next markets with lower trend scores were the Japanese Yen (-26.4 percent), New Zealand Dollar (-21.7 percent) and the British Pound Sterling (-18.5 percent).
Strength Trend Statistics:
US Dollar Index (-5.7 percent) vs US Dollar Index previous week (-12.3 percent)
EuroFX (26.9 percent) vs EuroFX previous week (23.5 percent)
British Pound Sterling (-18.5 percent) vs British Pound Sterling previous week (-11.4 percent)
Japanese Yen (-26.4 percent) vs Japanese Yen previous week (-33.1 percent)
Swiss Franc (-11.3 percent) vs Swiss Franc previous week (-1.6 percent)
Canadian Dollar (-50.1 percent) vs Canadian Dollar previous week (-50.0 percent)
Australian Dollar (29.9 percent) vs Australian Dollar previous week (22.8 percent)
New Zealand Dollar (-21.7 percent) vs New Zealand Dollar previous week (-23.0 percent)
Mexican Peso (-2.6 percent) vs Mexican Peso previous week (-8.5 percent)
Brazilian Real (19.1 percent) vs Brazilian Real previous week (26.8 percent)
Bitcoin (-17.4 percent) vs Bitcoin previous week (19.5 percent)
Individual COT Forex Markets:
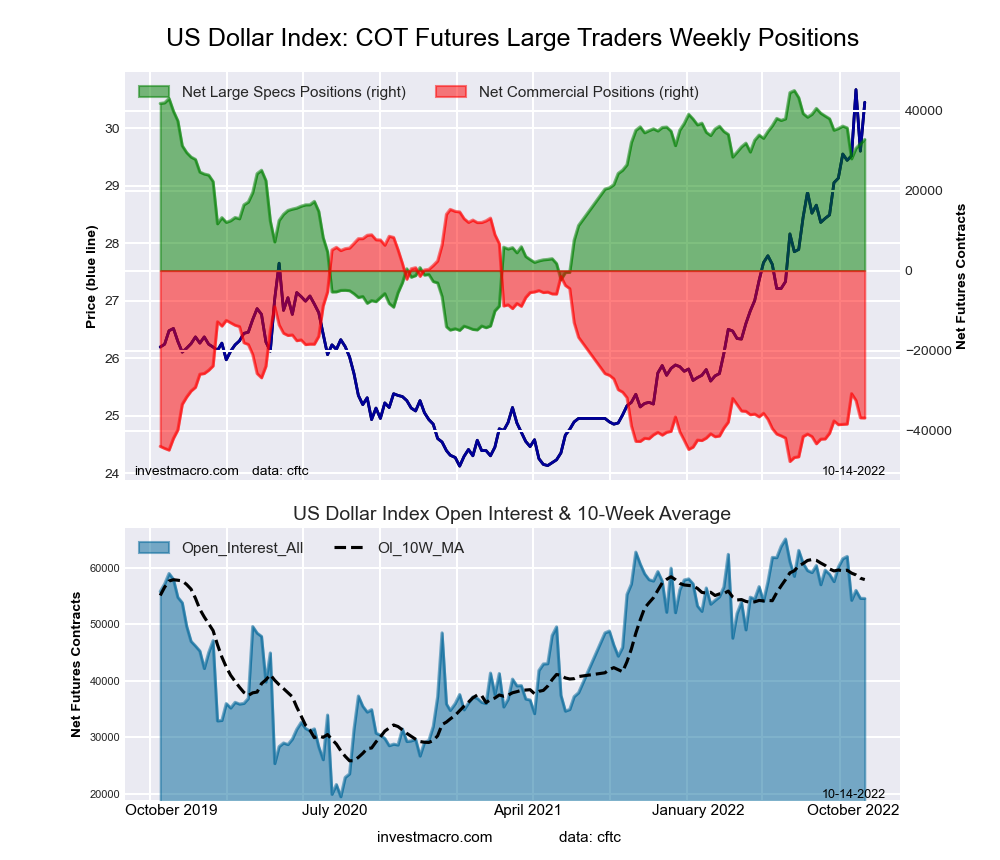
US Dollar Index Futures:
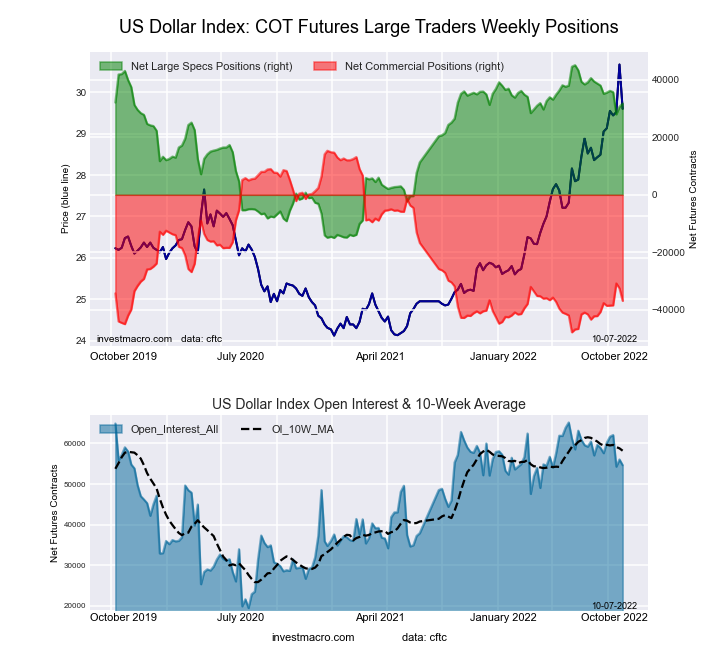 The US Dollar Index large speculator standing this week recorded a net position of 31,697 contracts in the data reported through Tuesday. This was a weekly boost of 1,135 contracts from the previous week which had a total of 30,562 net contracts.
This week’s current strength score (the trader positioning range over the past three years, measured from 0 to 100) shows the speculators are currently Bullish with a score of 77.8 percent. The commercials are Bearish-Extreme with a score of 17.3 percent and the small traders (not shown in chart) are Bullish with a score of 72.5 percent.
| US DOLLAR INDEX Statistics | SPECULATORS | COMMERCIALS | SMALL TRADERS |
| – Percent of Open Interest Longs: | 81.4 | 3.5 | 13.0 |
| – Percent of Open Interest Shorts: | 23.3 | 70.9 | 3.7 |
| – Net Position: | 31,697 | -36,817 | 5,120 |
| – Gross Longs: | 44,449 | 1,926 | 7,123 |
| – Gross Shorts: | 12,752 | 38,743 | 2,003 |
| – Long to Short Ratio: | 3.5 to 1 | 0.0 to 1 | 3.6 to 1 |
| NET POSITION TREND: | | | |
| – Strength Index Score (3 Year Range Pct): | 77.8 | 17.3 | 72.5 |
| – Strength Index Reading (3 Year Range): | Bullish | Bearish-Extreme | Bullish |
| NET POSITION MOVEMENT INDEX: | | | |
| – 6-Week Change in Strength Index: | -5.7 | 1.2 | 28.7 |
Euro Currency Futures:
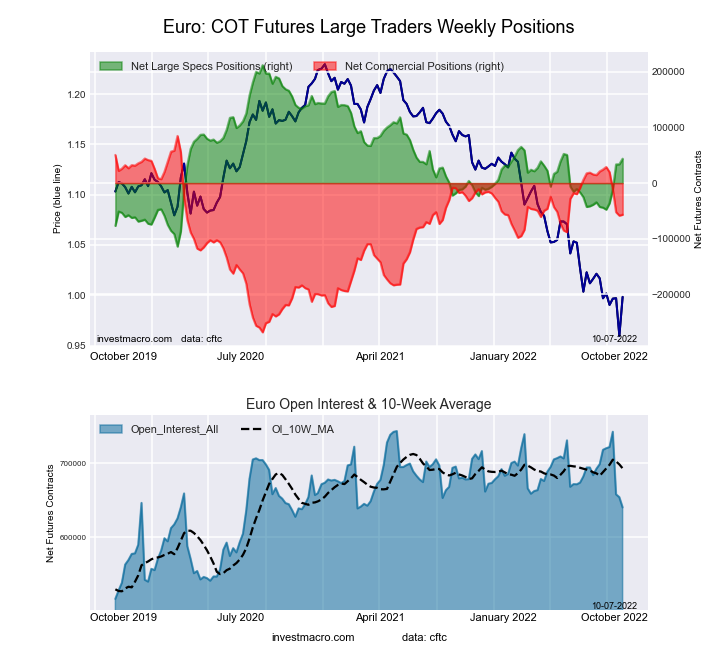 The Euro Currency large speculator standing this week recorded a net position of 43,682 contracts in the data reported through Tuesday. This was a weekly rise of 9,885 contracts from the previous week which had a total of 33,797 net contracts.
This week’s current strength score (the trader positioning range over the past three years, measured from 0 to 100) shows the speculators are currently Bearish with a score of 48.4 percent. The commercials are Bullish with a score of 59.9 percent and the small traders (not shown in chart) are Bearish-Extreme with a score of 0.0 percent.
| EURO Currency Statistics | SPECULATORS | COMMERCIALS | SMALL TRADERS |
| – Percent of Open Interest Longs: | 31.1 | 54.5 | 11.6 |
| – Percent of Open Interest Shorts: | 24.3 | 63.3 | 9.5 |
| – Net Position: | 43,682 | -56,848 | 13,166 |
| – Gross Longs: | 199,391 | 348,817 | 74,175 |
| – Gross Shorts: | 155,709 | 405,665 | 61,009 |
| – Long to Short Ratio: | 1.3 to 1 | 0.9 to 1 | 1.2 to 1 |
| NET POSITION TREND: | | | |
| – Strength Index Score (3 Year Range Pct): | 48.4 | 59.9 | 0.0 |
| – Strength Index Reading (3 Year Range): | Bearish | Bullish | Bearish-Extreme |
| NET POSITION MOVEMENT INDEX: | | | |
| – 6-Week Change in Strength Index: | 26.9 | -23.0 | -10.6 |
British Pound Sterling Futures:
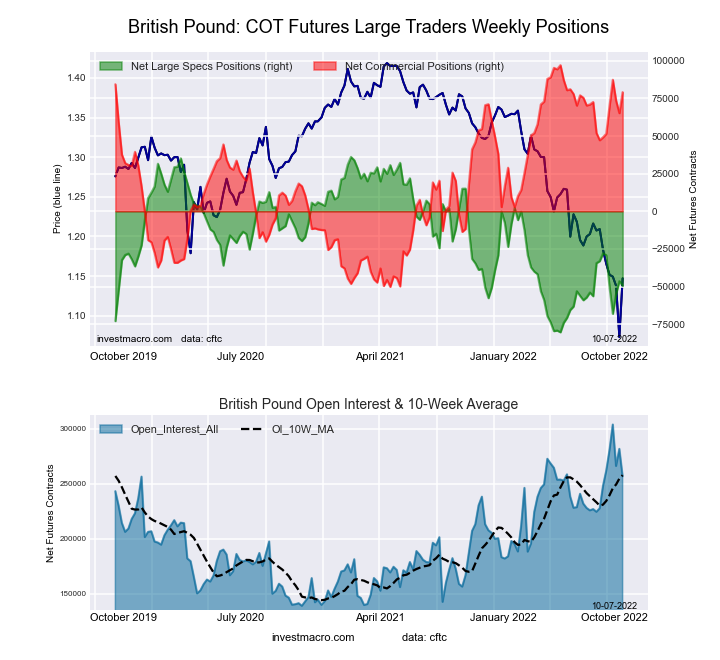 The British Pound Sterling large speculator standing this week recorded a net position of -49,539 contracts in the data reported through Tuesday. This was a weekly decline of -3,115 contracts from the previous week which had a total of -46,424 net contracts.
This week’s current strength score (the trader positioning range over the past three years, measured from 0 to 100) shows the speculators are currently Bearish with a score of 26.5 percent. The commercials are Bullish-Extreme with a score of 87.8 percent and the small traders (not shown in chart) are Bearish-Extreme with a score of 0.0 percent.
| BRITISH POUND Statistics | SPECULATORS | COMMERCIALS | SMALL TRADERS |
| – Percent of Open Interest Longs: | 16.4 | 74.7 | 6.4 |
| – Percent of Open Interest Shorts: | 35.7 | 43.9 | 17.9 |
| – Net Position: | -49,539 | 79,116 | -29,577 |
| – Gross Longs: | 42,078 | 191,819 | 16,367 |
| – Gross Shorts: | 91,617 | 112,703 | 45,944 |
| – Long to Short Ratio: | 0.5 to 1 | 1.7 to 1 | 0.4 to 1 |
| NET POSITION TREND: | | | |
| – Strength Index Score (3 Year Range Pct): | 26.5 | 87.8 | 0.0 |
| – Strength Index Reading (3 Year Range): | Bearish | Bullish-Extreme | Bearish-Extreme |
| NET POSITION MOVEMENT INDEX: | | | |
| – 6-Week Change in Strength Index: | -18.5 | 20.3 | -16.4 |
Japanese Yen Futures:
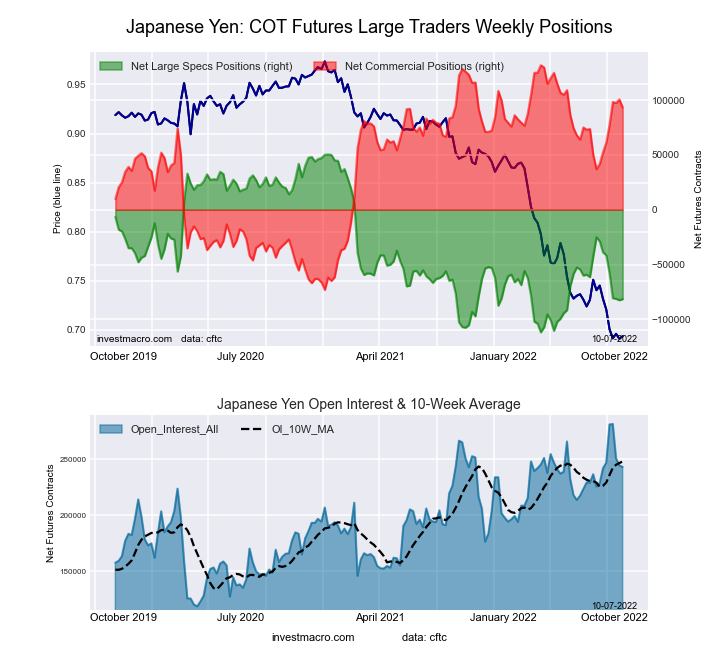 The Japanese Yen large speculator standing this week recorded a net position of -81,623 contracts in the data reported through Tuesday. This was a weekly rise of 933 contracts from the previous week which had a total of -82,556 net contracts.
This week’s current strength score (the trader positioning range over the past three years, measured from 0 to 100) shows the speculators are currently Bearish-Extreme with a score of 18.6 percent. The commercials are Bullish-Extreme with a score of 81.2 percent and the small traders (not shown in chart) are Bearish with a score of 29.7 percent.
| JAPANESE YEN Statistics | SPECULATORS | COMMERCIALS | SMALL TRADERS |
| – Percent of Open Interest Longs: | 11.1 | 76.3 | 11.0 |
| – Percent of Open Interest Shorts: | 44.6 | 38.0 | 15.8 |
| – Net Position: | -81,623 | 93,324 | -11,701 |
| – Gross Longs: | 26,962 | 185,691 | 26,766 |
| – Gross Shorts: | 108,585 | 92,367 | 38,467 |
| – Long to Short Ratio: | 0.2 to 1 | 2.0 to 1 | 0.7 to 1 |
| NET POSITION TREND: | | | |
| – Strength Index Score (3 Year Range Pct): | 18.6 | 81.2 | 29.7 |
| – Strength Index Reading (3 Year Range): | Bearish-Extreme | Bullish-Extreme | Bearish |
| NET POSITION MOVEMENT INDEX: | | | |
| – 6-Week Change in Strength Index: | -26.4 | 19.9 | 4.0 |
Swiss Franc Futures:
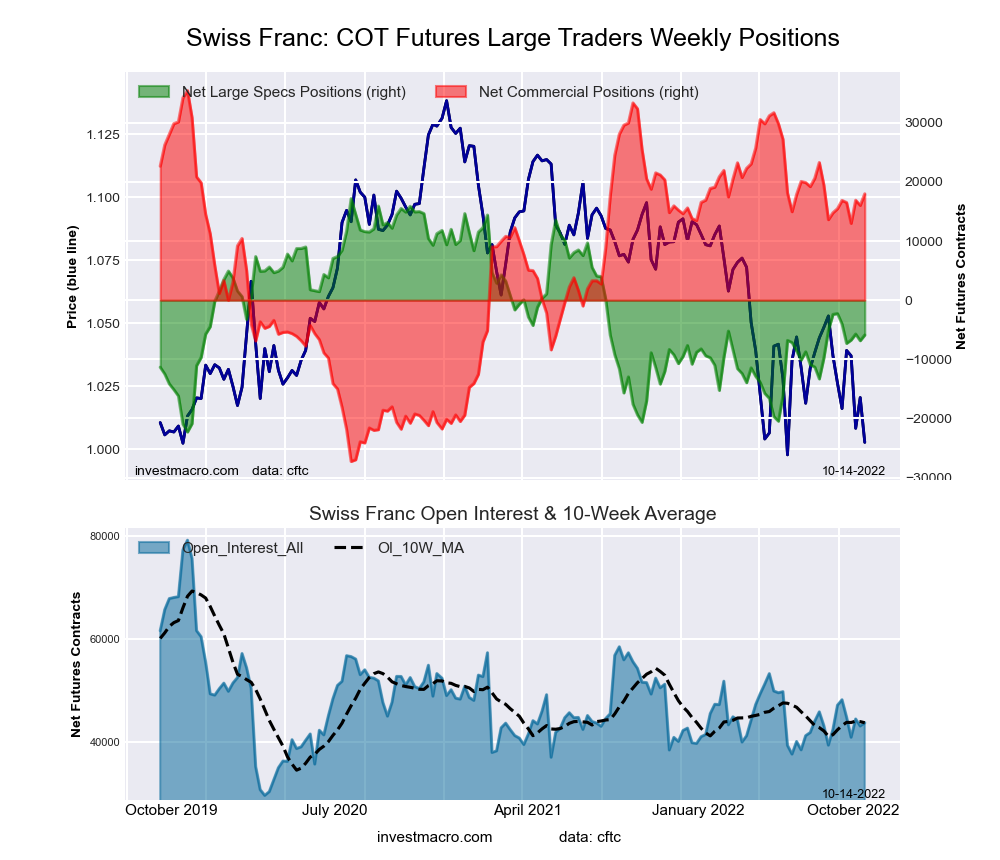
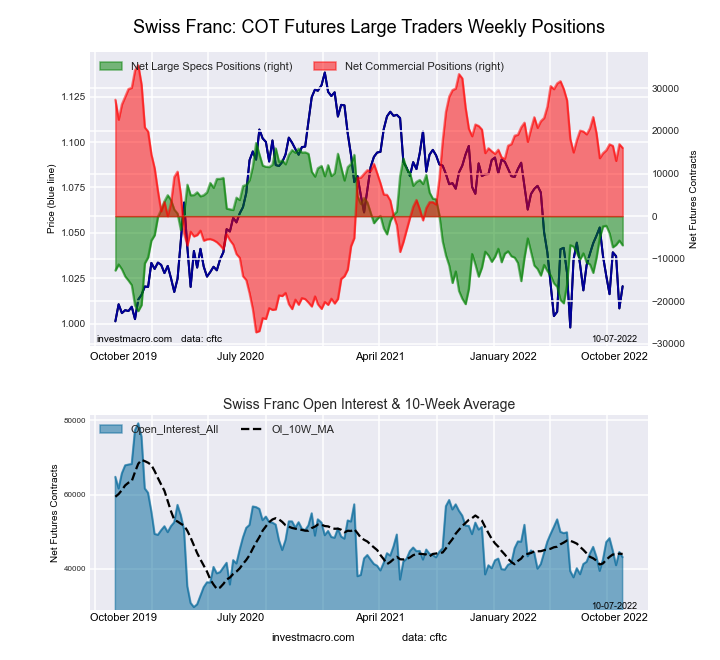 The Swiss Franc large speculator standing this week recorded a net position of -6,852 contracts in the data reported through Tuesday. This was a weekly lowering of -1,122 contracts from the previous week which had a total of -5,730 net contracts.
This week’s current strength score (the trader positioning range over the past three years, measured from 0 to 100) shows the speculators are currently Bearish with a score of 39.1 percent. The commercials are Bullish with a score of 69.0 percent and the small traders (not shown in chart) are Bearish with a score of 26.5 percent.
| SWISS FRANC Statistics | SPECULATORS | COMMERCIALS | SMALL TRADERS |
| – Percent of Open Interest Longs: | 18.1 | 60.6 | 21.2 |
| – Percent of Open Interest Shorts: | 34.0 | 23.5 | 42.4 |
| – Net Position: | -6,852 | 16,022 | -9,170 |
| – Gross Longs: | 7,816 | 26,140 | 9,128 |
| – Gross Shorts: | 14,668 | 10,118 | 18,298 |
| – Long to Short Ratio: | 0.5 to 1 | 2.6 to 1 | 0.5 to 1 |
| NET POSITION TREND: | | | |
| – Strength Index Score (3 Year Range Pct): | 39.1 | 69.0 | 26.5 |
| – Strength Index Reading (3 Year Range): | Bearish | Bullish | Bearish |
| NET POSITION MOVEMENT INDEX: | | | |
| – 6-Week Change in Strength Index: | -11.3 | 2.0 | 10.8 |
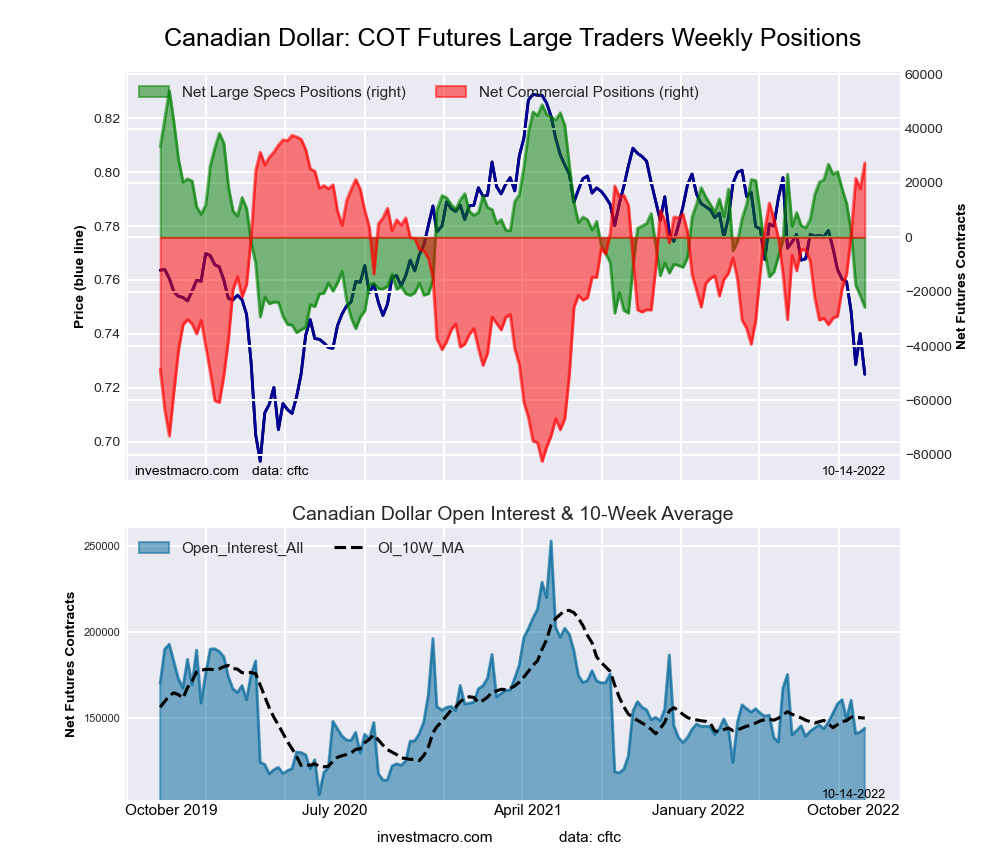
Canadian Dollar Futures:
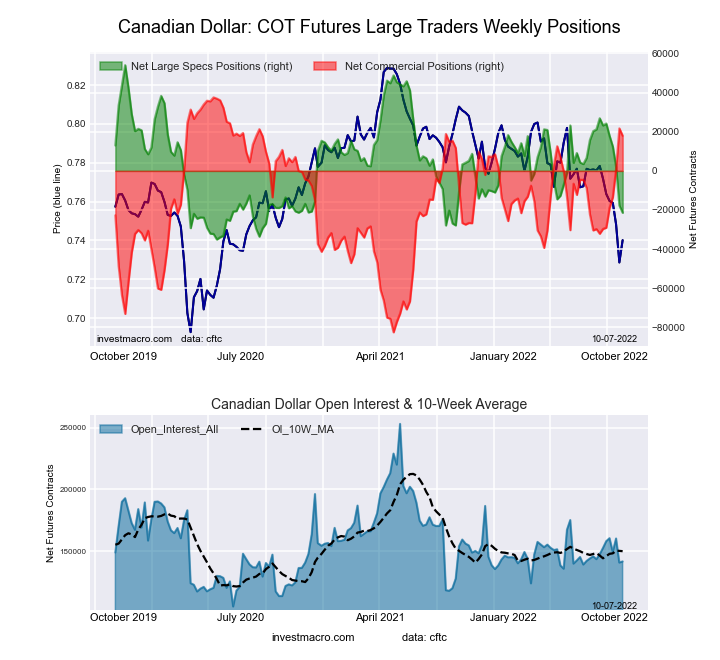 The Canadian Dollar large speculator standing this week recorded a net position of -21,407 contracts in the data reported through Tuesday. This was a weekly lowering of -3,741 contracts from the previous week which had a total of -17,666 net contracts.
This week’s current strength score (the trader positioning range over the past three years, measured from 0 to 100) shows the speculators are currently Bearish-Extreme with a score of 15.3 percent. The commercials are Bullish-Extreme with a score of 83.7 percent and the small traders (not shown in chart) are Bearish with a score of 37.1 percent.
| CANADIAN DOLLAR Statistics | SPECULATORS | COMMERCIALS | SMALL TRADERS |
| – Percent of Open Interest Longs: | 25.6 | 49.8 | 23.3 |
| – Percent of Open Interest Shorts: | 40.7 | 37.1 | 20.8 |
| – Net Position: | -21,407 | 17,947 | 3,460 |
| – Gross Longs: | 36,246 | 70,624 | 33,001 |
| – Gross Shorts: | 57,653 | 52,677 | 29,541 |
| – Long to Short Ratio: | 0.6 to 1 | 1.3 to 1 | 1.1 to 1 |
| NET POSITION TREND: | | | |
| – Strength Index Score (3 Year Range Pct): | 15.3 | 83.7 | 37.1 |
| – Strength Index Reading (3 Year Range): | Bearish-Extreme | Bullish-Extreme | Bearish |
| NET POSITION MOVEMENT INDEX: | | | |
| – 6-Week Change in Strength Index: | -50.1 | 39.7 | -6.0 |
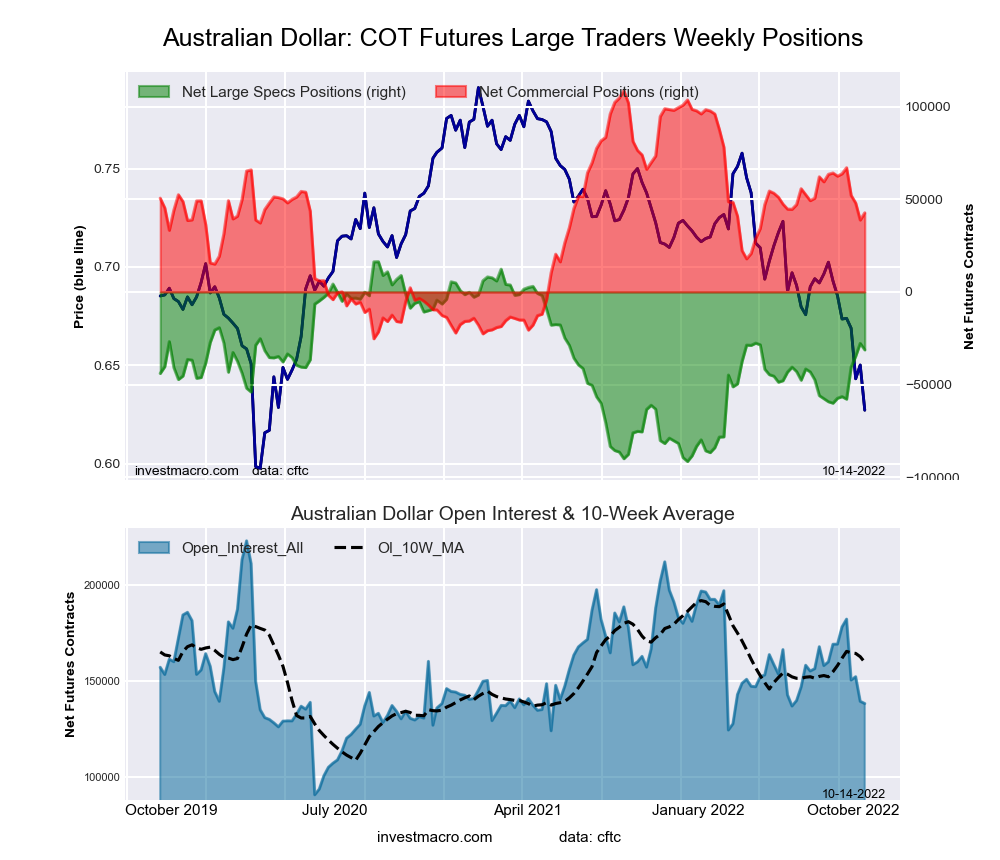
Australian Dollar Futures:
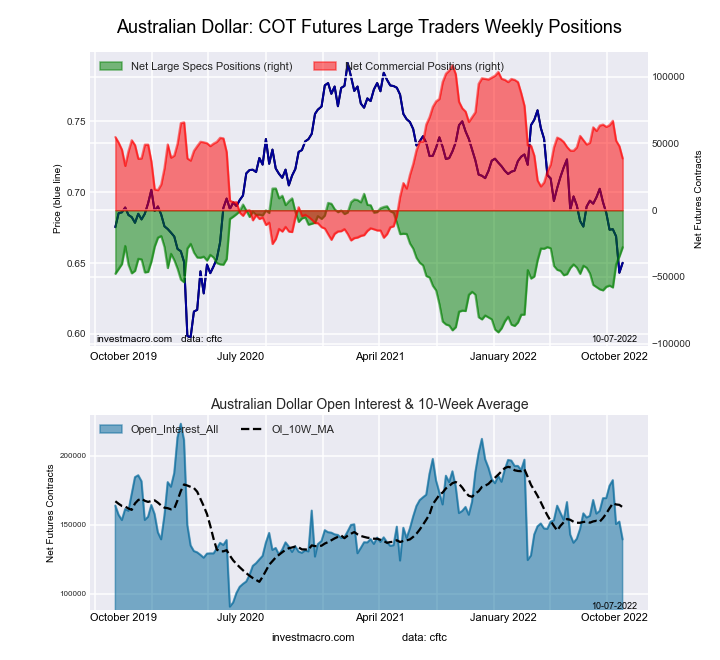 The Australian Dollar large speculator standing this week recorded a net position of -27,764 contracts in the data reported through Tuesday. This was a weekly advance of 6,889 contracts from the previous week which had a total of -34,653 net contracts.
This week’s current strength score (the trader positioning range over the past three years, measured from 0 to 100) shows the speculators are currently Bullish with a score of 59.1 percent. The commercials are Bearish with a score of 47.8 percent and the small traders (not shown in chart) are Bearish with a score of 25.5 percent.
| AUSTRALIAN DOLLAR Statistics | SPECULATORS | COMMERCIALS | SMALL TRADERS |
| – Percent of Open Interest Longs: | 26.0 | 58.8 | 12.1 |
| – Percent of Open Interest Shorts: | 45.9 | 31.0 | 20.0 |
| – Net Position: | -27,764 | 38,804 | -11,040 |
| – Gross Longs: | 36,248 | 82,080 | 16,813 |
| – Gross Shorts: | 64,012 | 43,276 | 27,853 |
| – Long to Short Ratio: | 0.6 to 1 | 1.9 to 1 | 0.6 to 1 |
| NET POSITION TREND: | | | |
| – Strength Index Score (3 Year Range Pct): | 59.1 | 47.8 | 25.5 |
| – Strength Index Reading (3 Year Range): | Bullish | Bearish | Bearish |
| NET POSITION MOVEMENT INDEX: | | | |
| – 6-Week Change in Strength Index: | 29.9 | -18.9 | -16.8 |
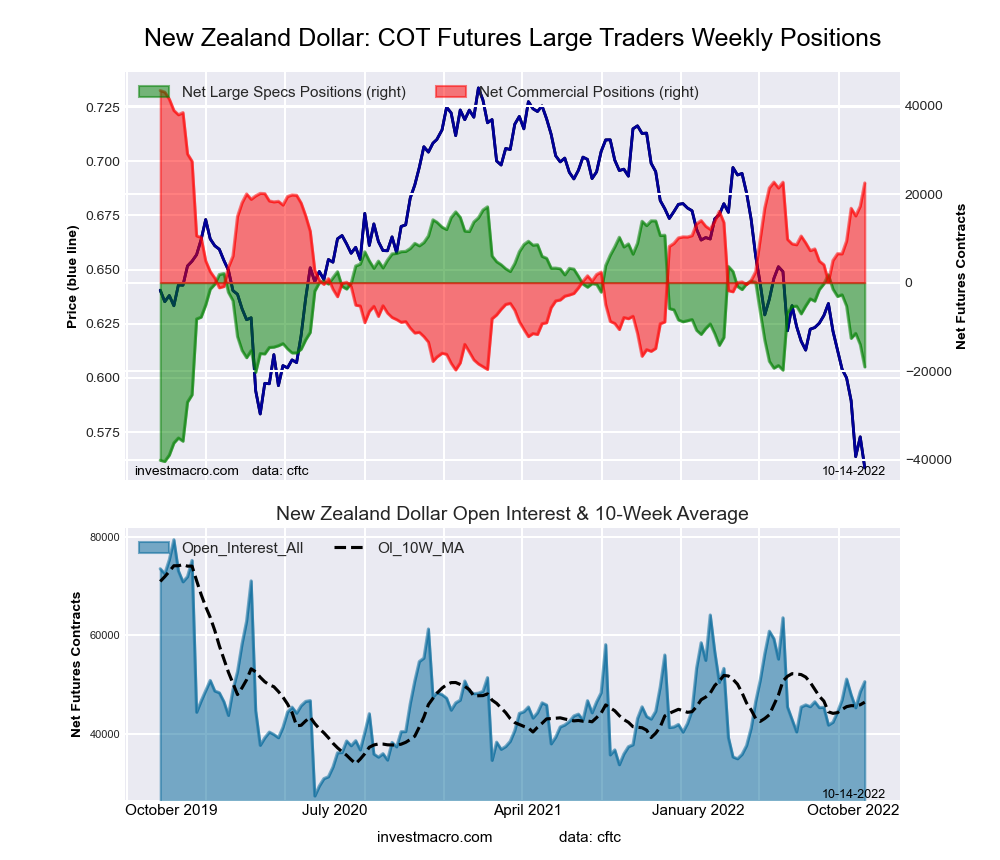
New Zealand Dollar Futures:
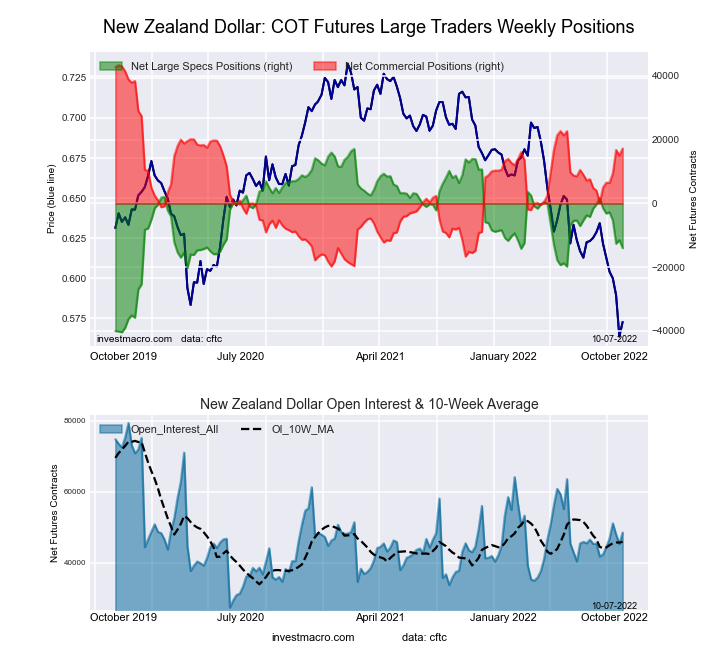 The New Zealand Dollar large speculator standing this week recorded a net position of -13,978 contracts in the data reported through Tuesday. This was a weekly reduction of -2,507 contracts from the previous week which had a total of -11,471 net contracts.
This week’s current strength score (the trader positioning range over the past three years, measured from 0 to 100) shows the speculators are currently Bearish with a score of 45.9 percent. The commercials are Bullish with a score of 58.6 percent and the small traders (not shown in chart) are Bearish-Extreme with a score of 13.9 percent.
| NEW ZEALAND DOLLAR Statistics | SPECULATORS | COMMERCIALS | SMALL TRADERS |
| – Percent of Open Interest Longs: | 30.9 | 63.8 | 4.9 |
| – Percent of Open Interest Shorts: | 59.7 | 28.3 | 11.6 |
| – Net Position: | -13,978 | 17,259 | -3,281 |
| – Gross Longs: | 14,966 | 30,957 | 2,359 |
| – Gross Shorts: | 28,944 | 13,698 | 5,640 |
| – Long to Short Ratio: | 0.5 to 1 | 2.3 to 1 | 0.4 to 1 |
| NET POSITION TREND: | | | |
| – Strength Index Score (3 Year Range Pct): | 45.9 | 58.6 | 13.9 |
| – Strength Index Reading (3 Year Range): | Bearish | Bullish | Bearish-Extreme |
| NET POSITION MOVEMENT INDEX: | | | |
| – 6-Week Change in Strength Index: | -21.7 | 19.4 | 2.8 |
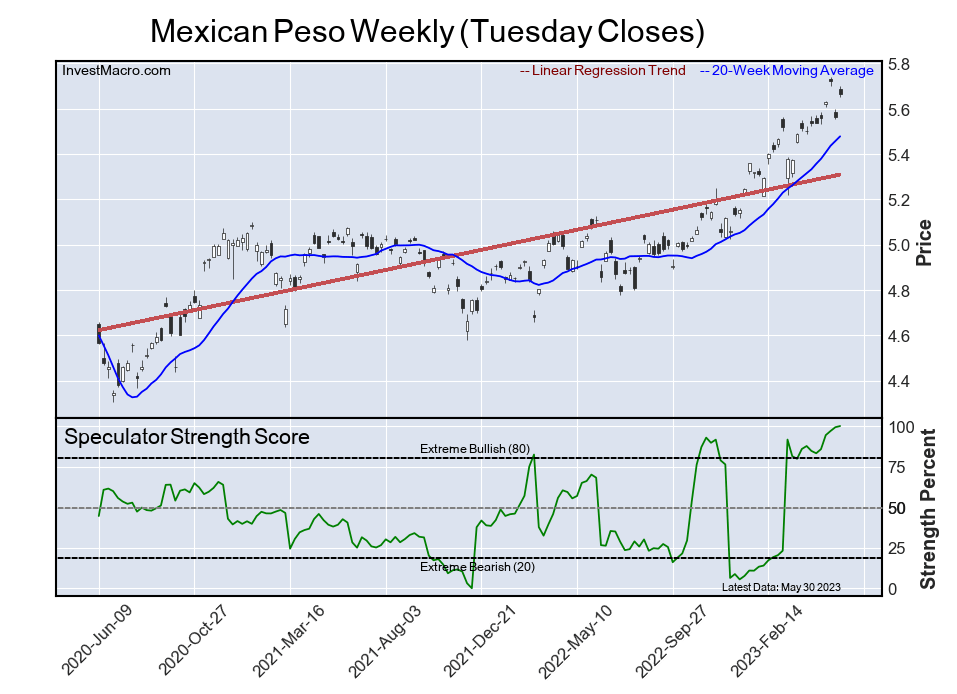
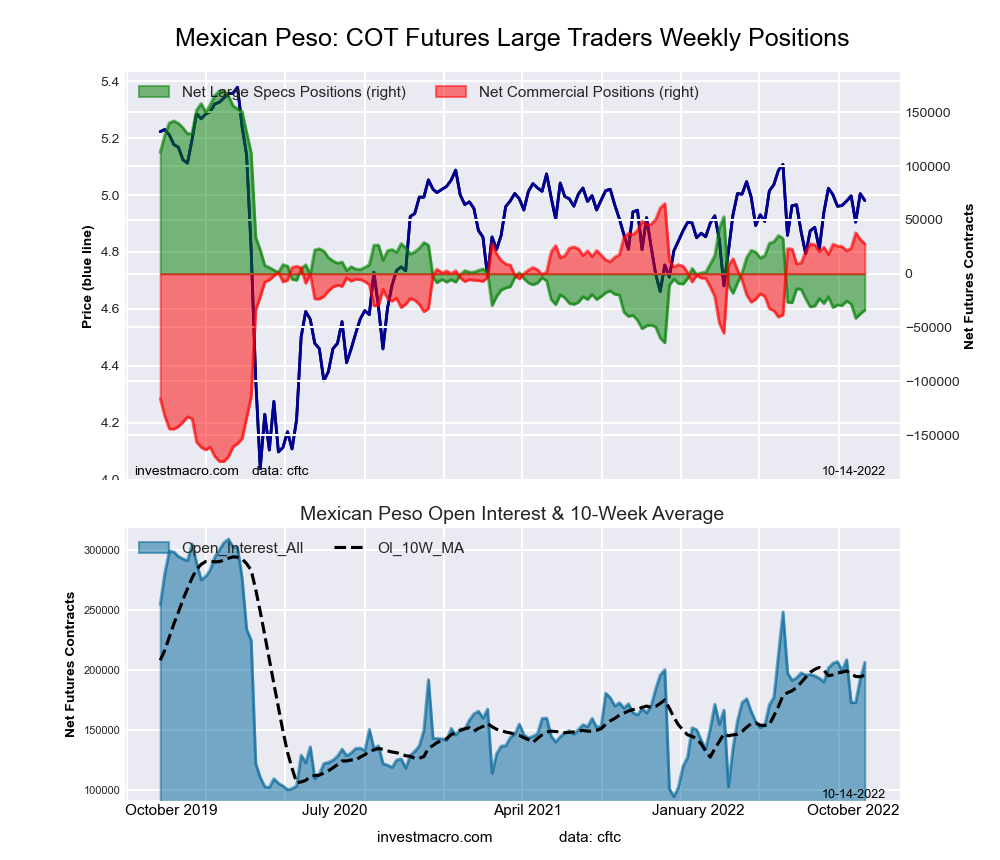
Mexican Peso Futures:
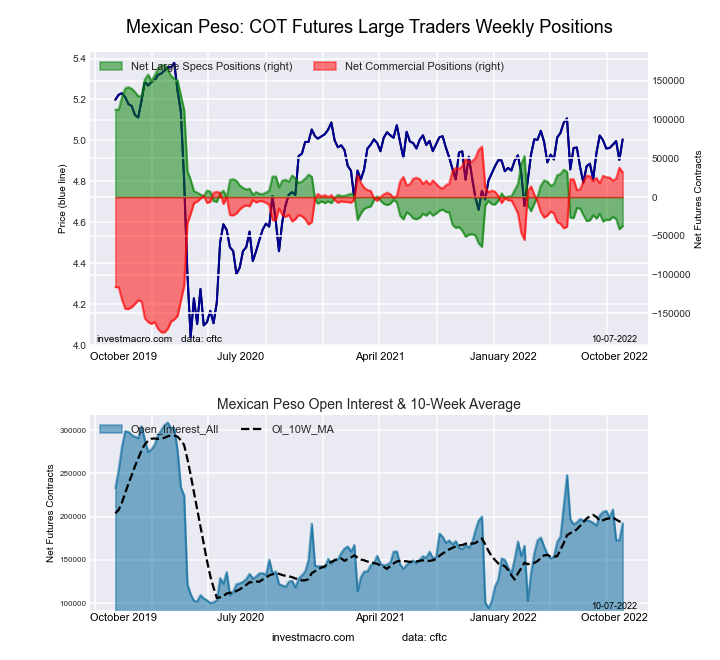 The Mexican Peso large speculator standing this week recorded a net position of -37,321 contracts in the data reported through Tuesday. This was a weekly gain of 4,001 contracts from the previous week which had a total of -41,322 net contracts.
This week’s current strength score (the trader positioning range over the past three years, measured from 0 to 100) shows the speculators are currently Bearish-Extreme with a score of 11.4 percent. The commercials are Bullish-Extreme with a score of 86.1 percent and the small traders (not shown in chart) are Bullish with a score of 65.9 percent.
| MEXICAN PESO Statistics | SPECULATORS | COMMERCIALS | SMALL TRADERS |
| – Percent of Open Interest Longs: | 56.5 | 39.3 | 4.1 |
| – Percent of Open Interest Shorts: | 75.9 | 22.7 | 1.3 |
| – Net Position: | -37,321 | 31,914 | 5,407 |
| – Gross Longs: | 108,626 | 75,648 | 7,916 |
| – Gross Shorts: | 145,947 | 43,734 | 2,509 |
| – Long to Short Ratio: | 0.7 to 1 | 1.7 to 1 | 3.2 to 1 |
| NET POSITION TREND: | | | |
| – Strength Index Score (3 Year Range Pct): | 11.4 | 86.1 | 65.9 |
| – Strength Index Reading (3 Year Range): | Bearish-Extreme | Bullish-Extreme | Bullish |
| NET POSITION MOVEMENT INDEX: | | | |
| – 6-Week Change in Strength Index: | -2.6 | 1.8 | 6.7 |
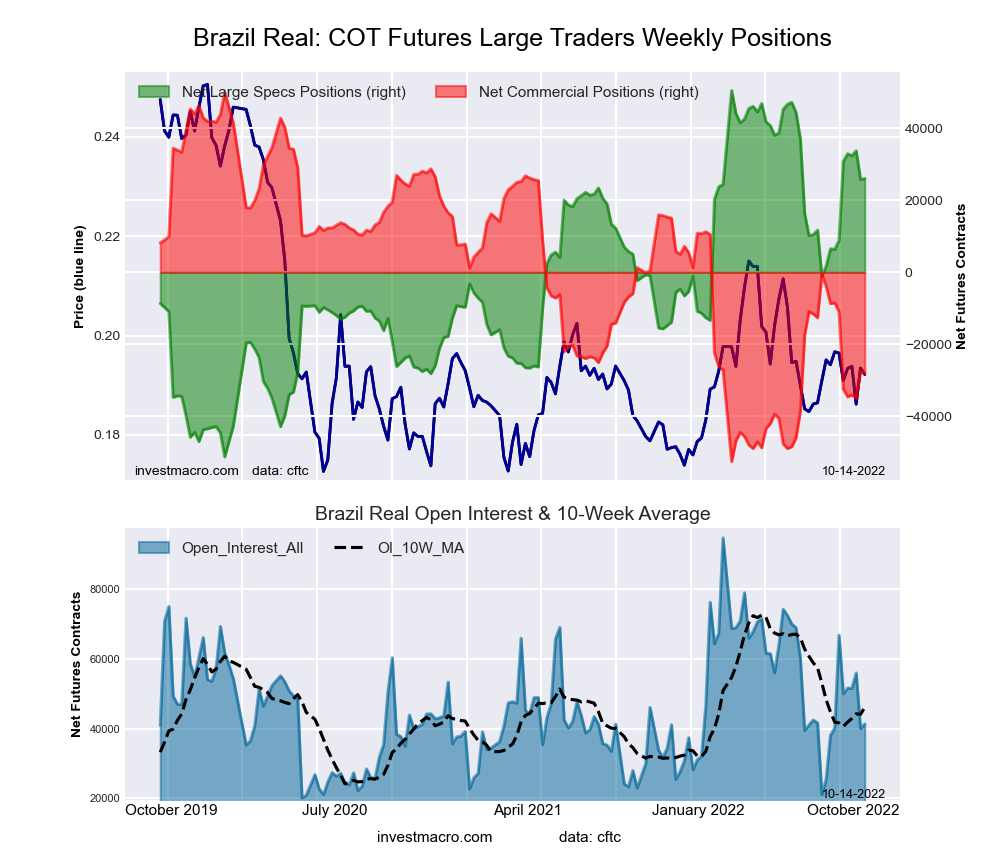
Brazilian Real Futures:
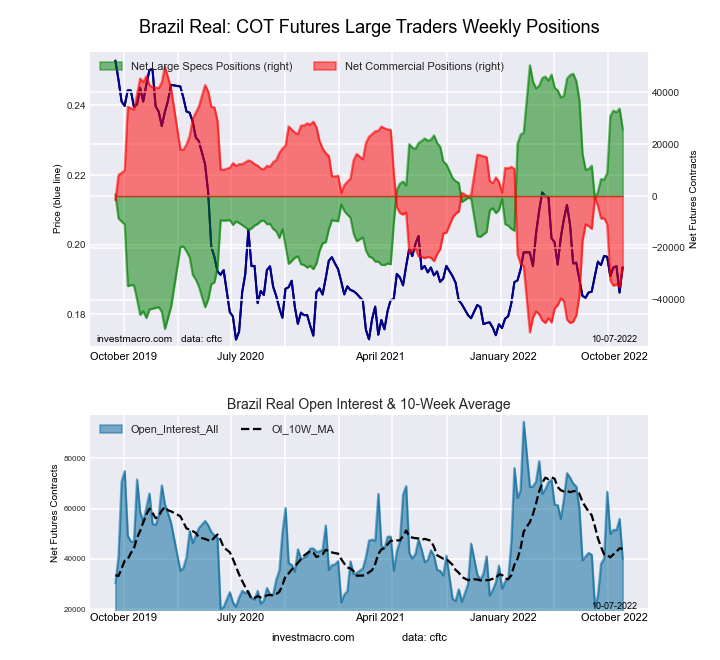 The Brazilian Real large speculator standing this week recorded a net position of 25,779 contracts in the data reported through Tuesday. This was a weekly lowering of -7,985 contracts from the previous week which had a total of 33,764 net contracts.
This week’s current strength score (the trader positioning range over the past three years, measured from 0 to 100) shows the speculators are currently Bullish with a score of 75.7 percent. The commercials are Bearish with a score of 24.4 percent and the small traders (not shown in chart) are Bullish-Extreme with a score of 85.8 percent.
| BRAZIL REAL Statistics | SPECULATORS | COMMERCIALS | SMALL TRADERS |
| – Percent of Open Interest Longs: | 72.3 | 19.8 | 7.3 |
| – Percent of Open Interest Shorts: | 7.8 | 88.8 | 2.9 |
| – Net Position: | 25,779 | -27,570 | 1,791 |
| – Gross Longs: | 28,894 | 7,920 | 2,935 |
| – Gross Shorts: | 3,115 | 35,490 | 1,144 |
| – Long to Short Ratio: | 9.3 to 1 | 0.2 to 1 | 2.6 to 1 |
| NET POSITION TREND: | | | |
| – Strength Index Score (3 Year Range Pct): | 75.7 | 24.4 | 85.8 |
| – Strength Index Reading (3 Year Range): | Bullish | Bearish | Bullish-Extreme |
| NET POSITION MOVEMENT INDEX: | | | |
| – 6-Week Change in Strength Index: | 19.1 | -18.6 | -4.0 |
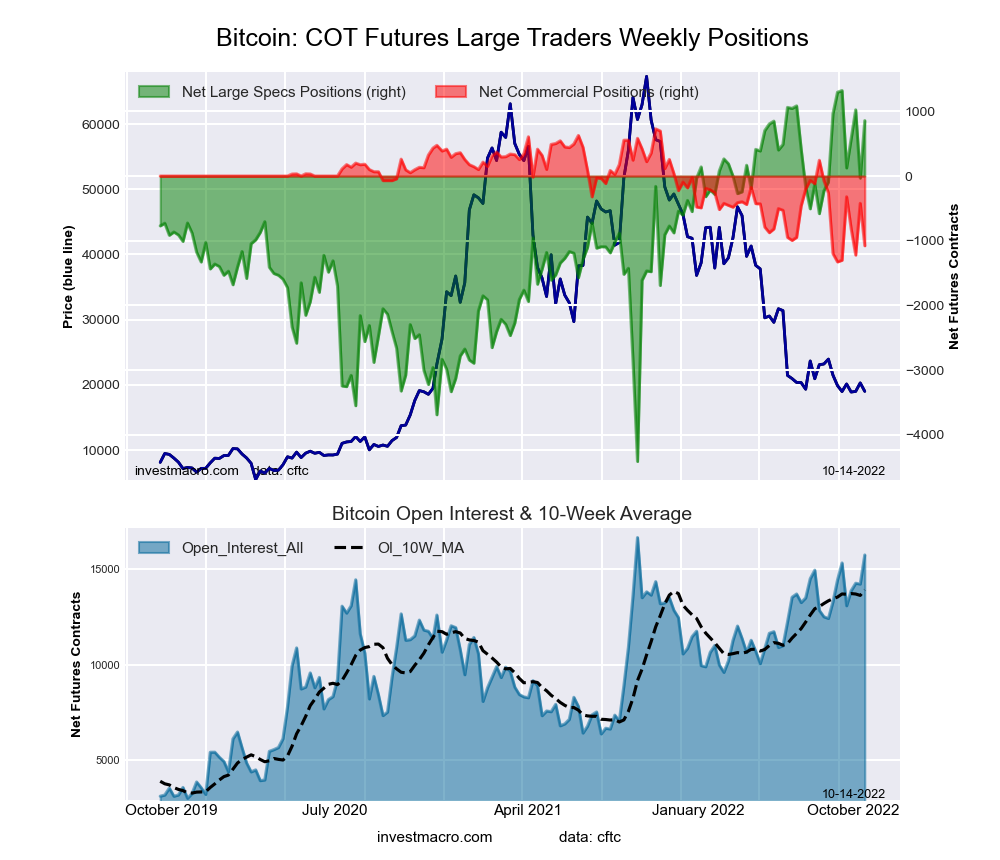
Bitcoin Futures:
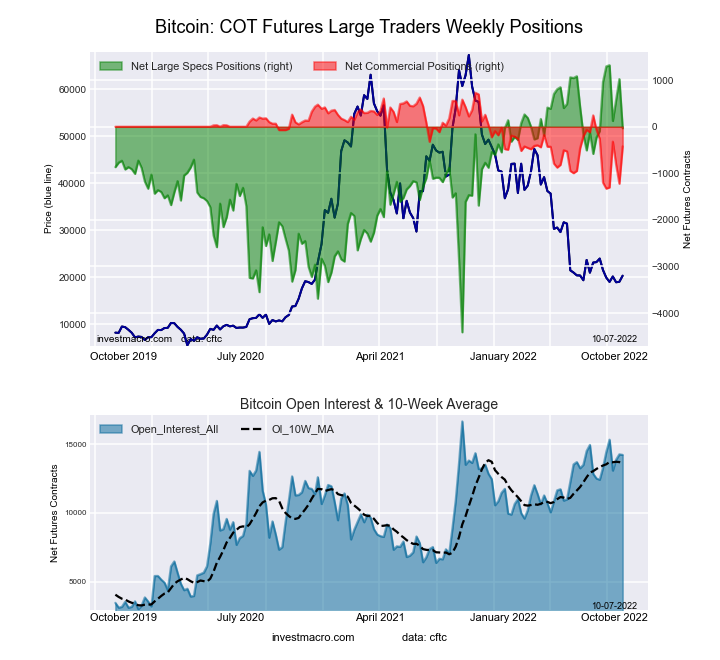 The Bitcoin large speculator standing this week recorded a net position of -32 contracts in the data reported through Tuesday. This was a weekly reduction of -1,056 contracts from the previous week which had a total of 1,024 net contracts.
This week’s current strength score (the trader positioning range over the past three years, measured from 0 to 100) shows the speculators are currently Bullish with a score of 76.4 percent. The commercials are Bearish with a score of 44.1 percent and the small traders (not shown in chart) are Bearish with a score of 23.2 percent.
| BITCOIN Statistics | SPECULATORS | COMMERCIALS | SMALL TRADERS |
| – Percent of Open Interest Longs: | 80.7 | 2.6 | 9.1 |
| – Percent of Open Interest Shorts: | 80.9 | 5.5 | 5.9 |
| – Net Position: | -32 | -421 | 453 |
| – Gross Longs: | 11,481 | 363 | 1,291 |
| – Gross Shorts: | 11,513 | 784 | 838 |
| – Long to Short Ratio: | 1.0 to 1 | 0.5 to 1 | 1.5 to 1 |
| NET POSITION TREND: | | | |
| – Strength Index Score (3 Year Range Pct): | 76.4 | 44.1 | 23.2 |
| – Strength Index Reading (3 Year Range): | Bullish | Bearish | Bearish |
| NET POSITION MOVEMENT INDEX: | | | |
| – 6-Week Change in Strength Index: | -17.4 | 37.8 | 5.0 |
Article By InvestMacro – Receive our weekly COT Newsletter
*COT Report: The COT data, released weekly to the public each Friday, is updated through the most recent Tuesday (data is 3 days old) and shows a quick view of how large speculators or non-commercials (for-profit traders) were positioned in the futures markets.
The CFTC categorizes trader positions according to commercial hedgers (traders who use futures contracts for hedging as part of the business), non-commercials (large traders who speculate to realize trading profits) and nonreportable traders (usually small traders/speculators) as well as their open interest (contracts open in the market at time of reporting). See CFTC criteria here.


