By RoboForex Analytical Department
The USD/JPY pair entered a consolidation phase on Tuesday, following modest growth during the earlier two trading sessions. Today, the pair’s movements are centred around the 157.50 mark.
Despite these recovery attempts, the yen remains under pressure, with limited support for a sustained rebound. Comments from Ryozo Himino, Deputy Governor of the Bank of Japan (BoJ), did little to shift market sentiment. Himino indicated that the upcoming BoJ meeting would discuss the possibility of an interest rate hike. However, inflation expectations and price dynamics remain largely unchanged, influenced by both domestic and global risk factors. As a result, many market participants expect that the BoJ will maintain its current policy stance.
Some limited support for the yen has provided a temporary equilibrium, but this has not been sufficient to drive significant gains.
Externally, the US dollar continues to weigh on the yen. Signs of economic resilience in the US have led market participants to adjust their expectations about potential interest rate cuts in 2025. While the prevailing market consensus still points to two or three rate cuts next year, these adjustments are not expected in the near term, reinforcing the dollar’s strength against the yen.
Technical analysis of USD/JPY
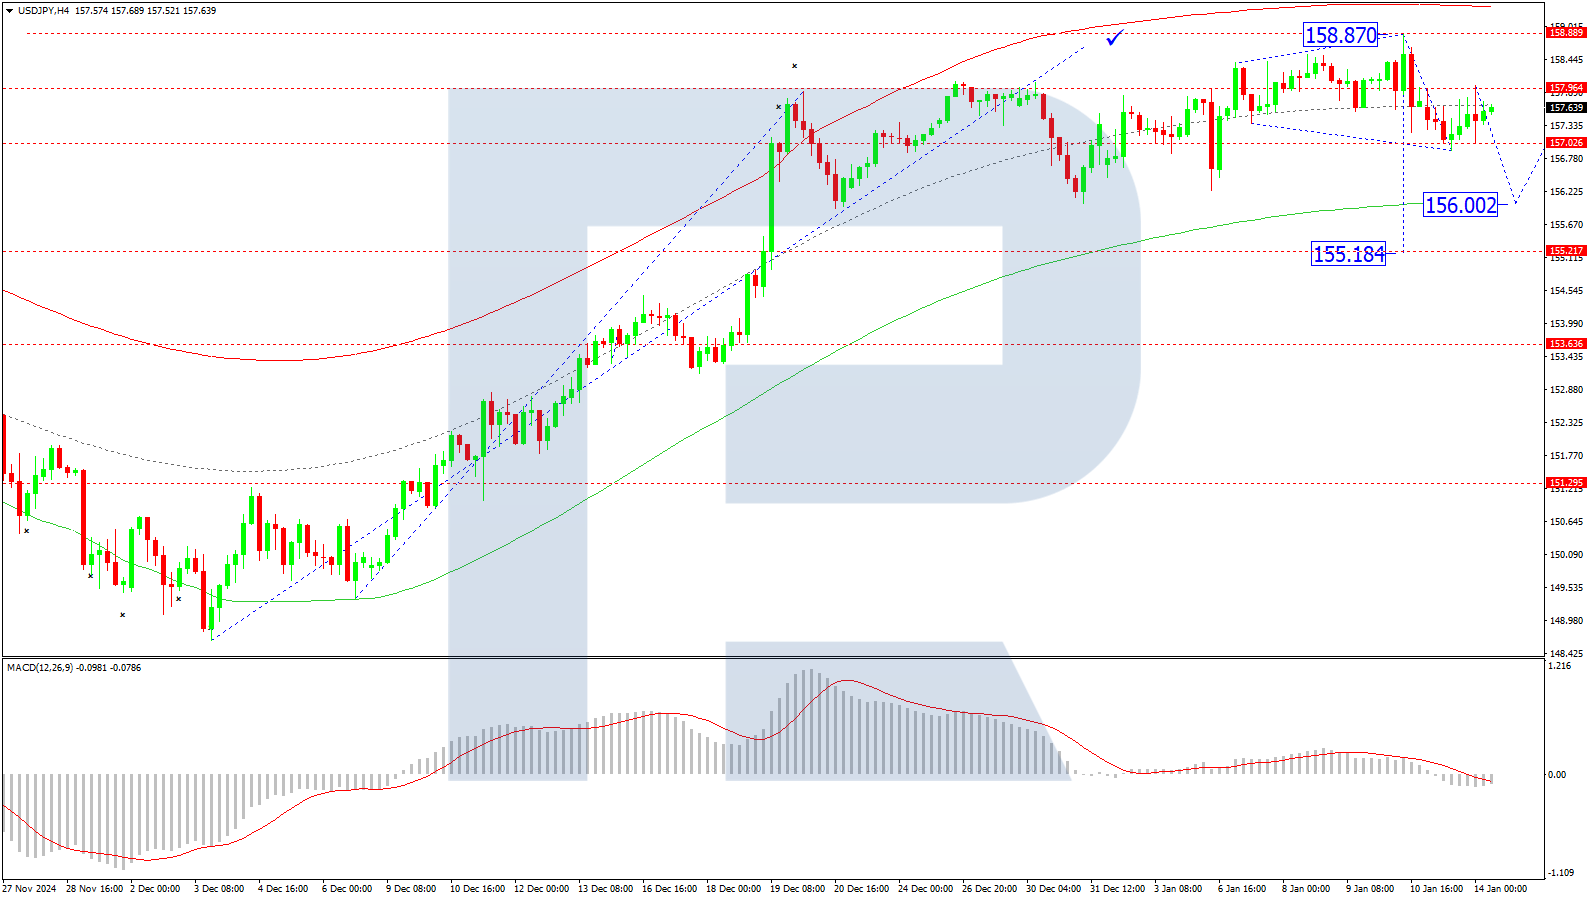
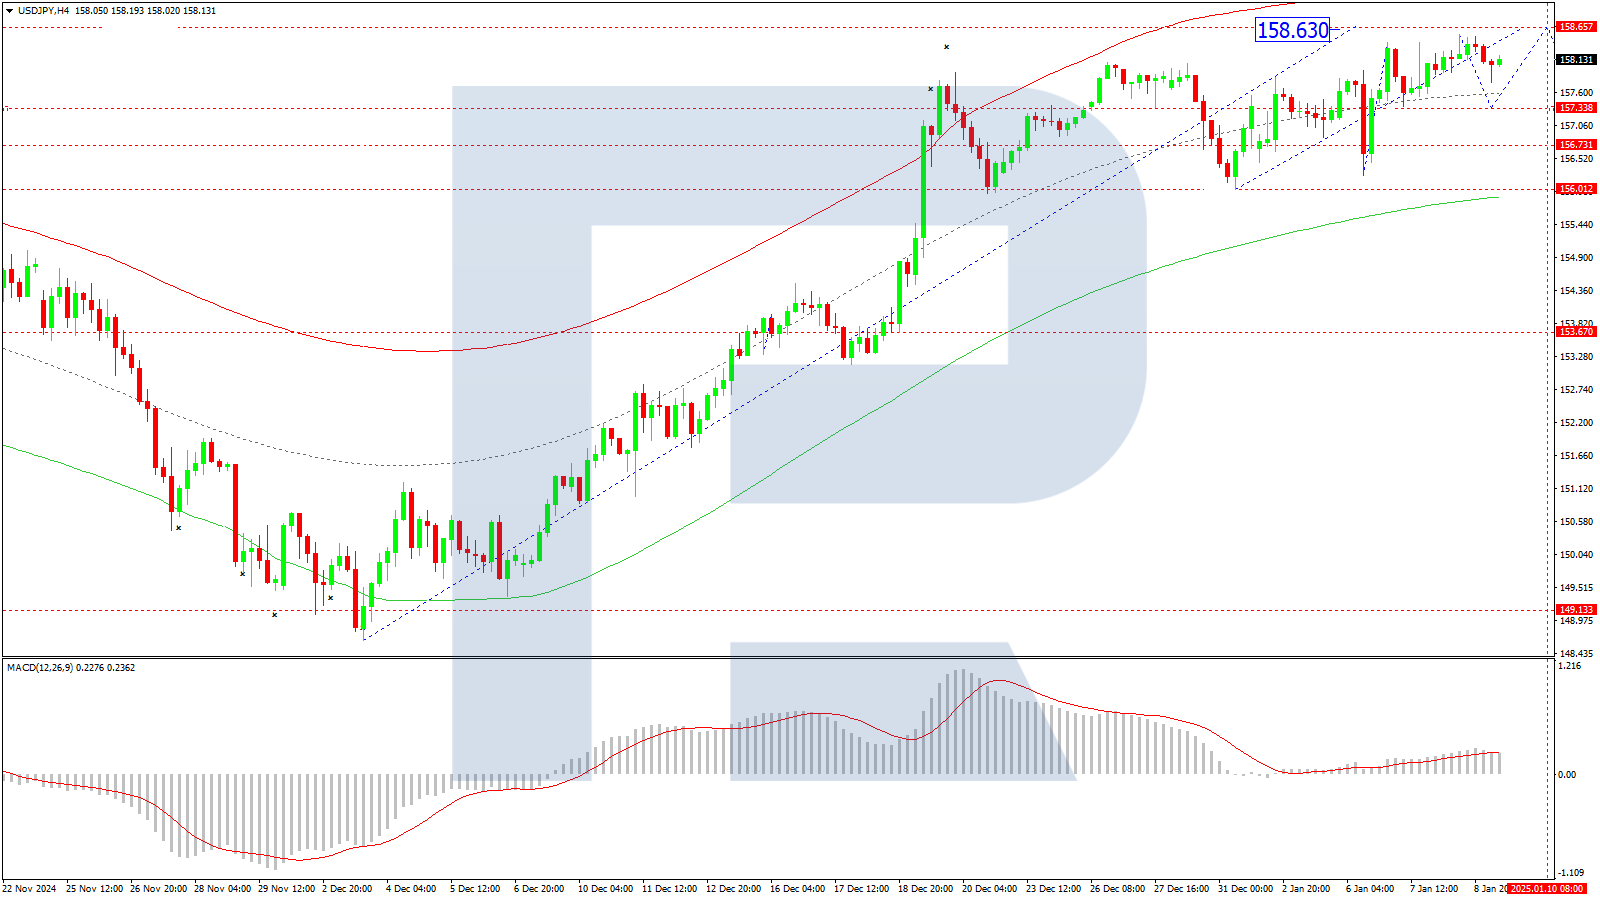
On the H4 chart, the USD/JPY pair completed its upward move at the 158.87 level, followed by a downward impulse reaching 156.90. The current outlook suggests a potential upward correction towards 157.90. Should this level be achieved, the market could see a renewed decline towards the 156.00 mark, which is considered a local target. The MACD indicator supports this scenario, with its signal line below zero and decisively downwards.
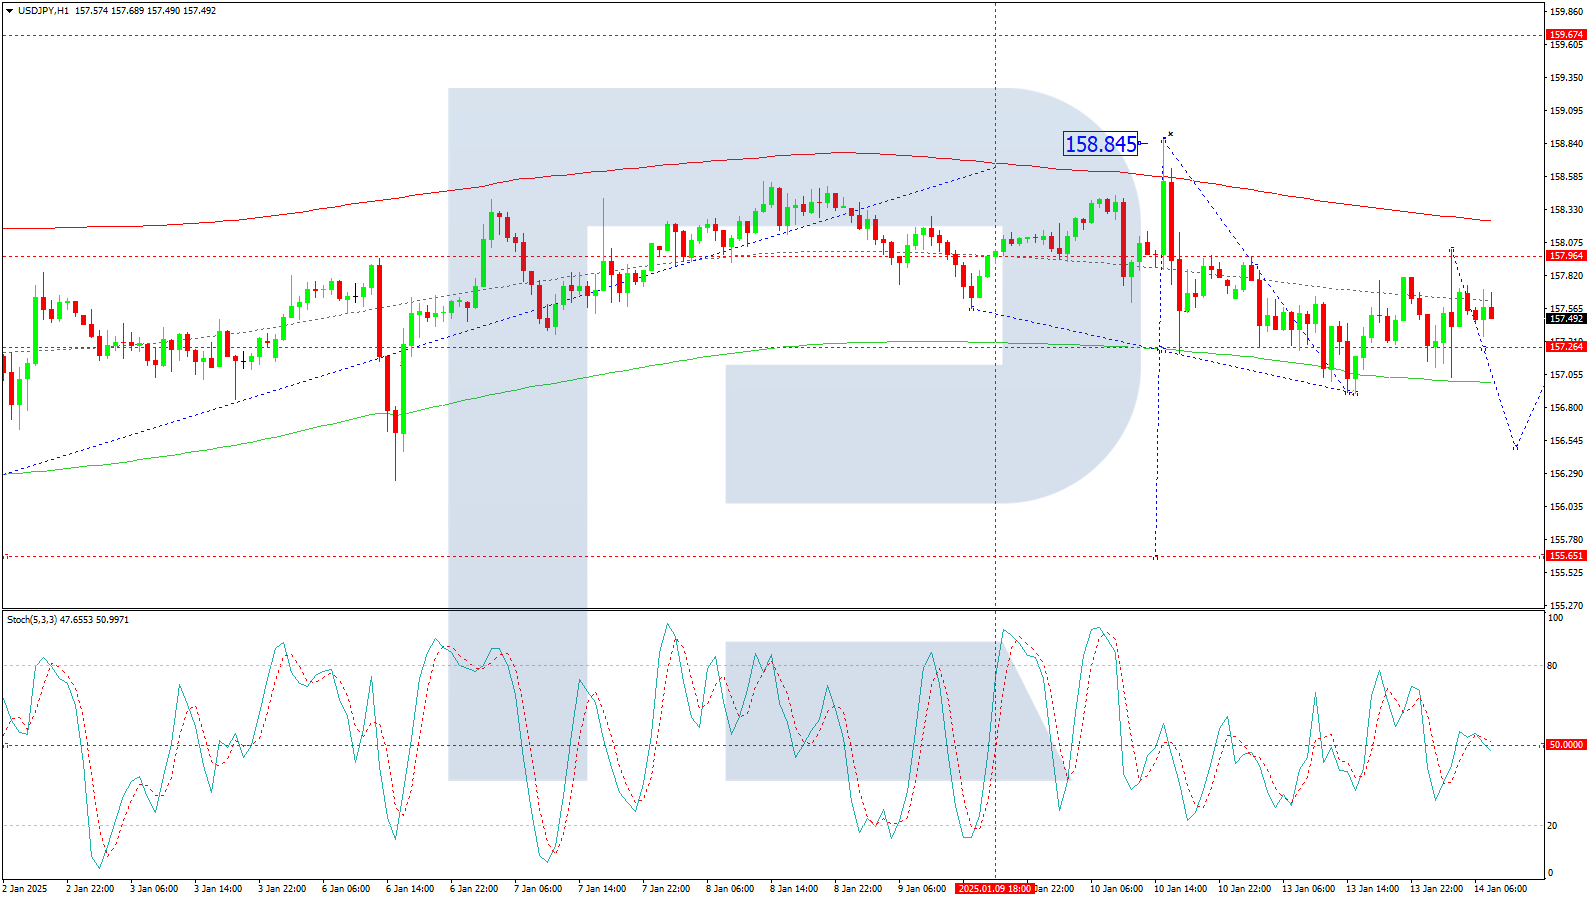
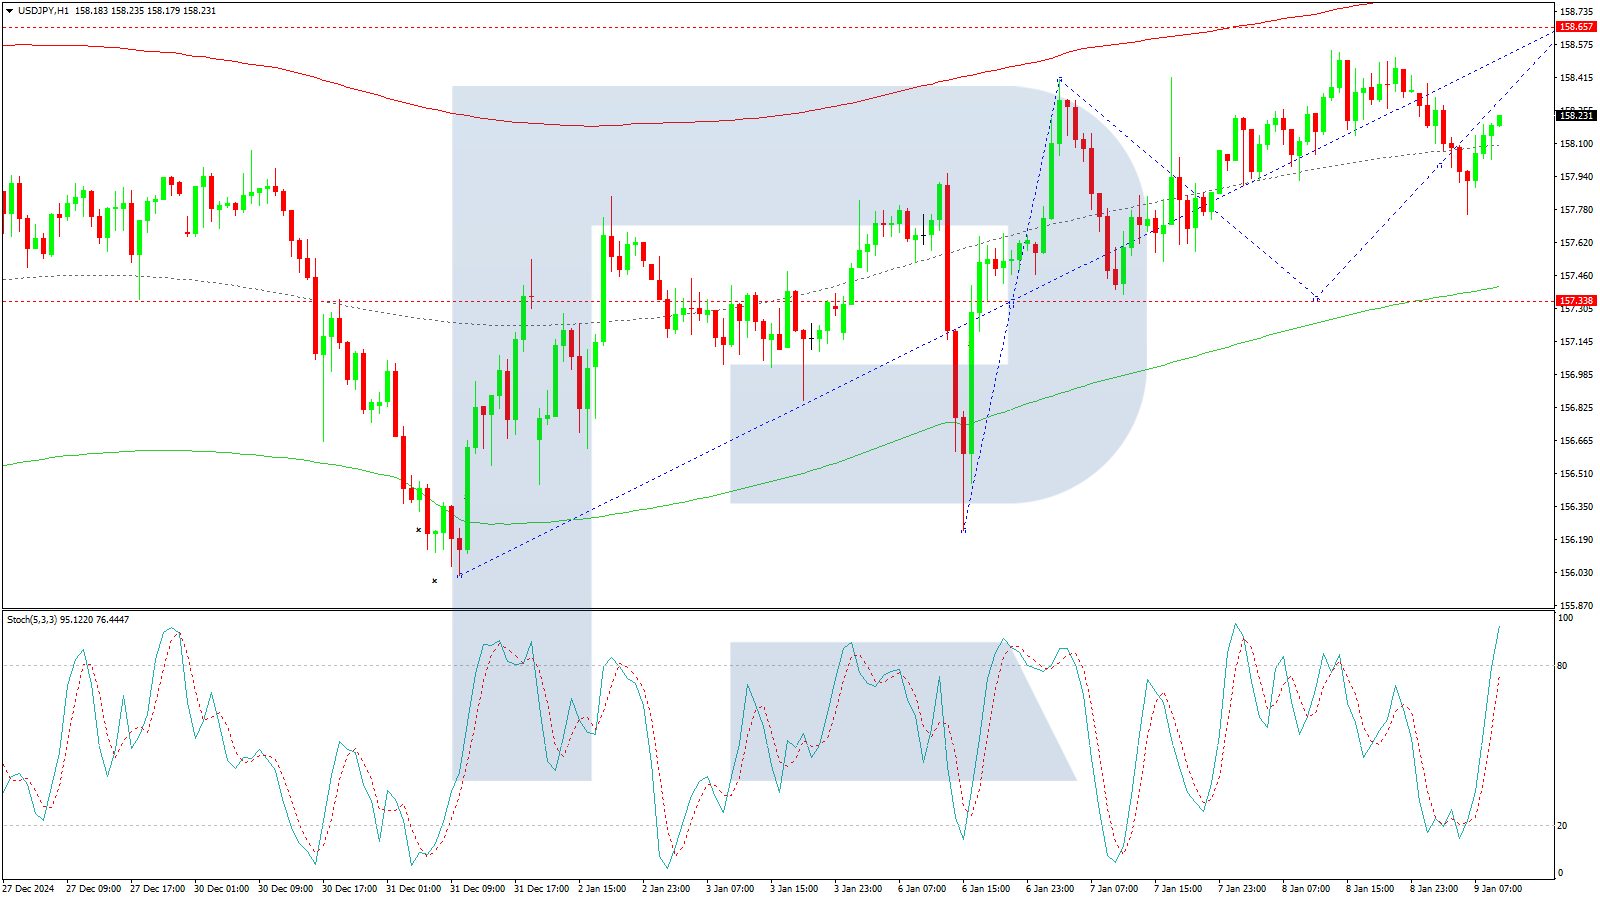
On the H1 chart, the pair experienced a pullback from the 157.90 level, forming a downward wave. The consolidation range around 157.90 is nearly complete, with expectations of a breakout to the downside, likely to initiate a decline towards the 156.00 level. After reaching this target, a corrective move to 157.25 (as a test from below) is possible. Further downward movement towards 156.66 could follow, marking the primary target. The Stochastic oscillator corroborates this scenario, with its signal line below the 50 level and pointing sharply downwards.
Conclusion
The yen’s recent movements highlight an ongoing struggle to recover amid limited support factors and external pressures from the US dollar. The technical outlook suggests a potential short-term decline in USD/JPY, with key support levels at 156.00 and 156.66. However, the broader trend will depend on upcoming developments from the BoJ and shifts in market sentiment around US monetary policy.
Disclaimer
Any forecasts contained herein are based on the author’s particular opinion. This analysis may not be treated as trading advice. RoboForex bears no responsibility for trading results based on trading recommendations and reviews contained herein.