By InvestMacro
Here are the latest charts and statistics for the Commitment of Traders (COT) data published by the Commodities Futures Trading Commission (CFTC).
The latest COT data is updated through Tuesday March 25th and shows a quick view of how large traders (for-profit speculators and commercial entities) were positioned in the futures markets.
Weekly Speculator Changes led by Copper & Palladium

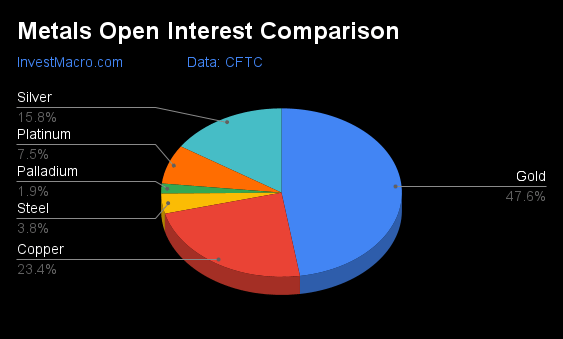
The COT metals markets speculator bets were overall lower this week as just two out of the six metals markets we cover had higher positioning while the other four markets had lower speculator contracts.
Leading the gains for the metals was Copper (8,912 contracts) with Palladium (190 contracts) also seeing a positive week.
The markets with declines in speculator bets for the week were Gold (-8,136 contracts), Platinum (-6,949 contracts), Silver (-1,348 contracts) and Steel (-635 contracts) also recording lower bets on the week.
Metals Net Speculators Leaderboard
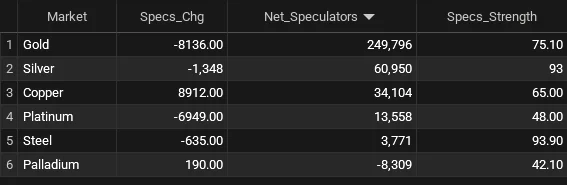
Legend: Weekly Speculators Change | Speculators Current Net Position | Speculators Strength Score compared to last 3-Years (0-100 range)
Strength Scores led by Steel & Silver
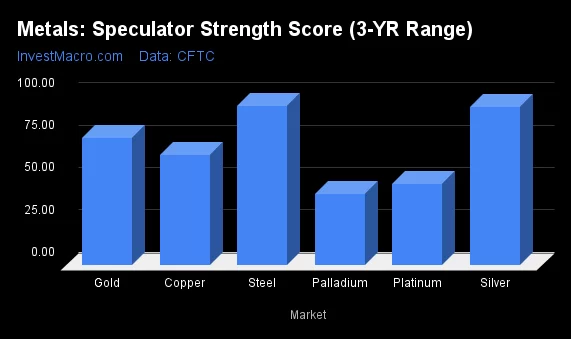
COT Strength Scores (a normalized measure of Speculator positions over a 3-Year range, from 0 to 100 where above 80 is Extreme-Bullish and below 20 is Extreme-Bearish) showed that Steel (94 percent) and Silver (93 percent) lead the metals markets this week. Gold (75 percent) comes in as the next highest in the weekly strength scores.
On the downside, Palladium (42 percent) and Platinum (48 percent) come in at the lowest strength levels currently.
Strength Statistics:
Gold (75.1 percent) vs Gold previous week (78.2 percent)
Silver (93.2 percent) vs Silver previous week (94.9 percent)
Copper (65.0 percent) vs Copper previous week (56.7 percent)
Platinum (48.0 percent) vs Platinum previous week (64.4 percent)
Palladium (42.1 percent) vs Palladium previous week (40.7 percent)
Steel (93.9 percent) vs Palladium previous week (96.8 percent)
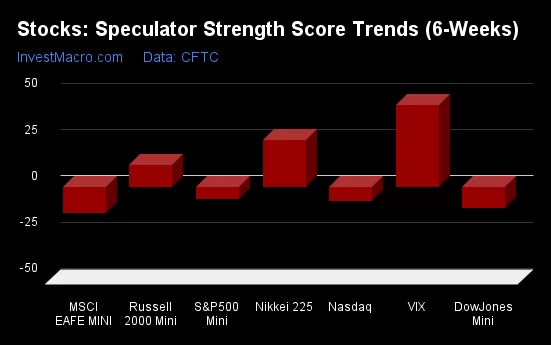
Silver & Copper top the 6-Week Strength Trends
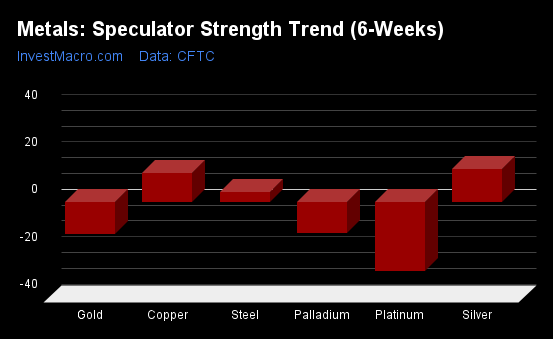
COT Strength Score Trends (or move index, calculates the 6-week changes in strength scores) showed that Silver (14 percent) and Copper (12 percent) lead the past six weeks trends for metals. Steel (4 percent) is the next highest positive mover in the latest trends data.
Platinum (-29 percent) leads the downside trend scores currently with Palladium (-13 percent) and Gold (-13 percent) as the next markets with lower trend scores.
Move Statistics:
Gold (-13.2 percent) vs Gold previous week (-16.9 percent)
Silver (14.2 percent) vs Silver previous week (15.1 percent)
Copper (12.3 percent) vs Copper previous week (9.1 percent)
Platinum (-28.8 percent) vs Platinum previous week (3.6 percent)
Palladium (-13.0 percent) vs Palladium previous week (-17.8 percent)
Steel (4.2 percent) vs Steel previous week (28.5 percent)
Individual Markets:
Gold Comex Futures:
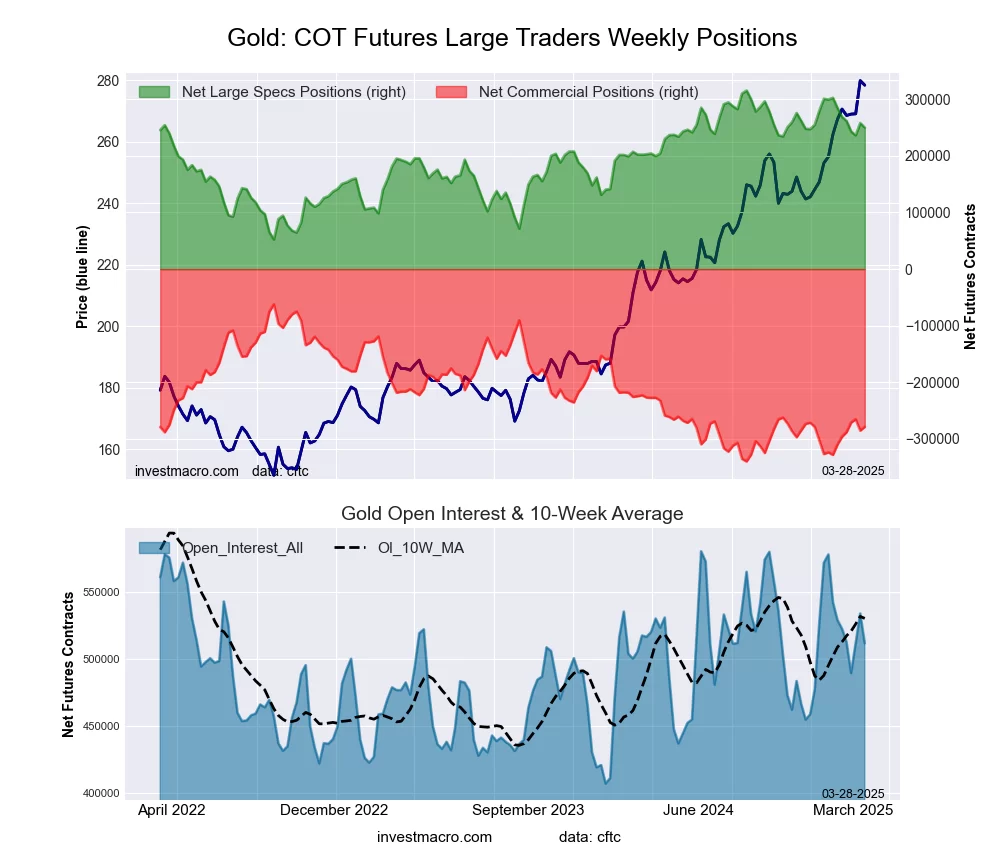 The Gold Comex Futures large speculator standing this week came in at a net position of 249,796 contracts in the data reported through Tuesday. This was a weekly decline of -8,136 contracts from the previous week which had a total of 257,932 net contracts.
This week’s current strength score (the trader positioning range over the past three years, measured from 0 to 100) shows the speculators are currently Bullish with a score of 75.1 percent. The commercials are Bearish with a score of 22.0 percent and the small traders (not shown in chart) are Bullish with a score of 74.9 percent.
Price Trend-Following Model: Strong Uptrend
Our weekly trend-following model classifies the current market price position as: Strong Uptrend.
| Gold Futures Statistics | SPECULATORS | COMMERCIALS | SMALL TRADERS |
| – Percent of Open Interest Longs: | 61.9 | 17.0 | 10.3 |
| – Percent of Open Interest Shorts: | 13.1 | 71.4 | 4.7 |
| – Net Position: | 249,796 | -278,598 | 28,802 |
| – Gross Longs: | 316,572 | 86,838 | 52,852 |
| – Gross Shorts: | 66,776 | 365,436 | 24,050 |
| – Long to Short Ratio: | 4.7 to 1 | 0.2 to 1 | 2.2 to 1 |
| NET POSITION TREND: | |||
| – Strength Index Score (3 Year Range Pct): | 75.1 | 22.0 | 74.9 |
| – Strength Index Reading (3 Year Range): | Bullish | Bearish | Bullish |
| NET POSITION MOVEMENT INDEX: | |||
| – 6-Week Change in Strength Index: | -13.2 | 11.3 | 12.3 |
Silver Comex Futures:
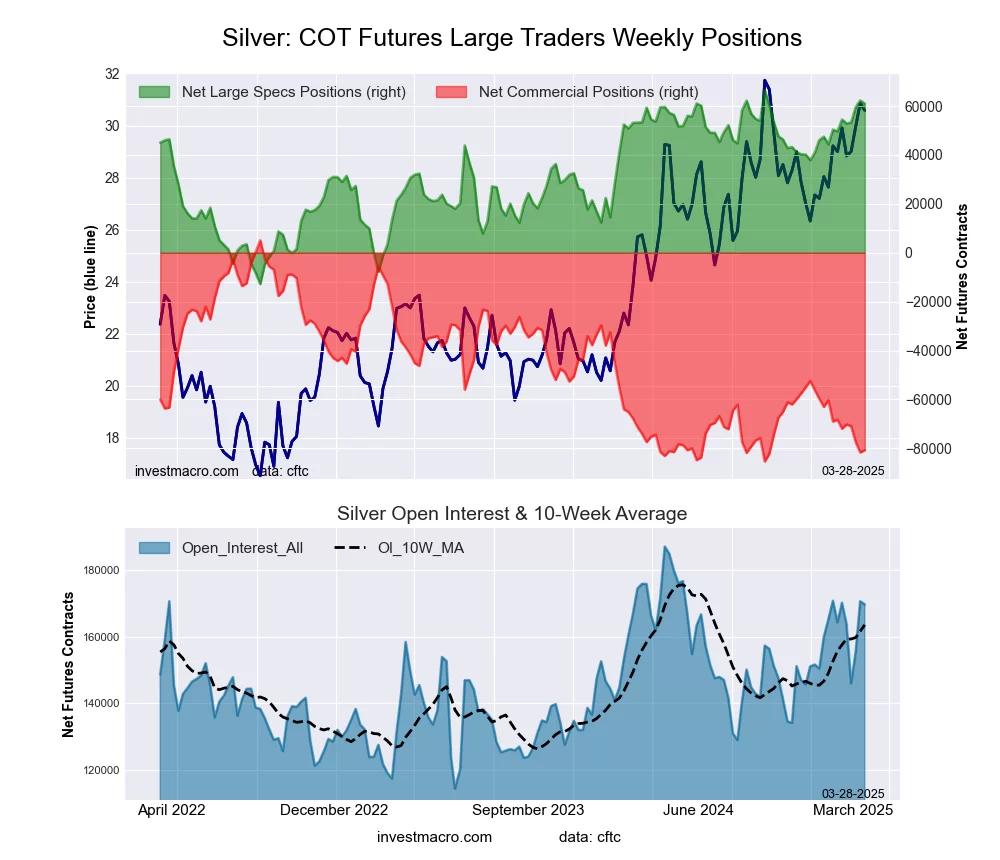 The Silver Comex Futures large speculator standing this week came in at a net position of 60,950 contracts in the data reported through Tuesday. This was a weekly lowering of -1,348 contracts from the previous week which had a total of 62,298 net contracts.
This week’s current strength score (the trader positioning range over the past three years, measured from 0 to 100) shows the speculators are currently Bullish-Extreme with a score of 93.2 percent. The commercials are Bearish-Extreme with a score of 5.1 percent and the small traders (not shown in chart) are Bullish with a score of 66.3 percent.
Price Trend-Following Model: Strong Uptrend
Our weekly trend-following model classifies the current market price position as: Strong Uptrend.
| Silver Futures Statistics | SPECULATORS | COMMERCIALS | SMALL TRADERS |
| – Percent of Open Interest Longs: | 50.5 | 19.0 | 18.8 |
| – Percent of Open Interest Shorts: | 14.6 | 66.6 | 7.2 |
| – Net Position: | 60,950 | -80,705 | 19,755 |
| – Gross Longs: | 85,712 | 32,304 | 31,951 |
| – Gross Shorts: | 24,762 | 113,009 | 12,196 |
| – Long to Short Ratio: | 3.5 to 1 | 0.3 to 1 | 2.6 to 1 |
| NET POSITION TREND: | |||
| – Strength Index Score (3 Year Range Pct): | 93.2 | 5.1 | 66.3 |
| – Strength Index Reading (3 Year Range): | Bullish-Extreme | Bearish-Extreme | Bullish |
| NET POSITION MOVEMENT INDEX: | |||
| – 6-Week Change in Strength Index: | 14.2 | -13.8 | 5.9 |
Copper Grade #1 Futures:
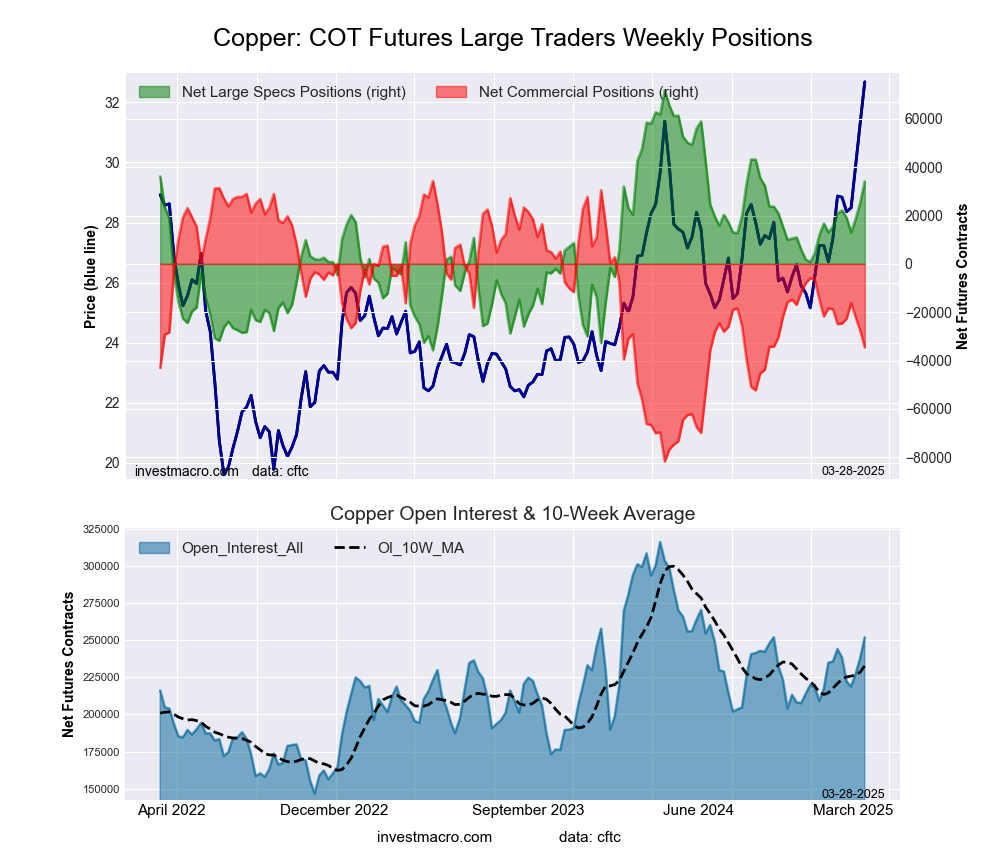 The Copper Grade #1 Futures large speculator standing this week came in at a net position of 34,104 contracts in the data reported through Tuesday. This was a weekly advance of 8,912 contracts from the previous week which had a total of 25,192 net contracts.
This week’s current strength score (the trader positioning range over the past three years, measured from 0 to 100) shows the speculators are currently Bullish with a score of 65.0 percent. The commercials are Bearish with a score of 40.7 percent and the small traders (not shown in chart) are Bearish with a score of 20.3 percent.
Price Trend-Following Model: Strong Uptrend
Our weekly trend-following model classifies the current market price position as: Strong Uptrend.
| Copper Futures Statistics | SPECULATORS | COMMERCIALS | SMALL TRADERS |
| – Percent of Open Interest Longs: | 42.1 | 28.1 | 6.9 |
| – Percent of Open Interest Shorts: | 28.6 | 41.8 | 6.7 |
| – Net Position: | 34,104 | -34,530 | 426 |
| – Gross Longs: | 106,085 | 70,815 | 17,306 |
| – Gross Shorts: | 71,981 | 105,345 | 16,880 |
| – Long to Short Ratio: | 1.5 to 1 | 0.7 to 1 | 1.0 to 1 |
| NET POSITION TREND: | |||
| – Strength Index Score (3 Year Range Pct): | 65.0 | 40.7 | 20.3 |
| – Strength Index Reading (3 Year Range): | Bullish | Bearish | Bearish |
| NET POSITION MOVEMENT INDEX: | |||
| – 6-Week Change in Strength Index: | 12.3 | -8.4 | -21.3 |
Platinum Futures:
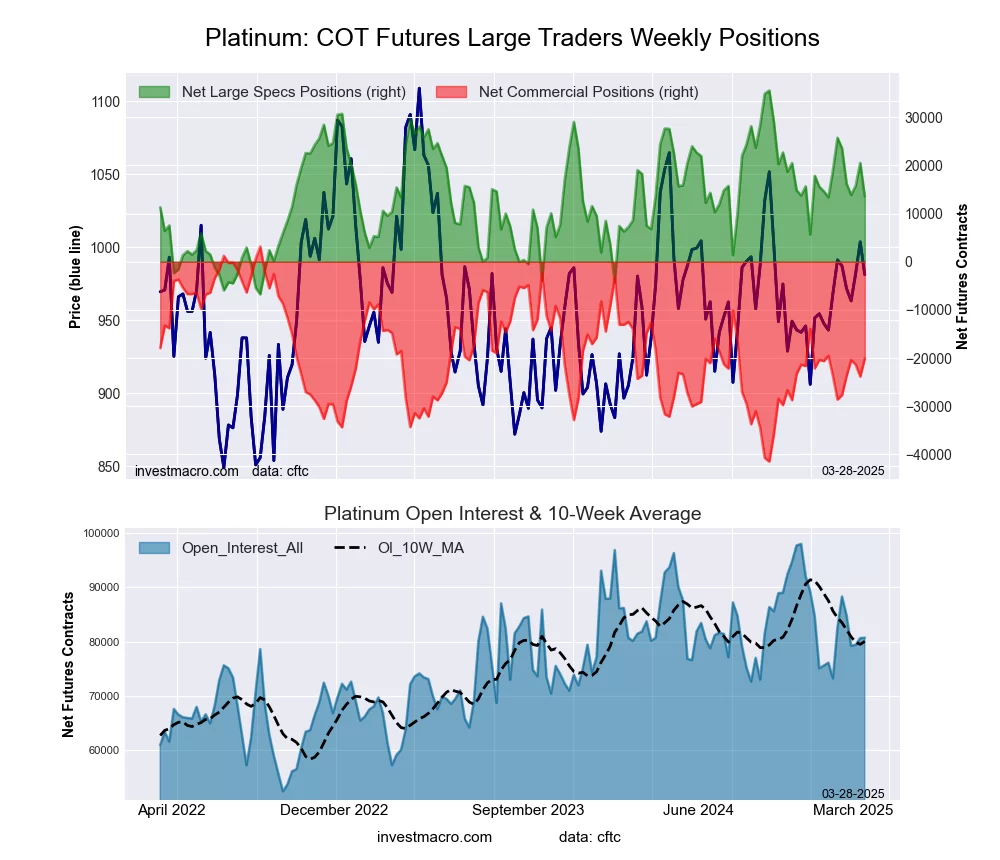 The Platinum Futures large speculator standing this week came in at a net position of 13,558 contracts in the data reported through Tuesday. This was a weekly decline of -6,949 contracts from the previous week which had a total of 20,507 net contracts.
This week’s current strength score (the trader positioning range over the past three years, measured from 0 to 100) shows the speculators are currently Bearish with a score of 48.0 percent. The commercials are Bearish with a score of 48.0 percent and the small traders (not shown in chart) are Bullish with a score of 64.8 percent.
Price Trend-Following Model: Strong Uptrend
Our weekly trend-following model classifies the current market price position as: Strong Uptrend.
| Platinum Futures Statistics | SPECULATORS | COMMERCIALS | SMALL TRADERS |
| – Percent of Open Interest Longs: | 60.0 | 22.5 | 12.7 |
| – Percent of Open Interest Shorts: | 43.2 | 47.4 | 4.7 |
| – Net Position: | 13,558 | -20,060 | 6,502 |
| – Gross Longs: | 48,416 | 18,154 | 10,285 |
| – Gross Shorts: | 34,858 | 38,214 | 3,783 |
| – Long to Short Ratio: | 1.4 to 1 | 0.5 to 1 | 2.7 to 1 |
| NET POSITION TREND: | |||
| – Strength Index Score (3 Year Range Pct): | 48.0 | 48.0 | 64.8 |
| – Strength Index Reading (3 Year Range): | Bearish | Bearish | Bullish |
| NET POSITION MOVEMENT INDEX: | |||
| – 6-Week Change in Strength Index: | -28.8 | 19.1 | 57.0 |
Palladium Futures:
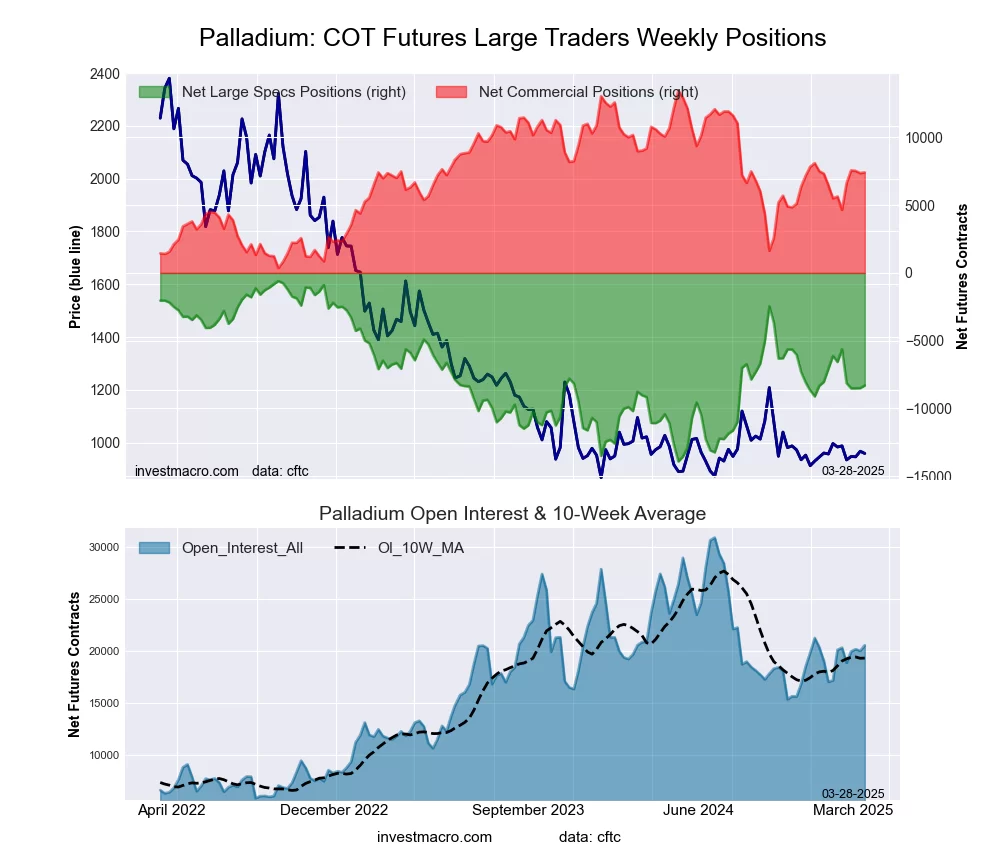 The Palladium Futures large speculator standing this week came in at a net position of -8,309 contracts in the data reported through Tuesday. This was a weekly lift of 190 contracts from the previous week which had a total of -8,499 net contracts.
This week’s current strength score (the trader positioning range over the past three years, measured from 0 to 100) shows the speculators are currently Bearish with a score of 42.1 percent. The commercials are Bullish with a score of 53.9 percent and the small traders (not shown in chart) are Bullish with a score of 71.7 percent.
Price Trend-Following Model: Weak Downtrend
Our weekly trend-following model classifies the current market price position as: Weak Downtrend.
| Palladium Futures Statistics | SPECULATORS | COMMERCIALS | SMALL TRADERS |
| – Percent of Open Interest Longs: | 41.1 | 44.2 | 11.2 |
| – Percent of Open Interest Shorts: | 81.5 | 8.1 | 6.9 |
| – Net Position: | -8,309 | 7,420 | 889 |
| – Gross Longs: | 8,436 | 9,082 | 2,300 |
| – Gross Shorts: | 16,745 | 1,662 | 1,411 |
| – Long to Short Ratio: | 0.5 to 1 | 5.5 to 1 | 1.6 to 1 |
| NET POSITION TREND: | |||
| – Strength Index Score (3 Year Range Pct): | 42.1 | 53.9 | 71.7 |
| – Strength Index Reading (3 Year Range): | Bearish | Bullish | Bullish |
| NET POSITION MOVEMENT INDEX: | |||
| – 6-Week Change in Strength Index: | -13.0 | 13.6 | -1.9 |
Steel Futures Futures:
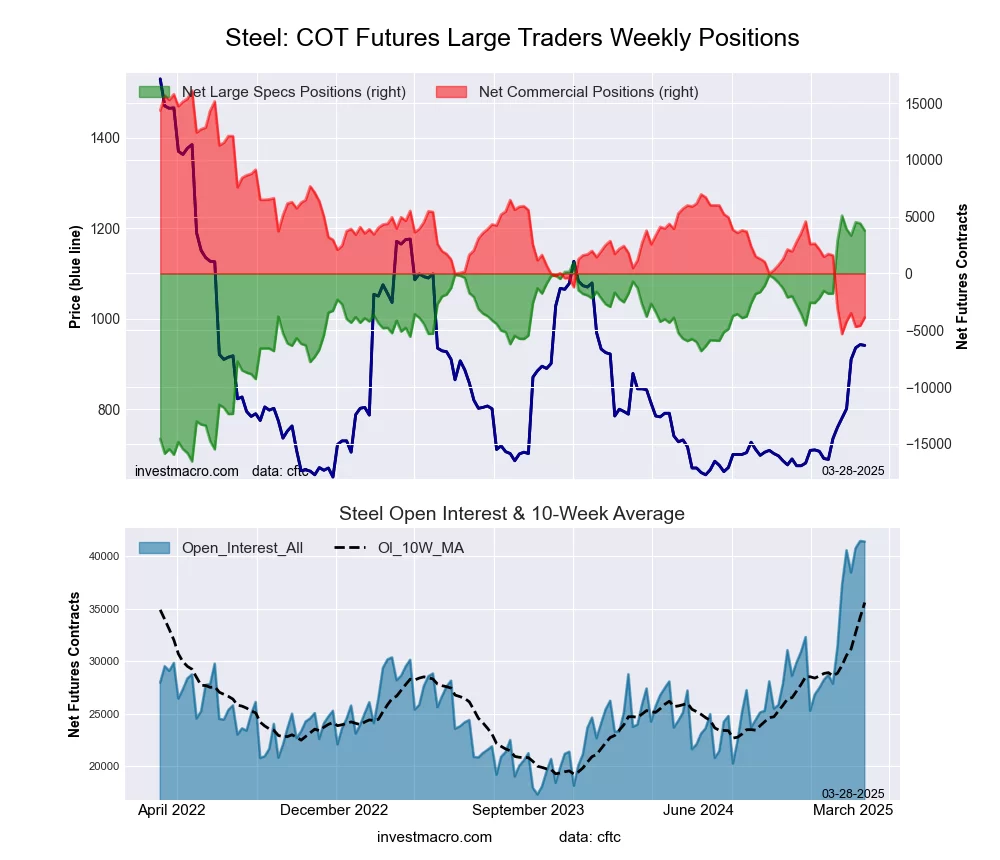 The Steel Futures large speculator standing this week came in at a net position of 3,771 contracts in the data reported through Tuesday. This was a weekly decrease of -635 contracts from the previous week which had a total of 4,406 net contracts.
This week’s current strength score (the trader positioning range over the past three years, measured from 0 to 100) shows the speculators are currently Bullish-Extreme with a score of 93.9 percent. The commercials are Bearish-Extreme with a score of 6.8 percent and the small traders (not shown in chart) are Bearish with a score of 43.1 percent.
Price Trend-Following Model: Strong Uptrend
Our weekly trend-following model classifies the current market price position as: Strong Uptrend.
| Steel Futures Statistics | SPECULATORS | COMMERCIALS | SMALL TRADERS |
| – Percent of Open Interest Longs: | 33.4 | 59.8 | 0.6 |
| – Percent of Open Interest Shorts: | 24.3 | 69.1 | 0.4 |
| – Net Position: | 3,771 | -3,869 | 98 |
| – Gross Longs: | 13,822 | 24,720 | 248 |
| – Gross Shorts: | 10,051 | 28,589 | 150 |
| – Long to Short Ratio: | 1.4 to 1 | 0.9 to 1 | 1.7 to 1 |
| NET POSITION TREND: | |||
| – Strength Index Score (3 Year Range Pct): | 93.9 | 6.8 | 43.1 |
| – Strength Index Reading (3 Year Range): | Bullish-Extreme | Bearish-Extreme | Bearish |
| NET POSITION MOVEMENT INDEX: | |||
| – 6-Week Change in Strength Index: | 4.2 | -3.9 | -8.9 |
Article By InvestMacro – Receive our weekly COT Newsletter
*COT Report: The COT data, released weekly to the public each Friday, is updated through the most recent Tuesday (data is 3 days old) and shows a quick view of how large speculators or non-commercials (for-profit traders) were positioned in the futures markets.
The CFTC categorizes trader positions according to commercial hedgers (traders who use futures contracts for hedging as part of the business), non-commercials (large traders who speculate to realize trading profits) and nonreportable traders (usually small traders/speculators) as well as their open interest (contracts open in the market at time of reporting). See CFTC criteria here.