By InvestMacro
Here are the latest charts and statistics for the Commitment of Traders (COT) reports data published by the Commodities Futures Trading Commission (CFTC).
The latest COT data is updated through Tuesday April 1st and shows a quick view of how large traders (for-profit speculators and commercial entities) were positioned in the futures markets.
Weekly Speculator Changes led by Soybean Oil, Cotton & Soybeans
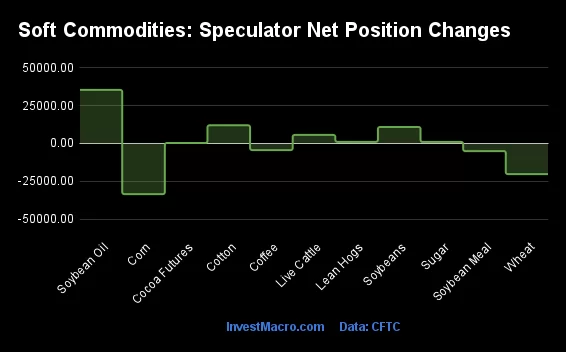
The COT soft commodities markets speculator bets were overall higher this week (through Tuesday) as seven out of the eleven softs markets we cover had higher positioning while the other four markets had lower speculator contracts.
Leading the gains for the softs markets was Soybean Oil (35,433 contracts) with Cotton (12,027 contracts), Soybeans (10,898 contracts), Live Cattle (5,659 contracts), Lean Hogs (1,088 contracts), Sugar (1,031 contracts) and Cocoa (323 contracts) also showing positive weeks.
The markets with the declines in speculator bets this week were Corn (-33,502 contracts), Wheat (-20,252 contracts), Soybean Meal (-5,022 contracts) and Coffee (-4,389 contracts) also recording lower bets on the week.
Soft Commodities Net Speculators Leaderboard
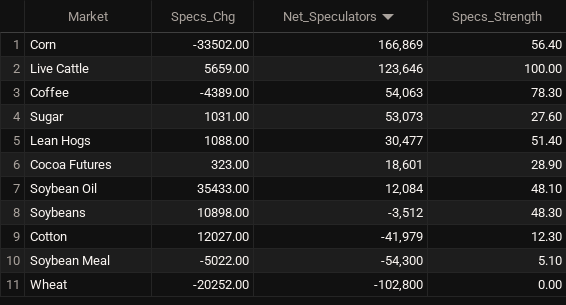
Legend: Weekly Speculators Change | Speculators Current Net Position | Speculators Strength Score compared to last 3-Years (0-100 range)
Strength Scores led by Live Cattle & Coffee
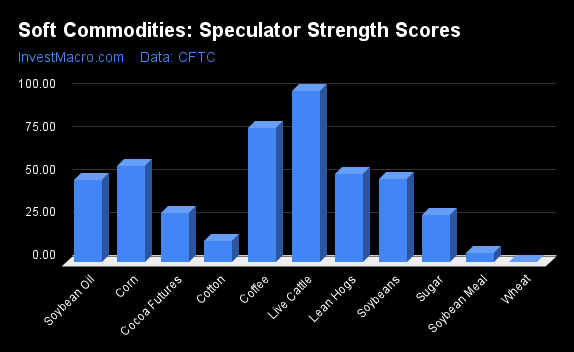
COT Strength Scores (a normalized measure of Speculator positions over a 3-Year range, from 0 to 100 where above 80 is Extreme-Bullish and below 20 is Extreme-Bearish) showed that Live Cattle (100 percent) and Coffee (78 percent) lead the softs markets this week. Corn (56 percent) and Lean Hogs (51 percent) come in as the next highest in the weekly strength scores.
On the downside, Wheat (0 percent), Soybean Meal (5 percent) and Cotton (12 percent) come in at the lowest strength levels currently and are in Extreme-Bearish territory (below 20 percent).
Strength Statistics:
Corn (56.4 percent) vs Corn previous week (60.7 percent)
Sugar (27.6 percent) vs Sugar previous week (27.2 percent)
Coffee (78.3 percent) vs Coffee previous week (82.5 percent)
Soybeans (48.3 percent) vs Soybeans previous week (45.6 percent)
Soybean Oil (48.1 percent) vs Soybean Oil previous week (28.7 percent)
Soybean Meal (5.1 percent) vs Soybean Meal previous week (7.2 percent)
Live Cattle (100.0 percent) vs Live Cattle previous week (94.6 percent)
Lean Hogs (51.4 percent) vs Lean Hogs previous week (50.6 percent)
Cotton (12.3 percent) vs Cotton previous week (4.9 percent)
Cocoa (28.9 percent) vs Cocoa previous week (28.6 percent)
Wheat (0.0 percent) vs Wheat previous week (15.4 percent)
Sugar & Live Cattle top the 6-Week Strength Trends
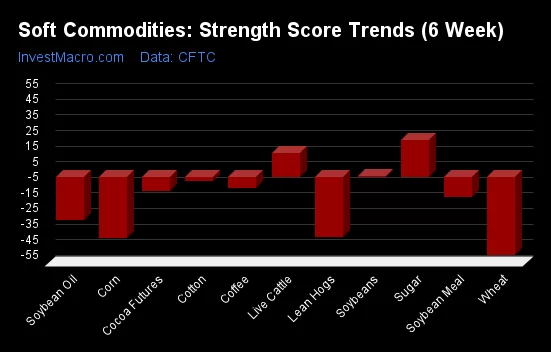
COT Strength Score Trends (or move index, calculates the 6-week changes in strength scores) showed that Sugar (24 percent) and Live Cattle (15 percent) lead the past six weeks trends for soft commodities. Soybeans (1 percent) are the next highest and the only other positive mover in the latest trends data.
Wheat (-50 percent) leads the downside trend scores currently with Lean Hogs (-39 percent), Corn (-39 percent) and Soybean Oil (-28 percent) following next with lower trend scores.
Strength Trend Statistics:
Corn (-39.3 percent) vs Corn previous week (-29.2 percent)
Sugar (23.6 percent) vs Sugar previous week (25.1 percent)
Coffee (-7.4 percent) vs Coffee previous week (-5.1 percent)
Soybeans (0.5 percent) vs Soybeans previous week (-5.3 percent)
Soybean Oil (-27.7 percent) vs Soybean Oil previous week (-43.0 percent)
Soybean Meal (-13.4 percent) vs Soybean Meal previous week (-14.5 percent)
Live Cattle (14.8 percent) vs Live Cattle previous week (4.4 percent)
Lean Hogs (-38.9 percent) vs Lean Hogs previous week (-33.8 percent)
Cotton (-3.0 percent) vs Cotton previous week (-7.0 percent)
Cocoa (-9.6 percent) vs Cocoa previous week (-8.7 percent)
Wheat (-50.2 percent) vs Wheat previous week (-20.2 percent)
Individual Soft Commodities Markets:
CORN Futures:
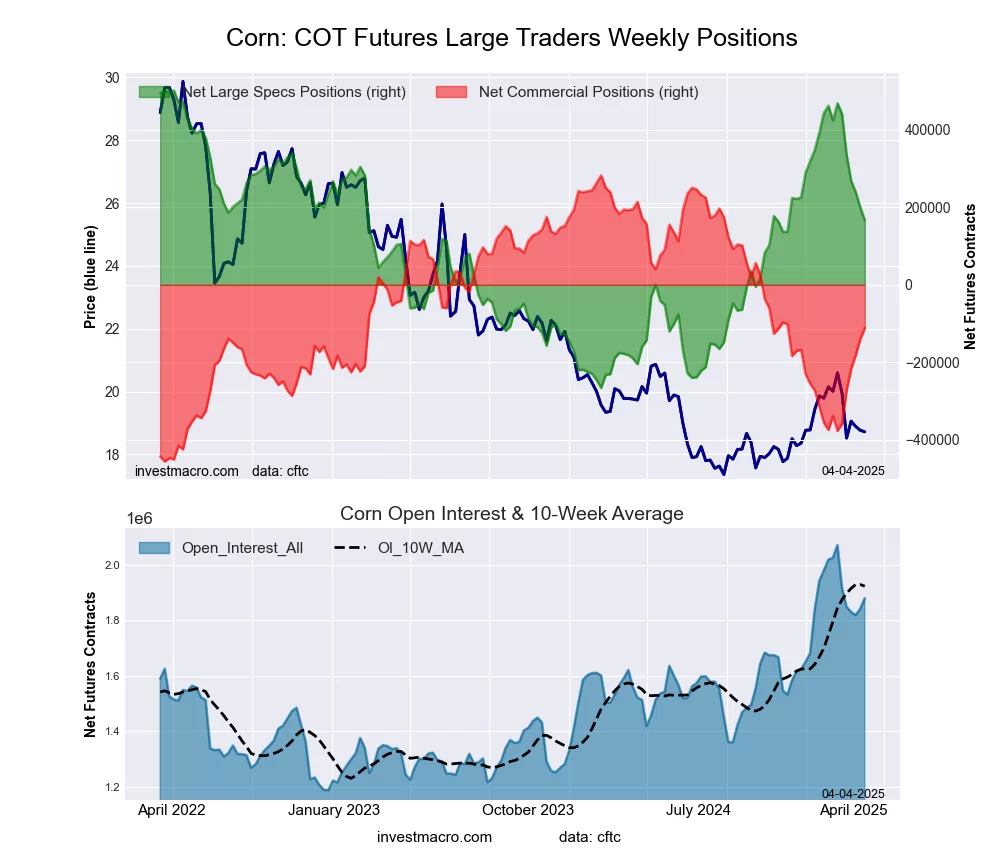 The CORN large speculator standing this week totaled a net position of 166,869 contracts in the data reported through Tuesday. This was a weekly lowering of -33,502 contracts from the previous week which had a total of 200,371 net contracts.
This week’s current strength score (the trader positioning range over the past three years, measured from 0 to 100) shows the speculators are currently Bullish with a score of 56.4 percent. The commercials are Bearish with a score of 46.7 percent and the small traders (not shown in chart) are Bearish with a score of 41.9 percent.
Price Trend-Following Model: Weak Uptrend
Our weekly trend-following model classifies the current market price position as: Weak Uptrend.
| CORN Futures Statistics | SPECULATORS | COMMERCIALS | SMALL TRADERS |
| – Percent of Open Interest Longs: | 22.0 | 42.7 | 6.8 |
| – Percent of Open Interest Shorts: | 13.1 | 48.6 | 9.8 |
| – Net Position: | 166,869 | -111,384 | -55,485 |
| – Gross Longs: | 412,771 | 801,895 | 128,660 |
| – Gross Shorts: | 245,902 | 913,279 | 184,145 |
| – Long to Short Ratio: | 1.7 to 1 | 0.9 to 1 | 0.7 to 1 |
| NET POSITION TREND: | |||
| – Strength Index Score (3 Year Range Pct): | 56.4 | 46.7 | 41.9 |
| – Strength Index Reading (3 Year Range): | Bullish | Bearish | Bearish |
| NET POSITION MOVEMENT INDEX: | |||
| – 6-Week Change in Strength Index: | -39.3 | 36.0 | 41.9 |
SUGAR Futures:
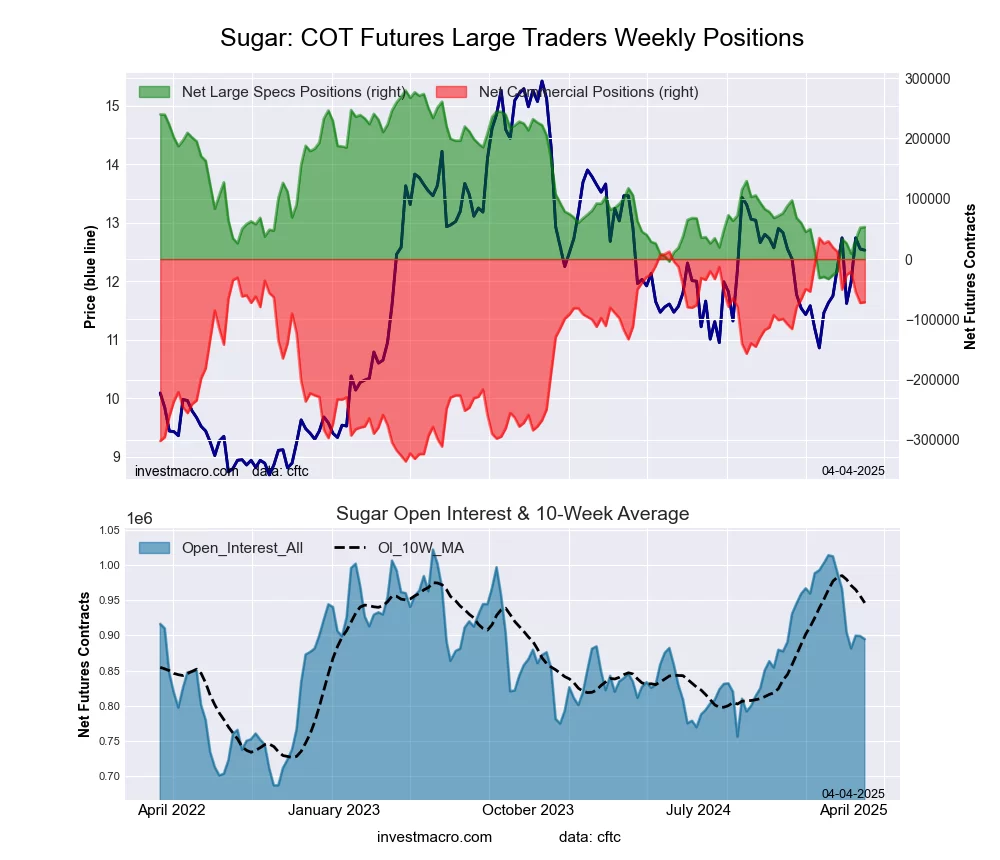 The SUGAR large speculator standing this week totaled a net position of 53,073 contracts in the data reported through Tuesday. This was a weekly advance of 1,031 contracts from the previous week which had a total of 52,042 net contracts.
This week’s current strength score (the trader positioning range over the past three years, measured from 0 to 100) shows the speculators are currently Bearish with a score of 27.6 percent. The commercials are Bullish with a score of 71.3 percent and the small traders (not shown in chart) are Bearish with a score of 43.7 percent.
Price Trend-Following Model: Strong Uptrend
Our weekly trend-following model classifies the current market price position as: Strong Uptrend.
| SUGAR Futures Statistics | SPECULATORS | COMMERCIALS | SMALL TRADERS |
| – Percent of Open Interest Longs: | 23.8 | 49.4 | 8.0 |
| – Percent of Open Interest Shorts: | 17.9 | 57.4 | 5.9 |
| – Net Position: | 53,073 | -71,583 | 18,510 |
| – Gross Longs: | 212,886 | 441,582 | 71,472 |
| – Gross Shorts: | 159,813 | 513,165 | 52,962 |
| – Long to Short Ratio: | 1.3 to 1 | 0.9 to 1 | 1.3 to 1 |
| NET POSITION TREND: | |||
| – Strength Index Score (3 Year Range Pct): | 27.6 | 71.3 | 43.7 |
| – Strength Index Reading (3 Year Range): | Bearish | Bullish | Bearish |
| NET POSITION MOVEMENT INDEX: | |||
| – 6-Week Change in Strength Index: | 23.6 | -22.6 | 12.8 |
COFFEE Futures:
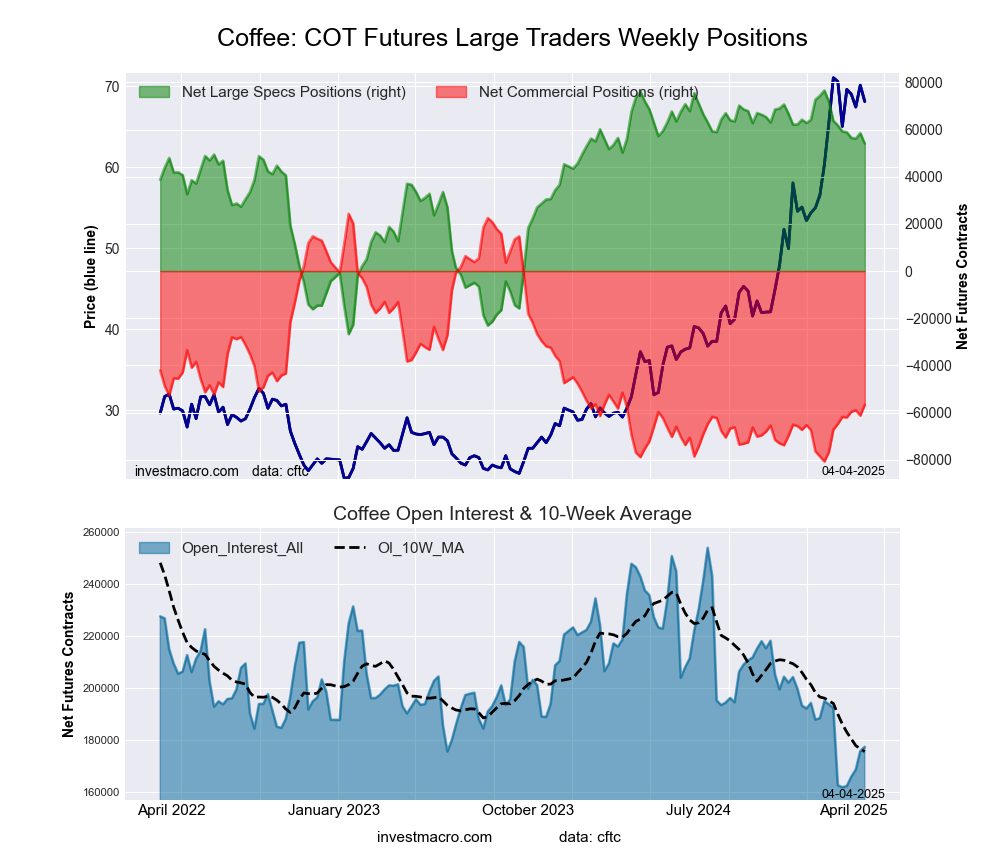 The COFFEE large speculator standing this week totaled a net position of 54,063 contracts in the data reported through Tuesday. This was a weekly decline of -4,389 contracts from the previous week which had a total of 58,452 net contracts.
This week’s current strength score (the trader positioning range over the past three years, measured from 0 to 100) shows the speculators are currently Bullish with a score of 78.3 percent. The commercials are Bearish with a score of 22.9 percent and the small traders (not shown in chart) are Bullish with a score of 61.8 percent.
Price Trend-Following Model: Uptrend
Our weekly trend-following model classifies the current market price position as: Uptrend.
| COFFEE Futures Statistics | SPECULATORS | COMMERCIALS | SMALL TRADERS |
| – Percent of Open Interest Longs: | 38.1 | 36.9 | 5.2 |
| – Percent of Open Interest Shorts: | 7.7 | 68.9 | 3.7 |
| – Net Position: | 54,063 | -56,663 | 2,600 |
| – Gross Longs: | 67,669 | 65,549 | 9,234 |
| – Gross Shorts: | 13,606 | 122,212 | 6,634 |
| – Long to Short Ratio: | 5.0 to 1 | 0.5 to 1 | 1.4 to 1 |
| NET POSITION TREND: | |||
| – Strength Index Score (3 Year Range Pct): | 78.3 | 22.9 | 61.8 |
| – Strength Index Reading (3 Year Range): | Bullish | Bearish | Bullish |
| NET POSITION MOVEMENT INDEX: | |||
| – 6-Week Change in Strength Index: | -7.4 | 7.7 | -8.1 |
SOYBEANS Futures:
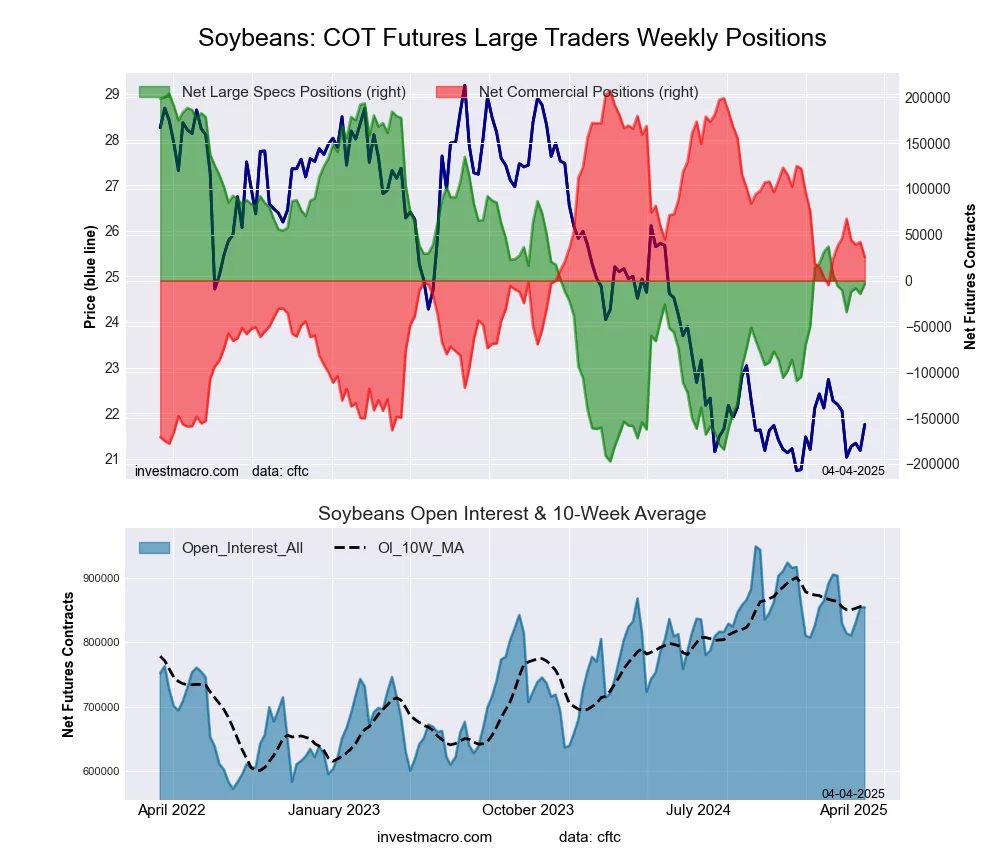 The SOYBEANS large speculator standing this week totaled a net position of -3,512 contracts in the data reported through Tuesday. This was a weekly boost of 10,898 contracts from the previous week which had a total of -14,410 net contracts.
This week’s current strength score (the trader positioning range over the past three years, measured from 0 to 100) shows the speculators are currently Bearish with a score of 48.3 percent. The commercials are Bullish with a score of 52.8 percent and the small traders (not shown in chart) are Bullish with a score of 54.9 percent.
Price Trend-Following Model: Weak Uptrend
Our weekly trend-following model classifies the current market price position as: Weak Uptrend.
| SOYBEANS Futures Statistics | SPECULATORS | COMMERCIALS | SMALL TRADERS |
| – Percent of Open Interest Longs: | 18.6 | 52.9 | 5.0 |
| – Percent of Open Interest Shorts: | 19.0 | 49.9 | 7.6 |
| – Net Position: | -3,512 | 25,581 | -22,069 |
| – Gross Longs: | 158,653 | 451,514 | 43,113 |
| – Gross Shorts: | 162,165 | 425,933 | 65,182 |
| – Long to Short Ratio: | 1.0 to 1 | 1.1 to 1 | 0.7 to 1 |
| NET POSITION TREND: | |||
| – Strength Index Score (3 Year Range Pct): | 48.3 | 52.8 | 54.9 |
| – Strength Index Reading (3 Year Range): | Bearish | Bullish | Bullish |
| NET POSITION MOVEMENT INDEX: | |||
| – 6-Week Change in Strength Index: | 0.5 | -3.1 | 25.8 |
SOYBEAN OIL Futures:
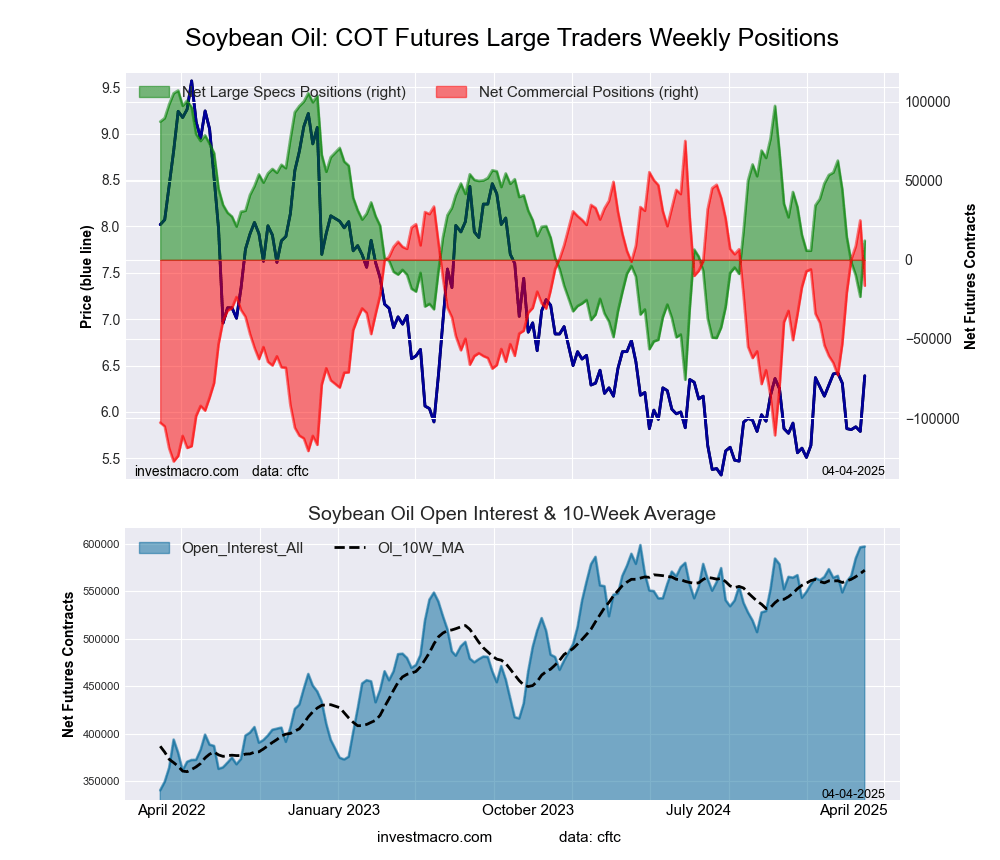 The SOYBEAN OIL large speculator standing this week totaled a net position of 12,084 contracts in the data reported through Tuesday. This was a weekly gain of 35,433 contracts from the previous week which had a total of -23,349 net contracts.
This week’s current strength score (the trader positioning range over the past three years, measured from 0 to 100) shows the speculators are currently Bearish with a score of 48.1 percent. The commercials are Bullish with a score of 54.8 percent and the small traders (not shown in chart) are Bearish with a score of 30.6 percent.
Price Trend-Following Model: Strong Uptrend
Our weekly trend-following model classifies the current market price position as: Strong Uptrend.
| SOYBEAN OIL Futures Statistics | SPECULATORS | COMMERCIALS | SMALL TRADERS |
| – Percent of Open Interest Longs: | 21.4 | 52.9 | 5.3 |
| – Percent of Open Interest Shorts: | 19.4 | 55.6 | 4.6 |
| – Net Position: | 12,084 | -16,338 | 4,254 |
| – Gross Longs: | 127,743 | 315,806 | 31,759 |
| – Gross Shorts: | 115,659 | 332,144 | 27,505 |
| – Long to Short Ratio: | 1.1 to 1 | 1.0 to 1 | 1.2 to 1 |
| NET POSITION TREND: | |||
| – Strength Index Score (3 Year Range Pct): | 48.1 | 54.8 | 30.6 |
| – Strength Index Reading (3 Year Range): | Bearish | Bullish | Bearish |
| NET POSITION MOVEMENT INDEX: | |||
| – 6-Week Change in Strength Index: | -27.7 | 28.0 | -23.4 |
SOYBEAN MEAL Futures:
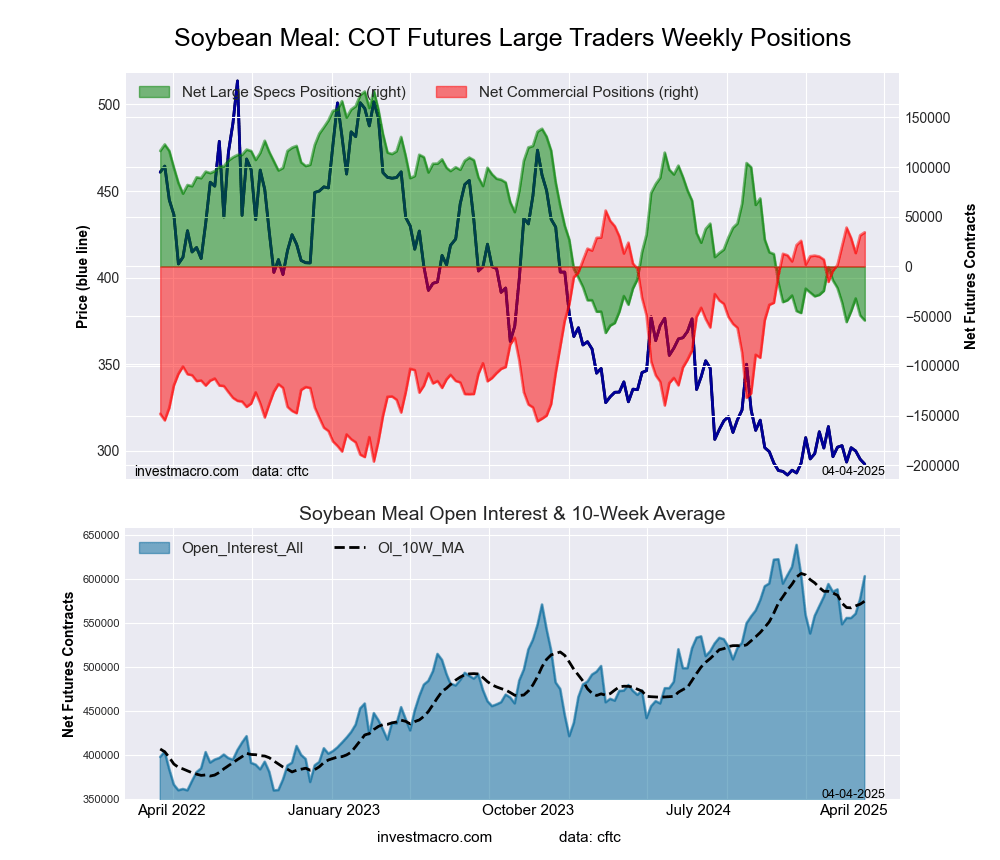 The SOYBEAN MEAL large speculator standing this week totaled a net position of -54,300 contracts in the data reported through Tuesday. This was a weekly lowering of -5,022 contracts from the previous week which had a total of -49,278 net contracts.
This week’s current strength score (the trader positioning range over the past three years, measured from 0 to 100) shows the speculators are currently Bearish-Extreme with a score of 5.1 percent. The commercials are Bullish-Extreme with a score of 91.3 percent and the small traders (not shown in chart) are Bearish with a score of 45.3 percent.
Price Trend-Following Model: Weak Uptrend
Our weekly trend-following model classifies the current market price position as: Weak Uptrend.
| SOYBEAN MEAL Futures Statistics | SPECULATORS | COMMERCIALS | SMALL TRADERS |
| – Percent of Open Interest Longs: | 17.9 | 50.0 | 8.5 |
| – Percent of Open Interest Shorts: | 26.9 | 44.3 | 5.2 |
| – Net Position: | -54,300 | 34,382 | 19,918 |
| – Gross Longs: | 108,052 | 301,211 | 51,126 |
| – Gross Shorts: | 162,352 | 266,829 | 31,208 |
| – Long to Short Ratio: | 0.7 to 1 | 1.1 to 1 | 1.6 to 1 |
| NET POSITION TREND: | |||
| – Strength Index Score (3 Year Range Pct): | 5.1 | 91.3 | 45.3 |
| – Strength Index Reading (3 Year Range): | Bearish-Extreme | Bullish-Extreme | Bearish |
| NET POSITION MOVEMENT INDEX: | |||
| – 6-Week Change in Strength Index: | -13.4 | 13.0 | -0.9 |
LIVE CATTLE Futures:
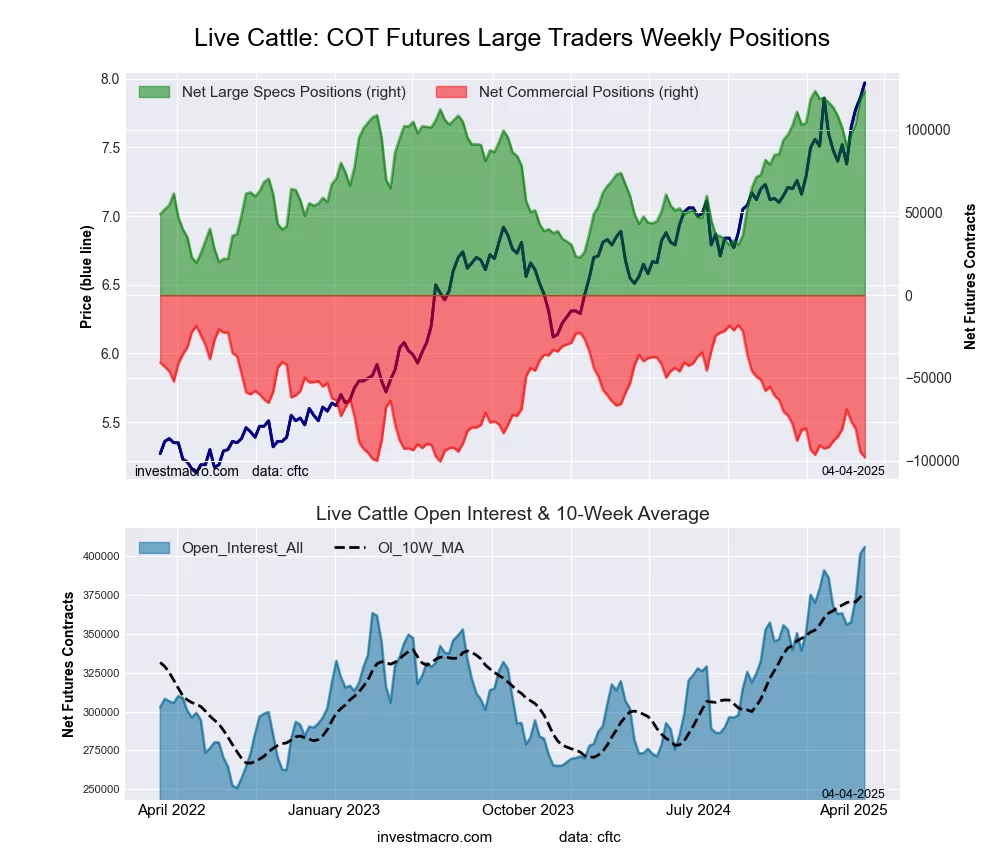 The LIVE CATTLE large speculator standing this week totaled a net position of 123,646 contracts in the data reported through Tuesday. This was a weekly lift of 5,659 contracts from the previous week which had a total of 117,987 net contracts.
This week’s current strength score (the trader positioning range over the past three years, measured from 0 to 100) shows the speculators are currently Bullish-Extreme with a score of 100.0 percent. The commercials are Bearish-Extreme with a score of 3.0 percent and the small traders (not shown in chart) are Bearish-Extreme with a score of 7.5 percent.
Price Trend-Following Model: Uptrend
Our weekly trend-following model classifies the current market price position as: Uptrend.
| LIVE CATTLE Futures Statistics | SPECULATORS | COMMERCIALS | SMALL TRADERS |
| – Percent of Open Interest Longs: | 49.3 | 26.2 | 7.9 |
| – Percent of Open Interest Shorts: | 18.8 | 50.4 | 14.2 |
| – Net Position: | 123,646 | -97,973 | -25,673 |
| – Gross Longs: | 200,105 | 106,511 | 31,867 |
| – Gross Shorts: | 76,459 | 204,484 | 57,540 |
| – Long to Short Ratio: | 2.6 to 1 | 0.5 to 1 | 0.6 to 1 |
| NET POSITION TREND: | |||
| – Strength Index Score (3 Year Range Pct): | 100.0 | 3.0 | 7.5 |
| – Strength Index Reading (3 Year Range): | Bullish-Extreme | Bearish-Extreme | Bearish-Extreme |
| NET POSITION MOVEMENT INDEX: | |||
| – 6-Week Change in Strength Index: | 14.8 | -15.1 | -9.7 |
LEAN HOGS Futures:
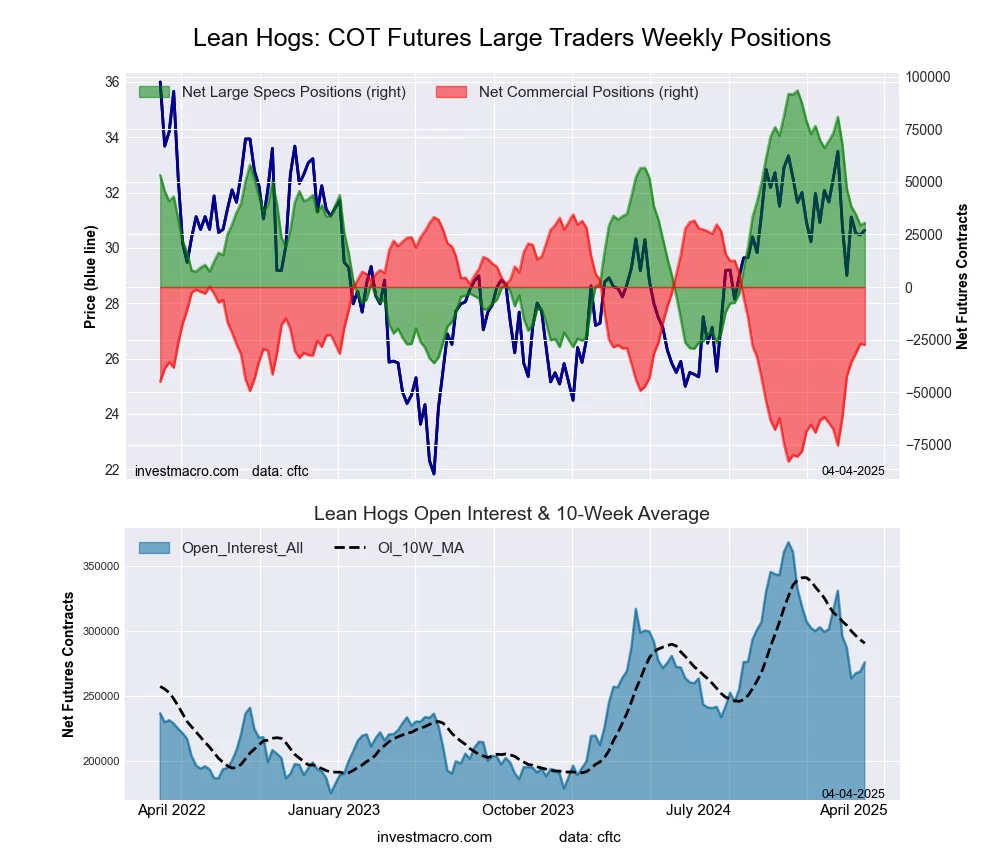 The LEAN HOGS large speculator standing this week totaled a net position of 30,477 contracts in the data reported through Tuesday. This was a weekly increase of 1,088 contracts from the previous week which had a total of 29,389 net contracts.
This week’s current strength score (the trader positioning range over the past three years, measured from 0 to 100) shows the speculators are currently Bullish with a score of 51.4 percent. The commercials are Bearish with a score of 47.3 percent and the small traders (not shown in chart) are Bullish with a score of 59.1 percent.
Price Trend-Following Model: Strong Downtrend
Our weekly trend-following model classifies the current market price position as: Strong Downtrend.
| LEAN HOGS Futures Statistics | SPECULATORS | COMMERCIALS | SMALL TRADERS |
| – Percent of Open Interest Longs: | 34.4 | 36.7 | 6.7 |
| – Percent of Open Interest Shorts: | 23.4 | 46.6 | 7.8 |
| – Net Position: | 30,477 | -27,410 | -3,067 |
| – Gross Longs: | 94,942 | 101,264 | 18,487 |
| – Gross Shorts: | 64,465 | 128,674 | 21,554 |
| – Long to Short Ratio: | 1.5 to 1 | 0.8 to 1 | 0.9 to 1 |
| NET POSITION TREND: | |||
| – Strength Index Score (3 Year Range Pct): | 51.4 | 47.3 | 59.1 |
| – Strength Index Reading (3 Year Range): | Bullish | Bearish | Bullish |
| NET POSITION MOVEMENT INDEX: | |||
| – 6-Week Change in Strength Index: | -38.9 | 40.8 | 14.8 |
COTTON Futures:
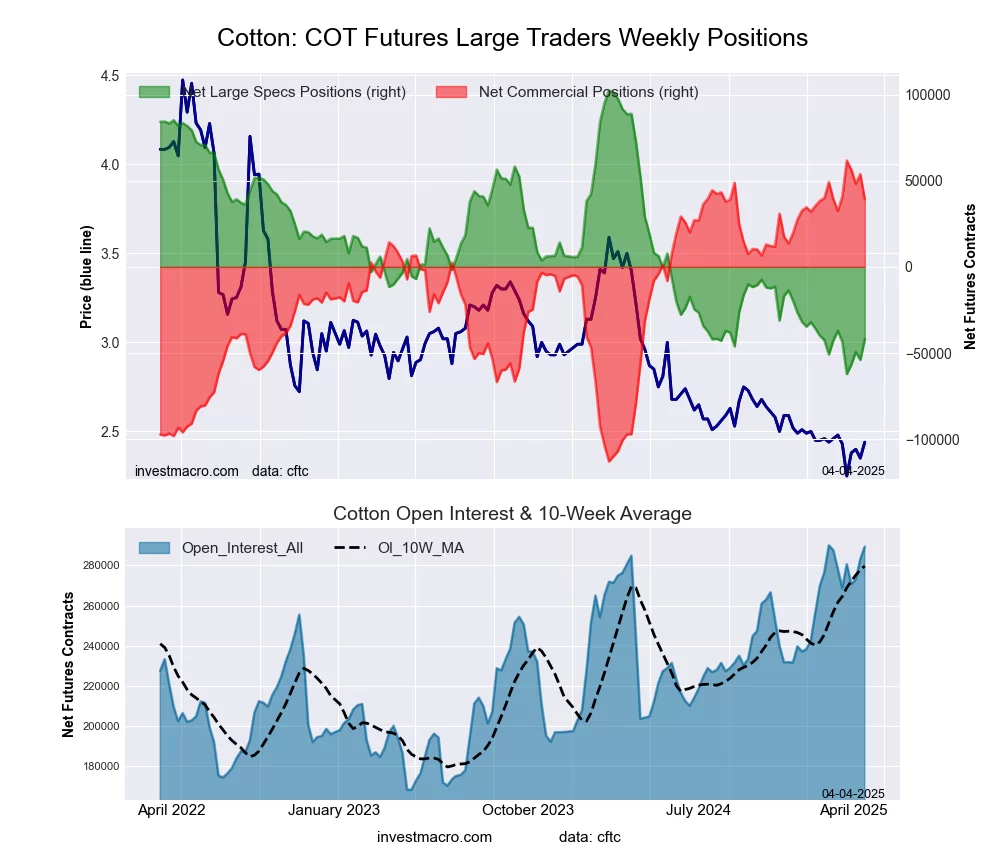 The COTTON large speculator standing this week totaled a net position of -41,979 contracts in the data reported through Tuesday. This was a weekly advance of 12,027 contracts from the previous week which had a total of -54,006 net contracts.
This week’s current strength score (the trader positioning range over the past three years, measured from 0 to 100) shows the speculators are currently Bearish-Extreme with a score of 12.3 percent. The commercials are Bullish-Extreme with a score of 87.2 percent and the small traders (not shown in chart) are Bearish with a score of 33.5 percent.
Price Trend-Following Model: Strong Downtrend
Our weekly trend-following model classifies the current market price position as: Strong Downtrend.
| COTTON Futures Statistics | SPECULATORS | COMMERCIALS | SMALL TRADERS |
| – Percent of Open Interest Longs: | 24.4 | 49.6 | 5.0 |
| – Percent of Open Interest Shorts: | 38.9 | 36.0 | 4.1 |
| – Net Position: | -41,979 | 39,267 | 2,712 |
| – Gross Longs: | 70,529 | 143,531 | 14,587 |
| – Gross Shorts: | 112,508 | 104,264 | 11,875 |
| – Long to Short Ratio: | 0.6 to 1 | 1.4 to 1 | 1.2 to 1 |
| NET POSITION TREND: | |||
| – Strength Index Score (3 Year Range Pct): | 12.3 | 87.2 | 33.5 |
| – Strength Index Reading (3 Year Range): | Bearish-Extreme | Bullish-Extreme | Bearish |
| NET POSITION MOVEMENT INDEX: | |||
| – 6-Week Change in Strength Index: | -3.0 | 3.9 | -11.9 |
COCOA Futures:
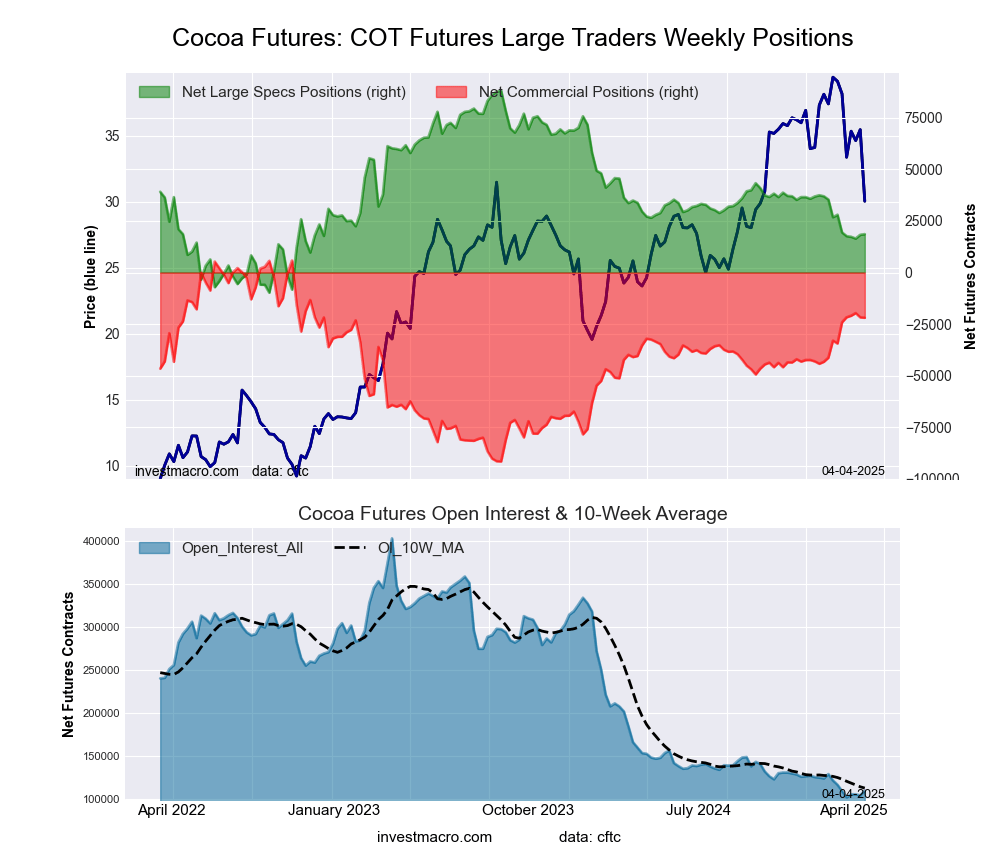 The COCOA large speculator standing this week totaled a net position of 18,601 contracts in the data reported through Tuesday. This was a weekly boost of 323 contracts from the previous week which had a total of 18,278 net contracts.
This week’s current strength score (the trader positioning range over the past three years, measured from 0 to 100) shows the speculators are currently Bearish with a score of 28.9 percent. The commercials are Bullish with a score of 71.5 percent and the small traders (not shown in chart) are Bullish with a score of 52.9 percent.
Price Trend-Following Model: Strong Downtrend
Our weekly trend-following model classifies the current market price position as: Strong Downtrend.
| COCOA Futures Statistics | SPECULATORS | COMMERCIALS | SMALL TRADERS |
| – Percent of Open Interest Longs: | 28.2 | 44.1 | 9.4 |
| – Percent of Open Interest Shorts: | 11.1 | 64.2 | 6.4 |
| – Net Position: | 18,601 | -21,956 | 3,355 |
| – Gross Longs: | 30,747 | 48,182 | 10,295 |
| – Gross Shorts: | 12,146 | 70,138 | 6,940 |
| – Long to Short Ratio: | 2.5 to 1 | 0.7 to 1 | 1.5 to 1 |
| NET POSITION TREND: | |||
| – Strength Index Score (3 Year Range Pct): | 28.9 | 71.5 | 52.9 |
| – Strength Index Reading (3 Year Range): | Bearish | Bullish | Bullish |
| NET POSITION MOVEMENT INDEX: | |||
| – 6-Week Change in Strength Index: | -9.6 | 12.8 | -33.5 |
WHEAT Futures:
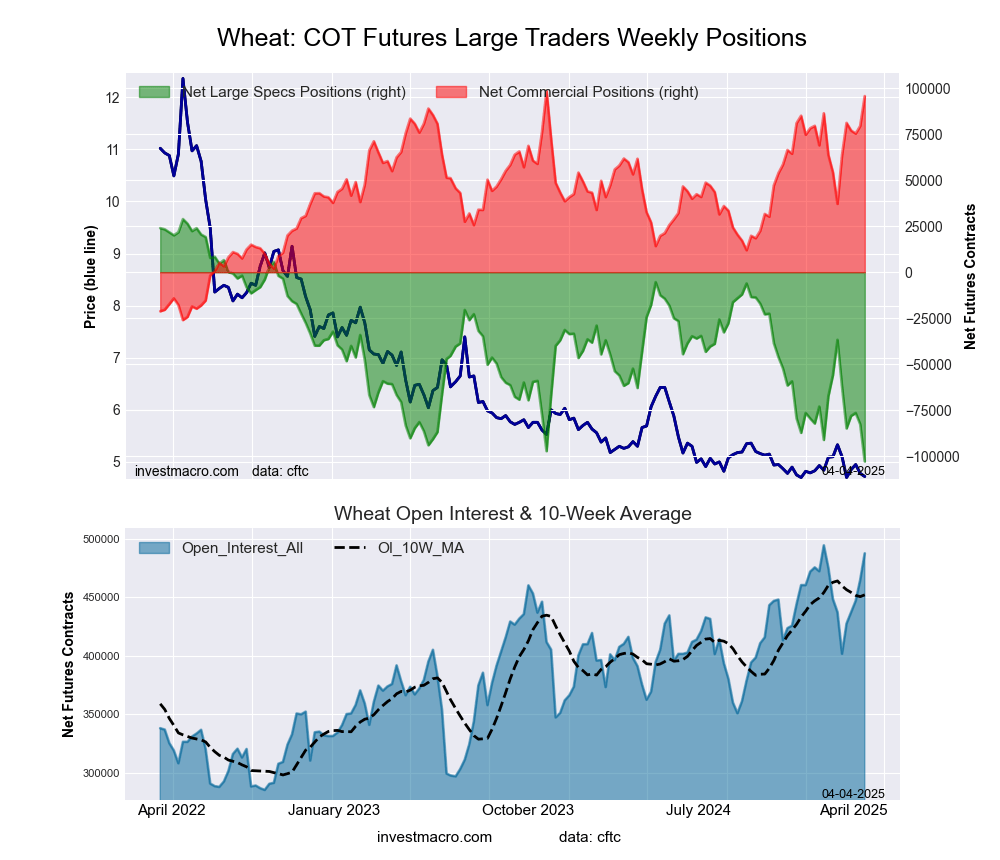 The WHEAT large speculator standing this week totaled a net position of -102,800 contracts in the data reported through Tuesday. This was a weekly decrease of -20,252 contracts from the previous week which had a total of -82,548 net contracts.
This week’s current strength score (the trader positioning range over the past three years, measured from 0 to 100) shows the speculators are currently Bearish-Extreme with a score of 0.0 percent. The commercials are Bullish-Extreme with a score of 97.6 percent and the small traders (not shown in chart) are Bullish-Extreme with a score of 96.4 percent.
Price Trend-Following Model: Weak Uptrend
Our weekly trend-following model classifies the current market price position as: Weak Uptrend.
| WHEAT Futures Statistics | SPECULATORS | COMMERCIALS | SMALL TRADERS |
| – Percent of Open Interest Longs: | 24.5 | 37.4 | 8.3 |
| – Percent of Open Interest Shorts: | 45.6 | 17.8 | 6.8 |
| – Net Position: | -102,800 | 95,636 | 7,164 |
| – Gross Longs: | 119,598 | 182,312 | 40,256 |
| – Gross Shorts: | 222,398 | 86,676 | 33,092 |
| – Long to Short Ratio: | 0.5 to 1 | 2.1 to 1 | 1.2 to 1 |
| NET POSITION TREND: | |||
| – Strength Index Score (3 Year Range Pct): | 0.0 | 97.6 | 96.4 |
| – Strength Index Reading (3 Year Range): | Bearish-Extreme | Bullish-Extreme | Bullish-Extreme |
| NET POSITION MOVEMENT INDEX: | |||
| – 6-Week Change in Strength Index: | -50.2 | 47.0 | 41.6 |
Article By InvestMacro – Receive our weekly COT Newsletter
*COT Report: The COT data, released weekly to the public each Friday, is updated through the most recent Tuesday (data is 3 days old) and shows a quick view of how large speculators or non-commercials (for-profit traders) were positioned in the futures markets.
The CFTC categorizes trader positions according to commercial hedgers (traders who use futures contracts for hedging as part of the business), non-commercials (large traders who speculate to realize trading profits) and nonreportable traders (usually small traders/speculators) as well as their open interest (contracts open in the market at time of reporting). See CFTC criteria here.