
By RoboForex Analytical Department
The AUD/USD pair rebounded to 0.6199 on Tuesday, recovering some losses. Earlier in the week, the Australian dollar tested multi-year lows as investors distanced themselves from riskier assets amid concerns over US tariffs on Canada, Mexico, and China.
A reprieve came as US President Donald Trump delayed the implementation of tariffs on Canada and Mexico for one month while negotiating with both countries. This pause improved sentiment for risk currencies, including the Australian dollar.
Key factors influencing AUD/USD
Despite this temporary relief, uncertainty remains, particularly regarding China, Australia’s largest trading partner. The newly announced US tariffs on Chinese goods take effect today, which could have significant economic consequences. Any updates related to China directly impact Australia’s economy and currency movements.
Adding to the uncertainty, Trump is set to meet with Chinese President Xi Jinping this week. While China is keen to avoid escalating trade tensions, the US administration will likely use the situation strategically to its advantage. The outcome of these discussions could shape risk sentiment in global markets.
Free Reports:
 Get our Weekly Commitment of Traders Reports - See where the biggest traders (Hedge Funds and Commercial Hedgers) are positioned in the futures markets on a weekly basis.
 Download Our Metatrader 4 Indicators – Put Our Free MetaTrader 4 Custom Indicators on your charts when you join our Weekly Newsletter
On the domestic front, Australia’s trade balance data for December is scheduled for release on Thursday. This report will provide insights into the health of Australia’s export-driven economy and could influence the Reserve Bank of Australia’s (RBA) policy stance.
Technical analysis of AUD/USD
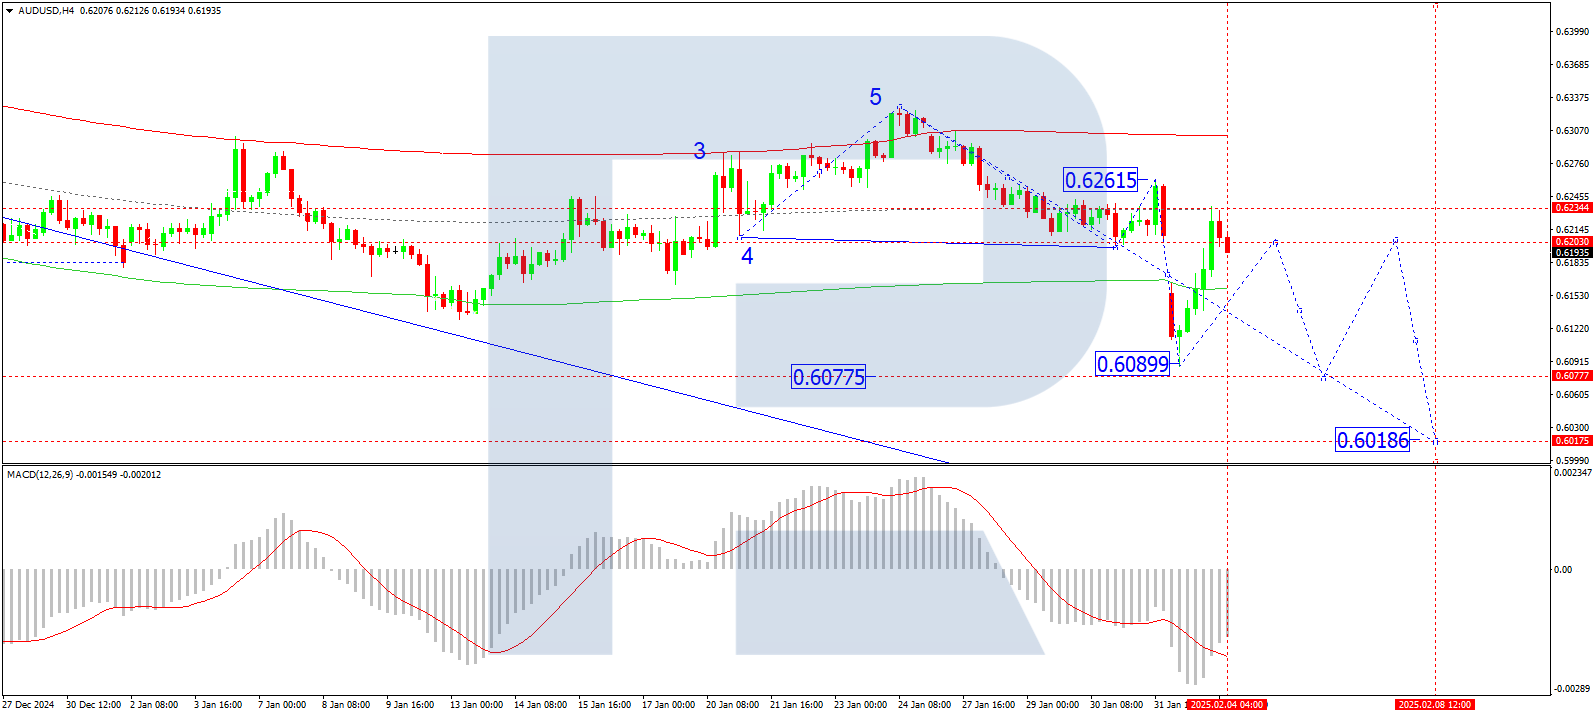
On the H4 chart, AUD/USD previously formed a downside wave to 0.6088, followed by a correction to 0.6233. Today, the market is expected to initiate another downward wave towards 0.6077. A potential corrective move back to 0.6230 may follow, forming a consolidation range. If the pair breaks upwards from this range, another correction towards 0.6290 is possible. However, if it breaks downwards, the downward wave to 0.6077 will likely continue. The MACD indicator supports this scenario, with its signal line positioned above the zero mark but pointing sharply downwards, indicating strong bearish momentum.
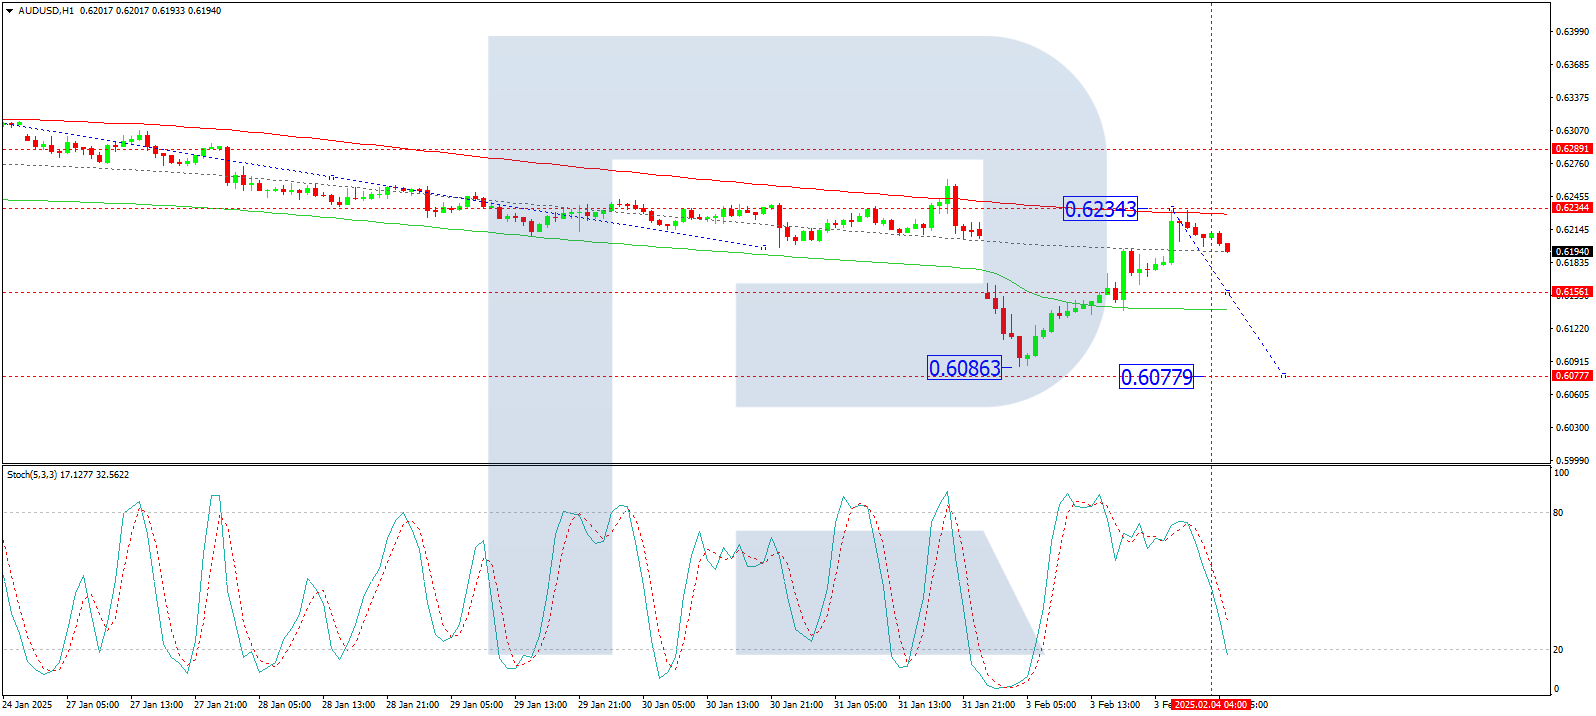
On the H1 chart, AUD/USD established a consolidation range near 0.6160 before breaking upwards to complete a correction at 0.6230. The next move is expected to be a new downward wave targeting 0.6150. If this level is breached, the pair could extend losses towards 0.6077. The Stochastic oscillator confirms this bearish outlook, with its signal line below 80 and trending downwards towards 20, indicating growing downside pressure.
Conclusion
The Australian dollar has staged a modest recovery, but risks remain elevated due to ongoing US-China trade tensions and uncertainty surrounding Australia’s economic outlook. While short-term technical indicators suggest the potential for further downside, the key levels to watch are 0.6150 and 0.6077. Market participants will closely monitor Trump’s meeting with Xi Jinping and Australia’s trade balance data for further directional cues.
Disclaimer
Any forecasts contained herein are based on the author’s particular opinion. This analysis may not be treated as trading advice. RoboForex bears no responsibility for trading results based on trading recommendations and reviews contained herein.

- The US and European stock indices are rising again amid renewed investor interest in the AI industry. Jul 10, 2026
- USD/JPY Falls as Yen Recovers Weekly Losses Jul 10, 2026
- Crude oil prices surged sharply by 7% in reaction to the rapid escalation of the conflict in the Middle East Jul 9, 2026
- Middle East Tensions Weigh on Gold Jul 9, 2026
- Pound Awaits Tighter Policy from Bank of England Jul 8, 2026
- The United States carried out airstrikes on Iran after Iran’s attacked tankers in the Strait of Hormuz. The RBNZ raised the interest rate to 2.5% Jul 8, 2026
- RoboForex Brings Full-Scale Trading to Telegram Jul 7, 2026
- Your Bourse Integrates TradingView Charts and Trading Platform Library with Trade Server Jul 7, 2026
- Yen Still Under Pressure: Markets Await Action from Authorities Jul 7, 2026
- Germany’s DAX Index has updated its all‑time high. OPEC+ countries have agreed to increase production Jul 7, 2026