
By RoboForex Analytical Department
The USD/CAD pair surged above 1.4760 on Monday, reaching its highest level since April 2003. This sharp rise came in response to the US government’s decision to impose 25% tariffs on Canadian imports, significantly impacting the Loonie.
Key factors driving USD/CAD
The White House framed the tariffs as part of a broader policy to combat illegal immigration and illicit trade. However, the economic repercussions are immediate, particularly for Canada’s commodity-driven economy.
A separate 10% tariff has been applied to Canadian energy exports, a somewhat lower rate than initially expected. Similar tariffs were also introduced for Mexico, while Chinese goods now face a 10% import duty. In response, all affected countries have signalled plans for retaliatory measures.
For Canada, the new trade barriers pose a significant threat. With the economy heavily reliant on exports, reduced foreign demand could lower foreign currency inflows and further weaken the CAD.
Free Reports:
 Download Our Metatrader 4 Indicators – Put Our Free MetaTrader 4 Custom Indicators on your charts when you join our Weekly Newsletter
 Get our Weekly Commitment of Traders Reports - See where the biggest traders (Hedge Funds and Commercial Hedgers) are positioned in the futures markets on a weekly basis.
Investors are now turning their attention to upcoming Canadian GDP data. December’s figures are expected to show 0.2% growth, translating to an annual expansion of 1.4%, aligning with the Bank of Canada’s (BoC) projections.
The BoC recently cut its benchmark interest rate by 25 basis points to 3.0% per annum and announced an end to its quantitative easing programme. Additionally, the central bank has indicated plans to resume asset purchases in March, further weighing on the Canadian dollar.
USD/CAD technical analysis
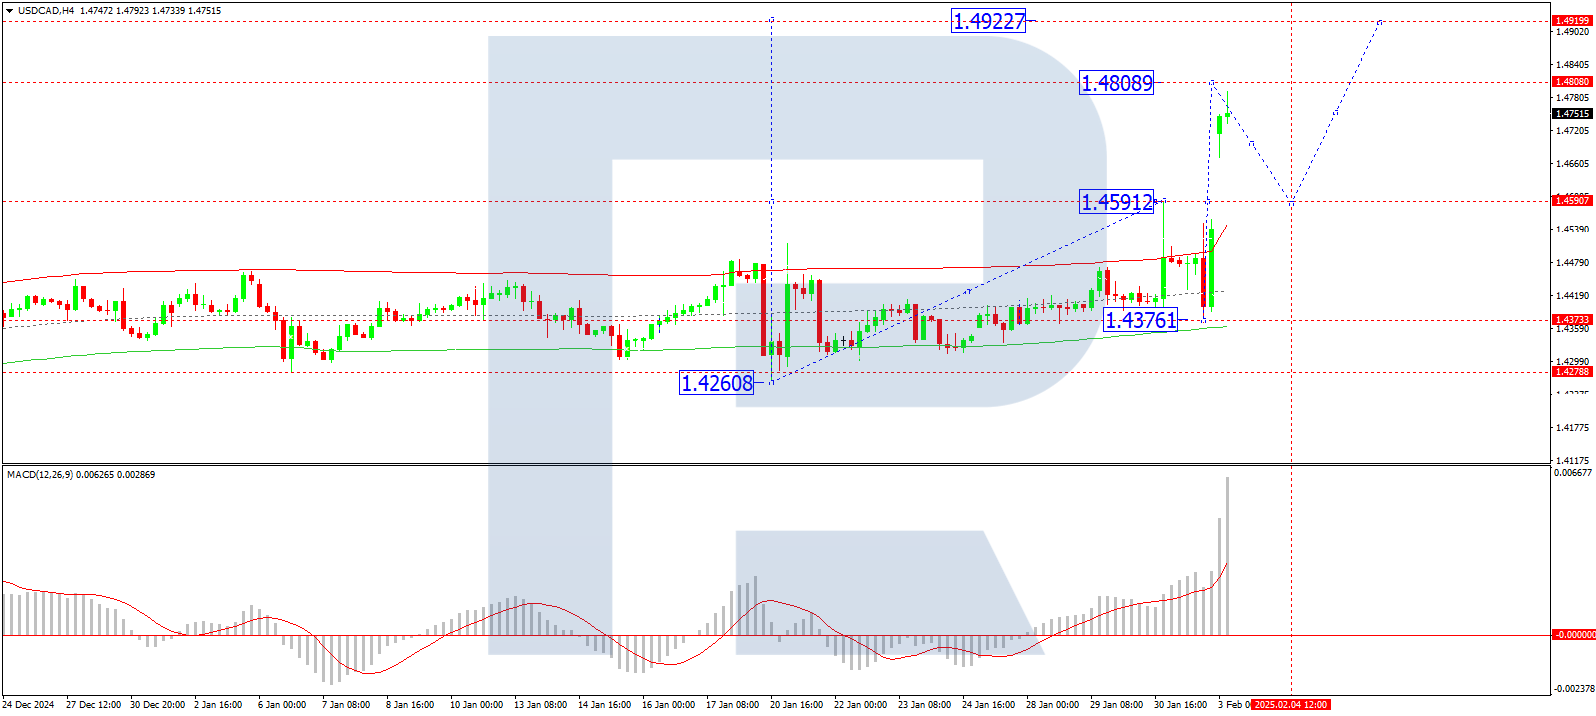
On the H4 chart, USD/CAD broke through 1.4591 and continues its upward wave. With this breakout, the path towards 1.4808 is now open, making it the next local target. After reaching this level, a correction towards 1.4591 is possible before a renewed growth wave targets 1.4919. The MACD indicator supports this outlook, with its signal line above zero and pointing sharply upwards, confirming bullish momentum.
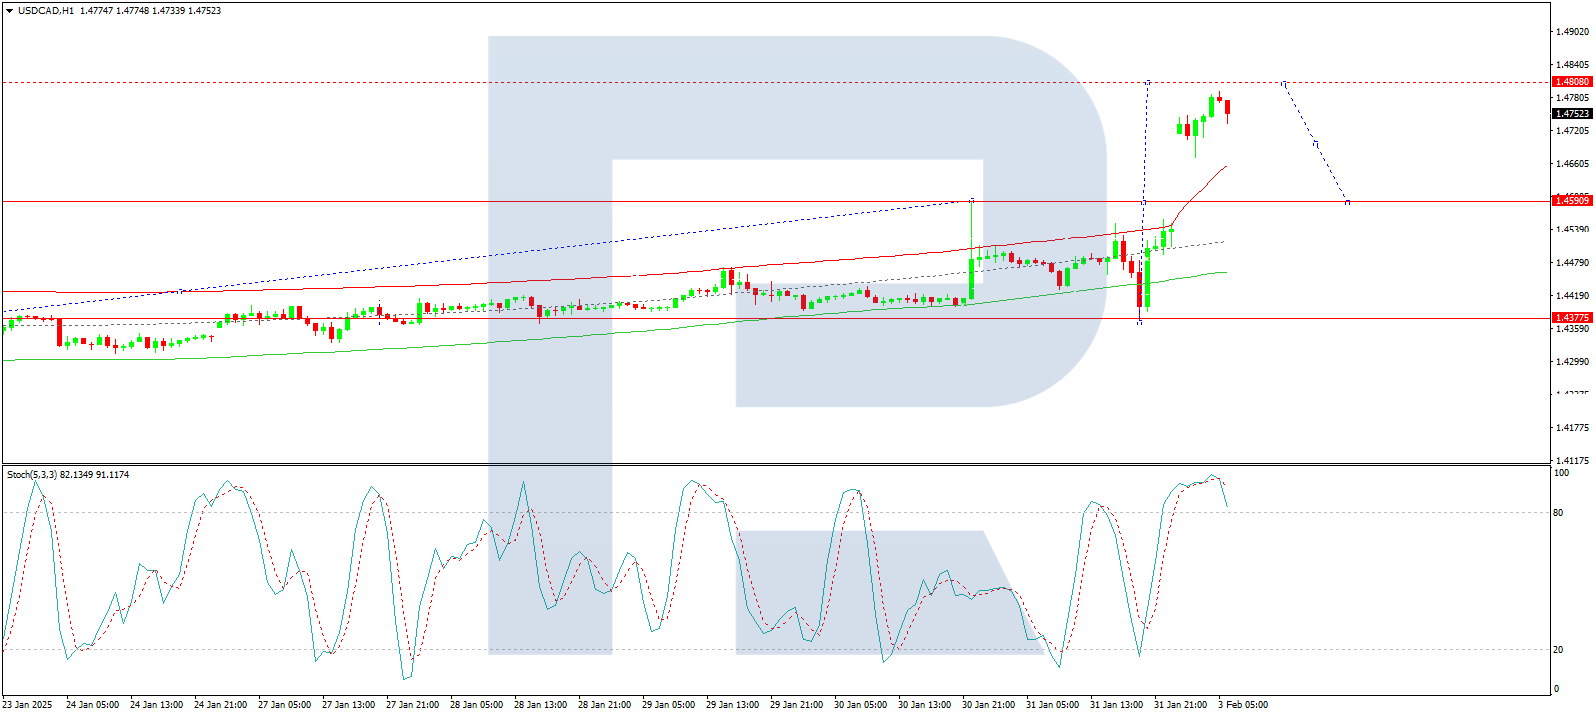
On the H1 chart, the pair has extended its upward structure to 1.4742 and is now consolidating around this level. A breakout from the consolidation range to the upside would signal a move towards 1.4808. However, if the pair breaks downwards, a correction to 1.4591 is possible before another attempt at the 1.4808 level. The Stochastic oscillator indicates a potential short-term pullback, with its signal line above 80 and preparing to decline towards 20.
Conclusion
The Canadian dollar remains under significant pressure as US trade tariffs drive uncertainty over future export demand. While technical indicators suggest further upside for USD/CAD towards 1.4808, a corrective move towards 1.4591 is also possible before another wave of growth. The market’s next key focus will be Canadian GDP data and any further developments on trade retaliation from affected countries, both of which could impact the pair’s trajectory.
Disclaimer
Any forecasts contained herein are based on the author’s particular opinion. This analysis may not be treated as trading advice. RoboForex bears no responsibility for trading results based on trading recommendations and reviews contained herein.

- GBP/USD at Month’s Lows: The Outlook Remains Weak Jul 29, 2026
- Crude oil falls below $80 per barrel. Australia sees inflation slowdown Jul 29, 2026
- The US Tech sector hit by sell‑off. Oil prices decline on renewed negotiations Jul 28, 2026
- Gold Declines, Focus on Fed and Falling Oil Prices Jul 28, 2026
- This week will be one of the most crowded for central‑bank meetings Jul 27, 2026
- EUR/USD Ahead of a Key Week: Holding Near Lows Jul 27, 2026
- COT Metals Charts: Weekly Speculator Changes led by Copper Jul 26, 2026
- COT Bonds Charts: Speculator Bets led by SOFR 3-Months & 5-Year Bonds Jul 26, 2026
- COT Energy Charts: Weekly Speculator Bets led by WTI Crude & Natural Gas Jul 26, 2026
- COT Soft Commodities Charts: Weekly Speculator Bets led by Corn & Soybeans Jul 26, 2026