By JustMarkets
At yesterday’s stock market close, the Dow Jones Index (US30) closed down by 0.67%, while the S&P 500 Index (US500) fell by 0.64%. The NASDAQ Technology Index (US100) closed negative by 0.55% on Thursday.
The latest US GDP data showed that the economy grew by 2.4% for the second quarter after growing 2.0% in the first quarter. Analysts had expected growth of 1.8%. Gross Domestic Product increased due to solid consumer spending and robust business investment. Combined with other data showing stronger than expected durable goods orders and a decline in unemployment claims, boosted confidence that the Federal Reserve can curb inflation and avoid a recession.
Meta Platforms (META) rose more than 4% after the social media giant reported second-quarter guidance and results that beat Wall Street estimates, driven by strong advertising growth. UBS raised its target on META shares to $400 from $335. Shares of eBay (EBAY), meanwhile, fell by 10% after its earnings forecast for the current quarter missed analysts’ estimates and overshadowed better-than-expected second-quarter results.
Equity markets in Europe were mostly up yesterday. Germany’s DAX (DE40) rose by 1.70%, France’s CAC 40 (FR40) gained 2.05%, Spain’s IBEX 35 (ES35) added 1.08%, and the UK’s FTSE 100 (UK100) closed positive by 0.21%.
The European Central Bank raised interest rates by 25 basis points to 4.25% in line with expectations while emphasizing that inflation is expected to remain high for a longer period despite the recent decline. During the press conference, Lagarde emphasized the weaker economic outlook for the euro area economy in the near term but remained optimistic about a recovery in growth in the medium term. Lagarde remained evasive when asked about the possibility of a rate hike in September. This is a dovish sign, given that the ECB president has previously been quite hawkish when pushing for future rate hikes.
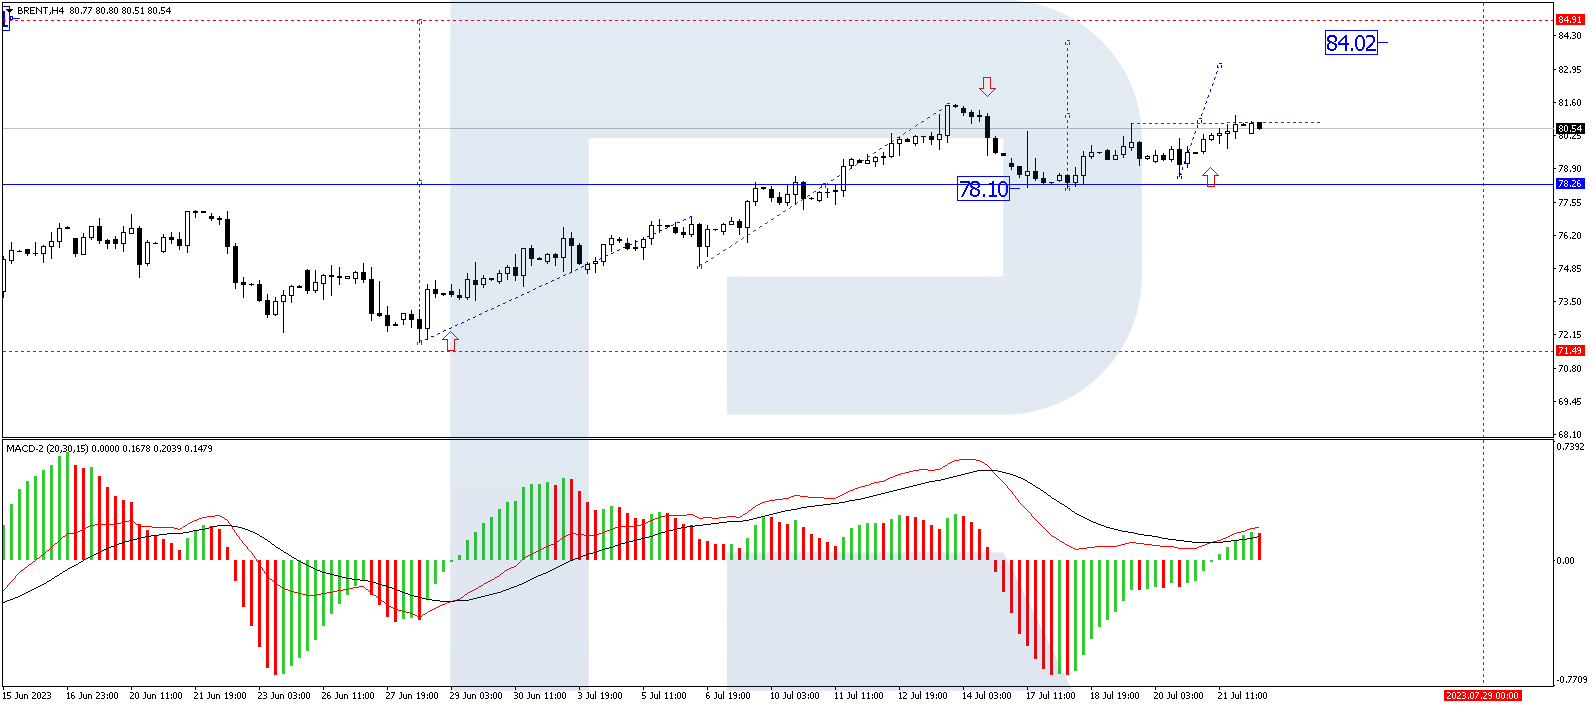
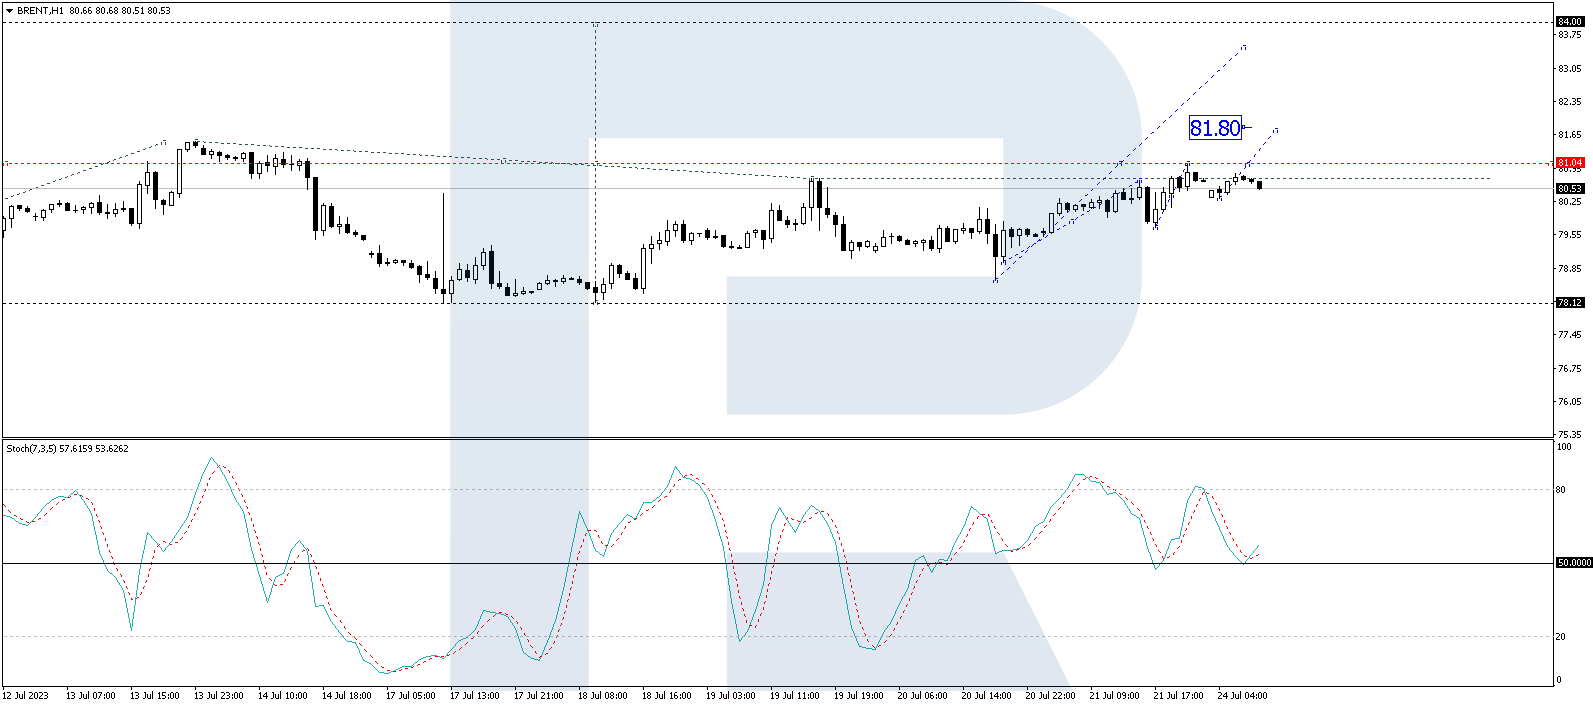
On Thursday, gold posted its sharpest one-day drop since late June, reacting to the US Federal Reserve getting back on the path of monetary tightening by announcing a 25 basis point rate hike in July and again pledging to stick to a hawkish policy to bring inflation to its long-term 2% target. Also influential was the European Central Bank’s quarter-point rate hike and a signal that the ECB may pause in September, a potentially dovish development that pushed the dollar higher against the euro, exacerbating gold’s decline.
Asian markets were predominantly rising yesterday. Japan’s Nikkei 225 (JP225) rose by 0.68%, China’s FTSE China A50 (CHA50) gained 0.20%, Hong Kong’s Hang Seng (HK50) ended the day up by 1.41%, and Australia’s S&P/ASX 200 (AU200) ended Thursday positive by 0.73%. At the open on Friday, Japan’s Nikkei 225 index (JP225) suffered sharp losses after somewhat aggressive statements from the Bank of Japan, while Chinese stocks posted gains on hopes of additional stimulus measures.
Japanese government bond yields rose sharply on Friday, hitting the top end of the Bank of Japan’s benchmark range. The BOJ kept interest rates ultra-low on Friday and said that while it will continue yield curve control (YCC) operations, it will manage the yield curve with “greater flexibility.” The statement said it is appropriate to enhance the sustainability of monetary policy easing under the current framework by conducting more flexible yield curve control and responding promptly to both upside and downside risks to economic activity and prices in Japan. The move marks a step toward potentially ending the ultra-soft monetary conditions that Japanese equities have enjoyed for nearly a decade.
Australian retail sales unexpectedly fell in June, suggesting that consumers are easing off in response to 12 interest rate hikes by the Reserve Bank of Australia (RBA). Sales fell by 0.8% from the previous month.
China’s top housing official has increased pressure on financial regulators and lenders to step up efforts to revive the country’s struggling real estate sector.
S&P 500 (F)(US500) 4,537.41 −29.34 (−0.64%)
Dow Jones (US30) 35,282.72 −237.40 (−0.67%)
DAX (DE40) 16,406.03 +274.57 (+1.70%)
FTSE 100 (UK100) 7,692.76 +15.87 (+0.21%)
USD Index 101.81 +0.93 (+0.92%)
- – Japan Tokyo Core CPI (m/m) at 02:30 (GMT+3);
- – Japan BoJ Interest Rate Decision at 06:00 (GMT+3);
- – Japan BoJ Monetary Policy Statement at 06:00 (GMT+3);
- – Japan BoJ Outlook Report at 06:00 (GMT+3);
- – Japan BoJ Press Conference at 09:00 (GMT+3);
- – Germany Consumer Price Index (m/m) at 15:00 (GMT+3);
- – Canada GDP (m/m) at 15:30 (GMT+3);
- – US PCE Price index (m/m) at 15:30 (GMT+3);
- – US Michigan Consumer Sentiment (m/m) at 17:00 (GMT+3).
By JustMarkets
This article reflects a personal opinion and should not be interpreted as an investment advice, and/or offer, and/or a persistent request for carrying out financial transactions, and/or a guarantee, and/or a forecast of future events.