
By InvestMacro
Here are the latest charts and statistics for the Commitment of Traders (COT) reports data published by the Commodities Futures Trading Commission (CFTC).
The latest COT data is updated through Tuesday August 8th and shows a quick view of how large traders (for-profit speculators and commercial hedgers) were positioned in the futures markets.
Weekly Speculator Changes led by SOFR 3-Months & Ultra 10-Year Bonds
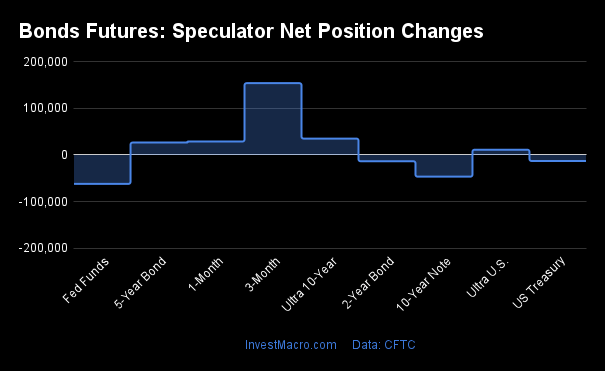
The COT bond market speculator bets were mixed this week as four out of the eight bond markets we cover had higher positioning while the other four markets had lower speculator contracts.
Leading the gains for the bond markets was the SOFR 3-Months (154,318 contracts) with the Ultra 10-Year Bonds (35,286 contracts), the 5-Year Bonds (26,739 contracts) and the Ultra Treasury Bonds (11,341 contracts) also showing positive weeks.
The bond markets with declines in speculator bets for the week were the Fed Funds (-62,065 contracts), the 10-Year Bonds (-46,540 contracts), the 2-Year Bonds (-13,463 contracts) and the US Treasury Bonds (-12,879 contracts) also registering lower bets on the week.
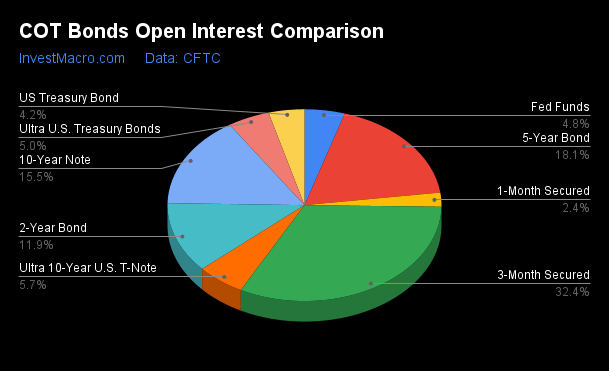
| Aug-08-2023 | OI | OI-Index | Spec-Net | Spec-Index | Com-Net | COM-Index | Smalls-Net | Smalls-Index |
|---|---|---|---|---|---|---|---|---|
| SOFR-3-Months | 10,208,505 | 98 | -54,113 | 77 | 69,346 | 23 | -15,233 | 80 |
| FedFunds | 1,496,411 | 46 | -193,341 | 23 | 200,419 | 77 | -7,078 | 77 |
| 2-Year | 3,746,749 | 100 | -1,109,126 | 3 | 1,009,336 | 96 | 99,790 | 96 |
| Long T-Bond | 1,333,067 | 89 | -199,555 | 20 | 155,116 | 66 | 44,439 | 81 |
| 10-Year | 4,872,433 | 98 | -691,726 | 15 | 673,553 | 91 | 18,173 | 77 |
| 5-Year | 5,711,857 | 100 | -1,230,307 | 2 | 1,185,876 | 98 | 44,431 | 93 |
Strength Scores led by SOFR 3-Months & Fed Funds
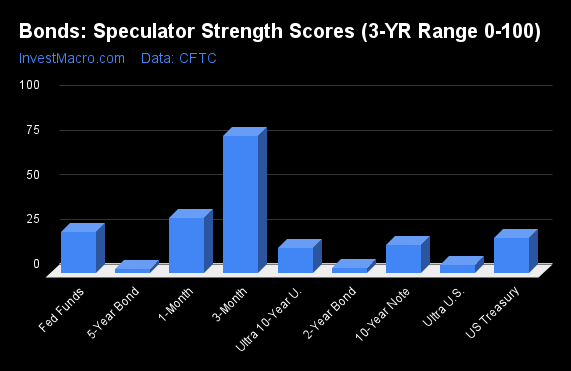
COT Strength Scores (a normalized measure of Speculator positions over a 3-Year range, from 0 to 100 where above 80 is Extreme-Bullish and below 20 is Extreme-Bearish) showed that the SOFR 3-Months (77 percent) and the Fed Funds (23 percent) lead the bond markets this week.
On the downside, the 5-Year Bonds (2 percent), the 2-Year Bonds (3 percent), the Ultra Treasury Bonds (5 percent), the Ultra 10-Year Bonds (14 percent), the 10-Year Bond (15.4 percent) and the US Treasury Bond (19.7 percent) come in at the lowest strength level currently and all are in Extreme-Bearish territory (below 20 percent).
Strength Statistics:
Fed Funds (22.7 percent) vs Fed Funds previous week (33.8 percent)
2-Year Bond (3.0 percent) vs 2-Year Bond previous week (4.1 percent)
5-Year Bond (2.0 percent) vs 5-Year Bond previous week (0.0 percent)
10-Year Bond (15.4 percent) vs 10-Year Bond previous week (19.9 percent)
Ultra 10-Year Bond (13.9 percent) vs Ultra 10-Year Bond previous week (6.7 percent)
US Treasury Bond (19.7 percent) vs US Treasury Bond previous week (23.8 percent)
Ultra US Treasury Bond (4.6 percent) vs Ultra US Treasury Bond previous week (0.0 percent)
SOFR 3-Months (76.7 percent) vs SOFR 3-Months previous week (66.1 percent)
10-Year Bonds & Ultra 10-Year Bonds top the 6-Week Strength Trends
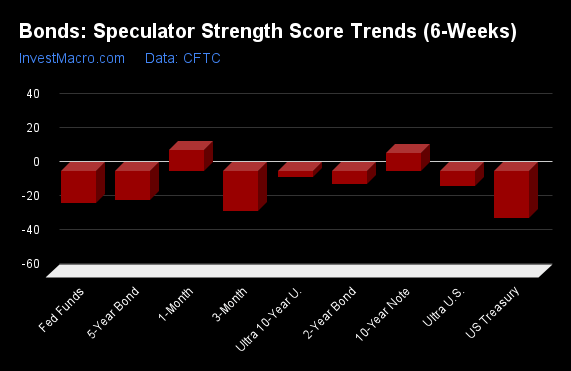
COT Strength Score Trends (or move index, calculates the 6-week changes in strength scores) showed that the 10-Year Bonds (11 percent) lead the past six weeks trends for bonds. The 2-Year Bonds (-8 percent) and the are the next highest positive movers in the latest trends data.
The US Treasury Bonds (-27 percent), the SOFR 3-Months (-23 percent) and the Fed Funds (-19 percent) lead the downside trend scores currently.
Strength Trend Statistics:
Fed Funds (-18.6 percent) vs Fed Funds previous week (-5.3 percent)
2-Year Bond (-7.7 percent) vs 2-Year Bond previous week (-5.5 percent)
5-Year Bond (-17.1 percent) vs 5-Year Bond previous week (-22.1 percent)
10-Year Bond (10.6 percent) vs 10-Year Bond previous week (10.2 percent)
Ultra 10-Year Bond (-3.8 percent) vs Ultra 10-Year Bond previous week (-10.3 percent)
US Treasury Bond (-27.4 percent) vs US Treasury Bond previous week (-27.5 percent)
Ultra US Treasury Bond (-8.6 percent) vs Ultra US Treasury Bond previous week (-21.4 percent)
SOFR 3-Months (-23.3 percent) vs SOFR 3-Months previous week (-28.5 percent)
Secured Overnight Financing Rate (3-Month) Futures:
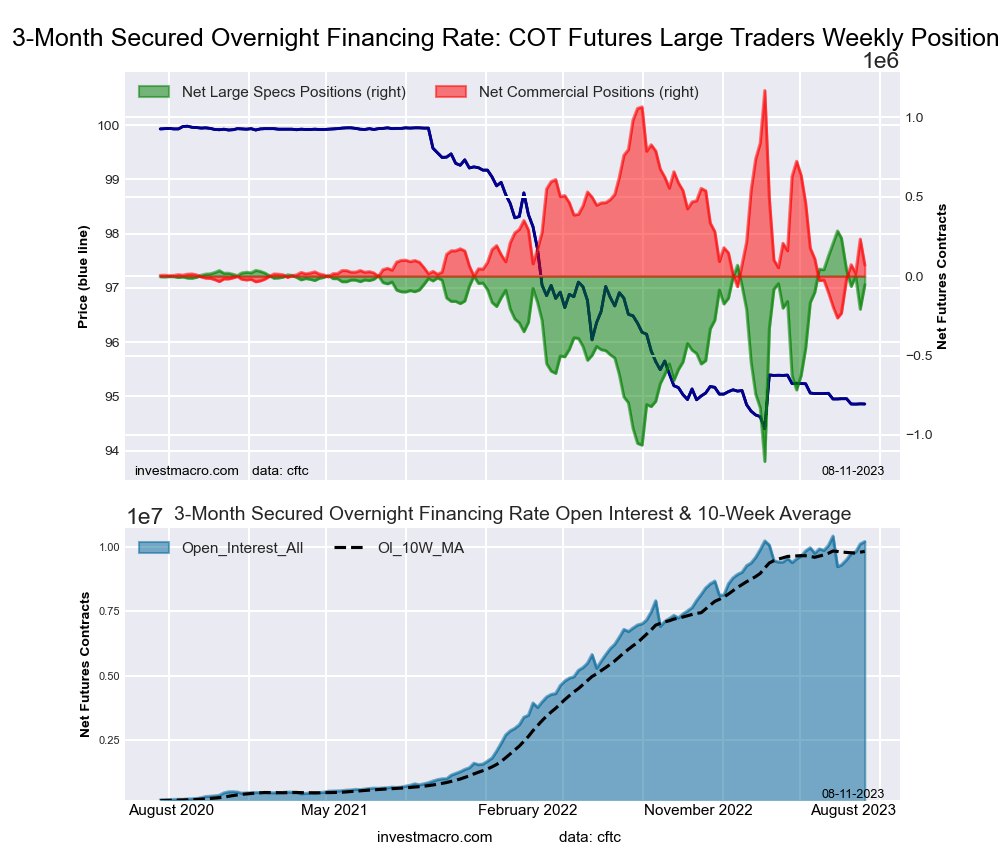 The Secured Overnight Financing Rate (3-Month) large speculator standing this week equaled a net position of -54,113 contracts in the data reported through Tuesday. This was a weekly advance of 154,318 contracts from the previous week which had a total of -208,431 net contracts.
This week’s current strength score (the trader positioning range over the past three years, measured from 0 to 100) shows the speculators are currently Bullish with a score of 76.7 percent. The commercials are Bearish with a score of 23.3 percent and the small traders (not shown in chart) are Bullish with a score of 79.5 percent.
Price Trend-Following Model: Weak Uptrend
Our weekly trend-following model classifies the current market price position as: Weak Uptrend. The current action for the model is considered to be: Hold – Maintain Long Position.
| SOFR 3-Months Statistics | SPECULATORS | COMMERCIALS | SMALL TRADERS |
| – Percent of Open Interest Longs: | 17.5 | 60.3 | 0.2 |
| – Percent of Open Interest Shorts: | 18.0 | 59.6 | 0.4 |
| – Net Position: | -54,113 | 69,346 | -15,233 |
| – Gross Longs: | 1,782,372 | 6,153,817 | 21,947 |
| – Gross Shorts: | 1,836,485 | 6,084,471 | 37,180 |
| – Long to Short Ratio: | 1.0 to 1 | 1.0 to 1 | 0.6 to 1 |
| NET POSITION TREND: | |||
| – Strength Index Score (3 Year Range Pct): | 76.7 | 23.3 | 79.5 |
| – Strength Index Reading (3 Year Range): | Bullish | Bearish | Bullish |
| NET POSITION MOVEMENT INDEX: | |||
| – 6-Week Change in Strength Index: | -23.3 | 23.3 | 2.9 |
30-Day Federal Funds Futures:
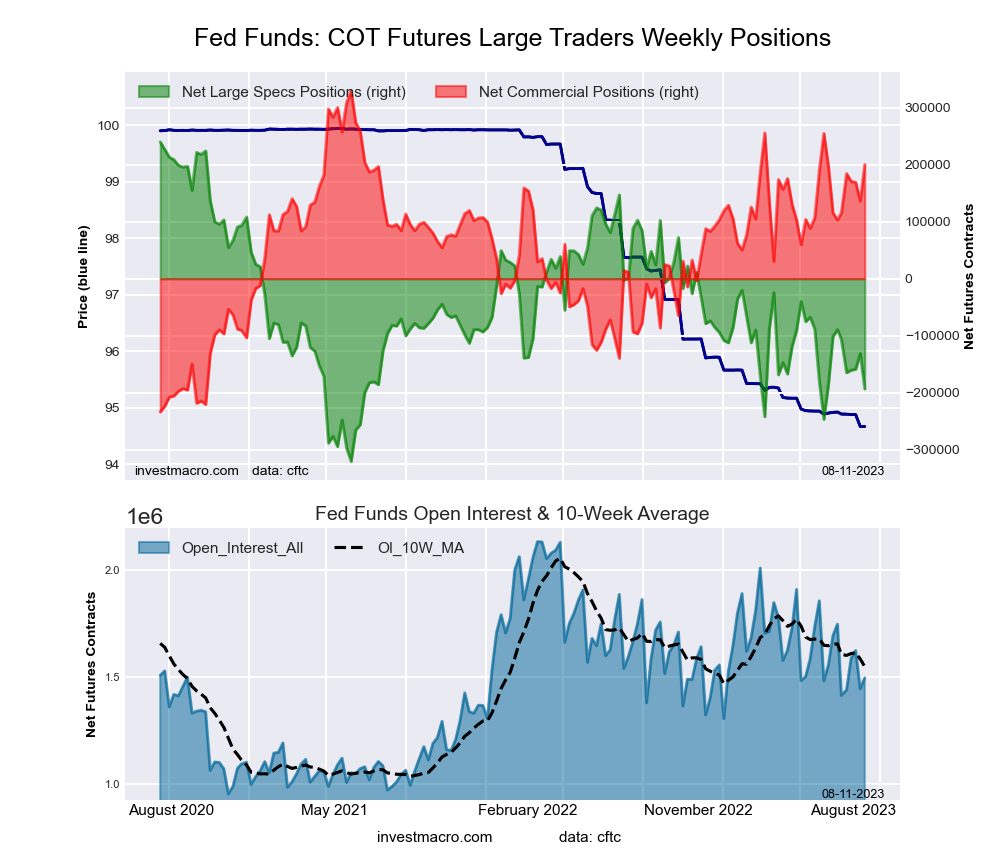 The 30-Day Federal Funds large speculator standing this week equaled a net position of -193,341 contracts in the data reported through Tuesday. This was a weekly decline of -62,065 contracts from the previous week which had a total of -131,276 net contracts.
This week’s current strength score (the trader positioning range over the past three years, measured from 0 to 100) shows the speculators are currently Bearish with a score of 22.7 percent. The commercials are Bullish with a score of 77.0 percent and the small traders (not shown in chart) are Bullish with a score of 77.1 percent.
Price Trend-Following Model: Downtrend
Our weekly trend-following model classifies the current market price position as: Downtrend. The current action for the model is considered to be: Hold – Maintain Short Position.
| 30-Day Federal Funds Statistics | SPECULATORS | COMMERCIALS | SMALL TRADERS |
| – Percent of Open Interest Longs: | 3.6 | 75.4 | 2.3 |
| – Percent of Open Interest Shorts: | 16.5 | 62.0 | 2.8 |
| – Net Position: | -193,341 | 200,419 | -7,078 |
| – Gross Longs: | 53,183 | 1,127,668 | 34,533 |
| – Gross Shorts: | 246,524 | 927,249 | 41,611 |
| – Long to Short Ratio: | 0.2 to 1 | 1.2 to 1 | 0.8 to 1 |
| NET POSITION TREND: | |||
| – Strength Index Score (3 Year Range Pct): | 22.7 | 77.0 | 77.1 |
| – Strength Index Reading (3 Year Range): | Bearish | Bullish | Bullish |
| NET POSITION MOVEMENT INDEX: | |||
| – 6-Week Change in Strength Index: | -18.6 | 17.2 | 13.8 |
2-Year Treasury Note Futures:
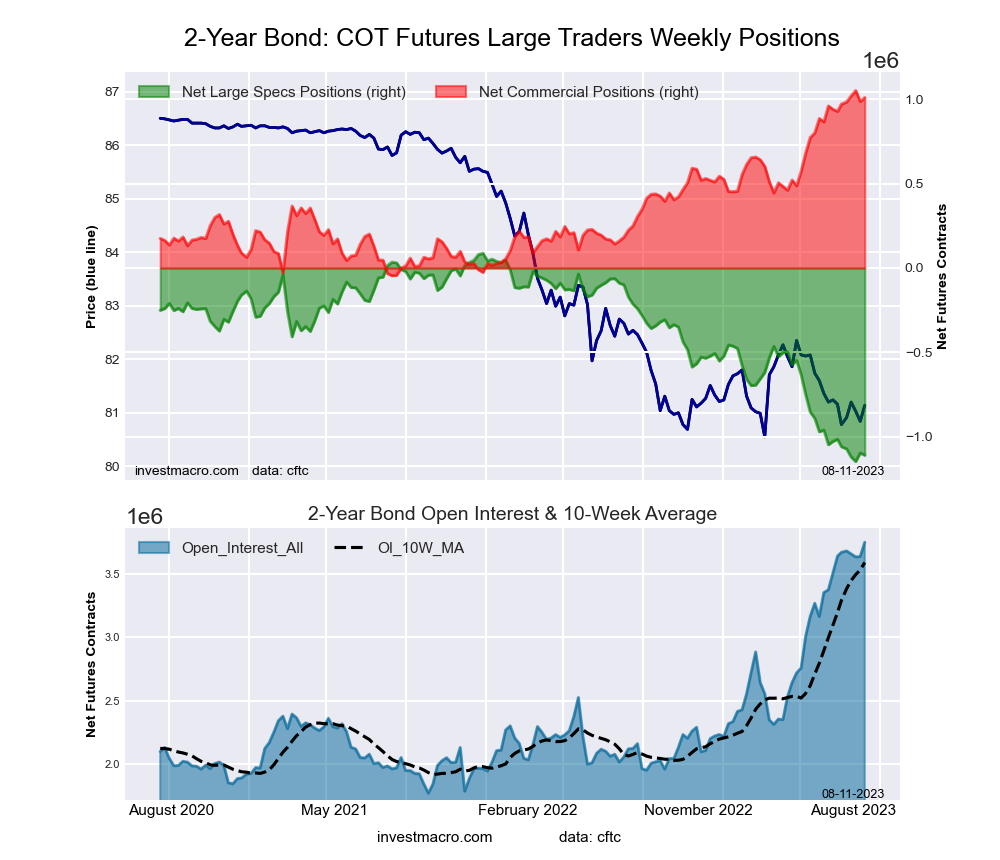 The 2-Year Treasury Note large speculator standing this week equaled a net position of -1,109,126 contracts in the data reported through Tuesday. This was a weekly lowering of -13,463 contracts from the previous week which had a total of -1,095,663 net contracts.
This week’s current strength score (the trader positioning range over the past three years, measured from 0 to 100) shows the speculators are currently Bearish-Extreme with a score of 3.0 percent. The commercials are Bullish-Extreme with a score of 96.2 percent and the small traders (not shown in chart) are Bullish-Extreme with a score of 95.7 percent.
Price Trend-Following Model: Downtrend
Our weekly trend-following model classifies the current market price position as: Downtrend. The current action for the model is considered to be: Hold – Maintain Short Position.
| 2-Year Treasury Note Statistics | SPECULATORS | COMMERCIALS | SMALL TRADERS |
| – Percent of Open Interest Longs: | 9.9 | 81.7 | 6.7 |
| – Percent of Open Interest Shorts: | 39.5 | 54.7 | 4.0 |
| – Net Position: | -1,109,126 | 1,009,336 | 99,790 |
| – Gross Longs: | 370,316 | 3,060,298 | 251,275 |
| – Gross Shorts: | 1,479,442 | 2,050,962 | 151,485 |
| – Long to Short Ratio: | 0.3 to 1 | 1.5 to 1 | 1.7 to 1 |
| NET POSITION TREND: | |||
| – Strength Index Score (3 Year Range Pct): | 3.0 | 96.2 | 95.7 |
| – Strength Index Reading (3 Year Range): | Bearish-Extreme | Bullish-Extreme | Bullish-Extreme |
| NET POSITION MOVEMENT INDEX: | |||
| – 6-Week Change in Strength Index: | -7.7 | 7.5 | 5.5 |
5-Year Treasury Note Futures:
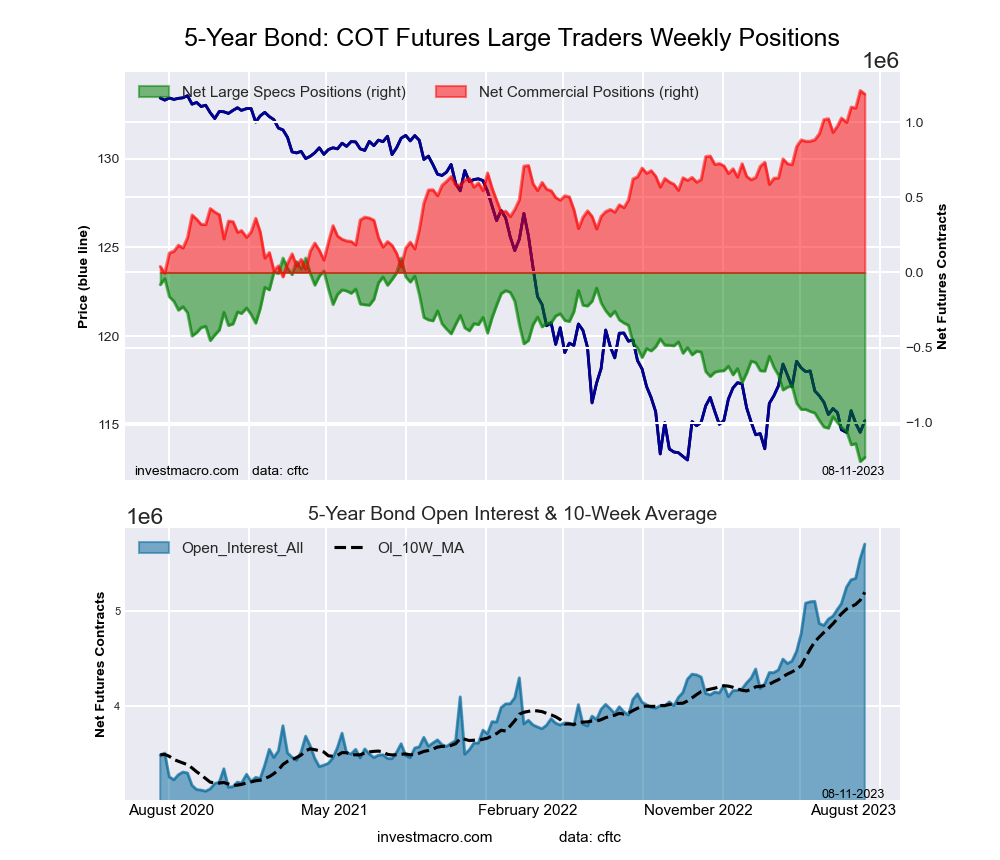 The 5-Year Treasury Note large speculator standing this week equaled a net position of -1,230,307 contracts in the data reported through Tuesday. This was a weekly increase of 26,739 contracts from the previous week which had a total of -1,257,046 net contracts.
This week’s current strength score (the trader positioning range over the past three years, measured from 0 to 100) shows the speculators are currently Bearish-Extreme with a score of 2.0 percent. The commercials are Bullish-Extreme with a score of 98.1 percent and the small traders (not shown in chart) are Bullish-Extreme with a score of 93.2 percent.
Price Trend-Following Model: Strong Downtrend
Our weekly trend-following model classifies the current market price position as: Strong Downtrend. The current action for the model is considered to be: Hold – Maintain Short Position.
| 5-Year Treasury Note Statistics | SPECULATORS | COMMERCIALS | SMALL TRADERS |
| – Percent of Open Interest Longs: | 7.7 | 84.3 | 6.7 |
| – Percent of Open Interest Shorts: | 29.3 | 63.6 | 5.9 |
| – Net Position: | -1,230,307 | 1,185,876 | 44,431 |
| – Gross Longs: | 442,034 | 4,816,393 | 383,036 |
| – Gross Shorts: | 1,672,341 | 3,630,517 | 338,605 |
| – Long to Short Ratio: | 0.3 to 1 | 1.3 to 1 | 1.1 to 1 |
| NET POSITION TREND: | |||
| – Strength Index Score (3 Year Range Pct): | 2.0 | 98.1 | 93.2 |
| – Strength Index Reading (3 Year Range): | Bearish-Extreme | Bullish-Extreme | Bullish-Extreme |
| NET POSITION MOVEMENT INDEX: | |||
| – 6-Week Change in Strength Index: | -17.1 | 17.0 | 5.7 |
10-Year Treasury Note Futures:
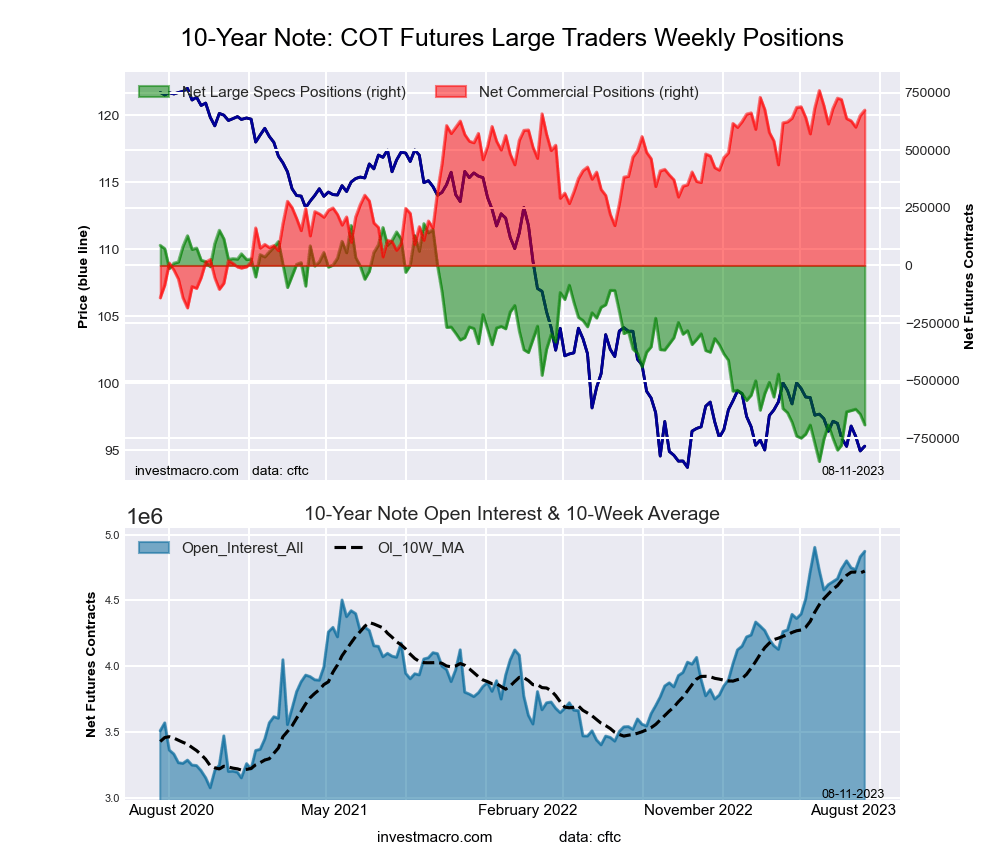
The 10-Year Treasury Note large speculator standing this week equaled a net position of -691,726 contracts in the data reported through Tuesday. This was a weekly decrease of -46,540 contracts from the previous week which had a total of -645,186 net contracts.
This week’s current strength score (the trader positioning range over the past three years, measured from 0 to 100) shows the speculators are currently Bearish-Extreme with a score of 15.4 percent. The commercials are Bullish-Extreme with a score of 91.0 percent and the small traders (not shown in chart) are Bullish with a score of 77.5 percent.
Price Trend-Following Model: Strong Downtrend
Our weekly trend-following model classifies the current market price position as: Strong Downtrend. The current action for the model is considered to be: Hold – Maintain Short Position.
| 10-Year Treasury Note Statistics | SPECULATORS | COMMERCIALS | SMALL TRADERS |
| – Percent of Open Interest Longs: | 10.8 | 78.2 | 8.5 |
| – Percent of Open Interest Shorts: | 25.0 | 64.4 | 8.2 |
| – Net Position: | -691,726 | 673,553 | 18,173 |
| – Gross Longs: | 524,694 | 3,810,443 | 415,794 |
| – Gross Shorts: | 1,216,420 | 3,136,890 | 397,621 |
| – Long to Short Ratio: | 0.4 to 1 | 1.2 to 1 | 1.0 to 1 |
| NET POSITION TREND: | |||
| – Strength Index Score (3 Year Range Pct): | 15.4 | 91.0 | 77.5 |
| – Strength Index Reading (3 Year Range): | Bearish-Extreme | Bullish-Extreme | Bullish |
| NET POSITION MOVEMENT INDEX: | |||
| – 6-Week Change in Strength Index: | 10.6 | -5.5 | -12.5 |
Ultra 10-Year Notes Futures:
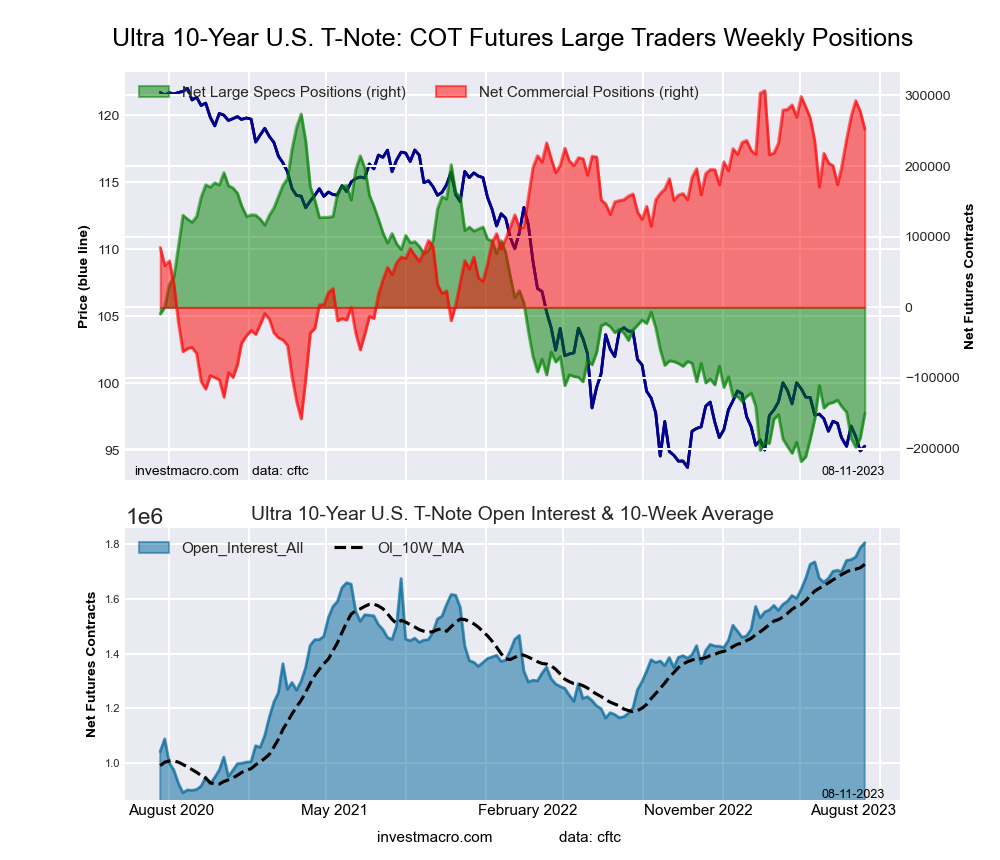 The Ultra 10-Year Notes large speculator standing this week equaled a net position of -149,951 contracts in the data reported through Tuesday. This was a weekly boost of 35,286 contracts from the previous week which had a total of -185,237 net contracts.
This week’s current strength score (the trader positioning range over the past three years, measured from 0 to 100) shows the speculators are currently Bearish-Extreme with a score of 13.9 percent. The commercials are Bullish-Extreme with a score of 88.3 percent and the small traders (not shown in chart) are Bullish with a score of 53.2 percent.
Price Trend-Following Model: Weak Uptrend
Our weekly trend-following model classifies the current market price position as: Weak Uptrend. The current action for the model is considered to be: Hold – Maintain Long Position.
| Ultra 10-Year Notes Statistics | SPECULATORS | COMMERCIALS | SMALL TRADERS |
| – Percent of Open Interest Longs: | 11.3 | 77.7 | 9.3 |
| – Percent of Open Interest Shorts: | 19.6 | 63.7 | 15.0 |
| – Net Position: | -149,951 | 252,369 | -102,418 |
| – Gross Longs: | 203,958 | 1,402,515 | 167,668 |
| – Gross Shorts: | 353,909 | 1,150,146 | 270,086 |
| – Long to Short Ratio: | 0.6 to 1 | 1.2 to 1 | 0.6 to 1 |
| NET POSITION TREND: | |||
| – Strength Index Score (3 Year Range Pct): | 13.9 | 88.3 | 53.2 |
| – Strength Index Reading (3 Year Range): | Bearish-Extreme | Bullish-Extreme | Bullish |
| NET POSITION MOVEMENT INDEX: | |||
| – 6-Week Change in Strength Index: | -3.8 | 16.9 | -35.5 |
US Treasury Bonds Futures:
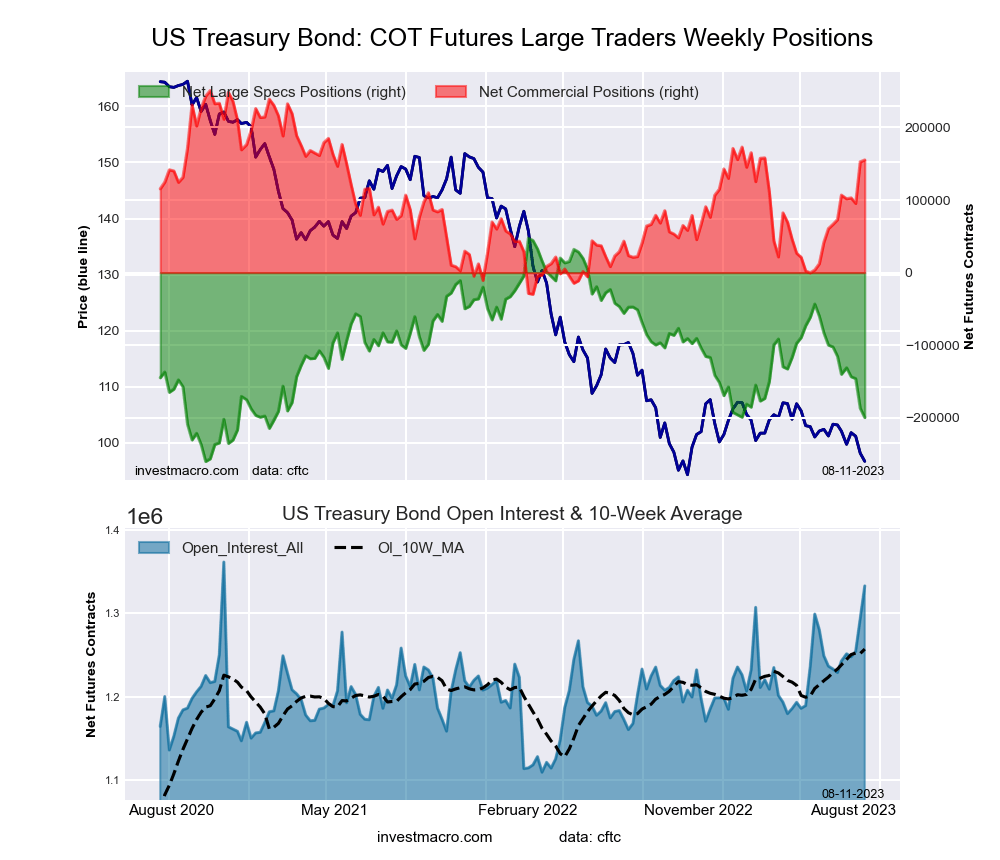 The US Treasury Bonds large speculator standing this week equaled a net position of -199,555 contracts in the data reported through Tuesday. This was a weekly decrease of -12,879 contracts from the previous week which had a total of -186,676 net contracts.
This week’s current strength score (the trader positioning range over the past three years, measured from 0 to 100) shows the speculators are currently Bearish-Extreme with a score of 19.7 percent. The commercials are Bullish with a score of 65.9 percent and the small traders (not shown in chart) are Bullish-Extreme with a score of 80.8 percent.
Price Trend-Following Model: Strong Downtrend
Our weekly trend-following model classifies the current market price position as: Strong Downtrend. The current action for the model is considered to be: Hold – Maintain Short Position.
| US Treasury Bonds Statistics | SPECULATORS | COMMERCIALS | SMALL TRADERS |
| – Percent of Open Interest Longs: | 5.8 | 76.9 | 14.7 |
| – Percent of Open Interest Shorts: | 20.8 | 65.2 | 11.3 |
| – Net Position: | -199,555 | 155,116 | 44,439 |
| – Gross Longs: | 77,132 | 1,024,818 | 195,687 |
| – Gross Shorts: | 276,687 | 869,702 | 151,248 |
| – Long to Short Ratio: | 0.3 to 1 | 1.2 to 1 | 1.3 to 1 |
| NET POSITION TREND: | |||
| – Strength Index Score (3 Year Range Pct): | 19.7 | 65.9 | 80.8 |
| – Strength Index Reading (3 Year Range): | Bearish-Extreme | Bullish | Bullish-Extreme |
| NET POSITION MOVEMENT INDEX: | |||
| – 6-Week Change in Strength Index: | -27.4 | 29.3 | 1.6 |
Ultra US Treasury Bonds Futures:
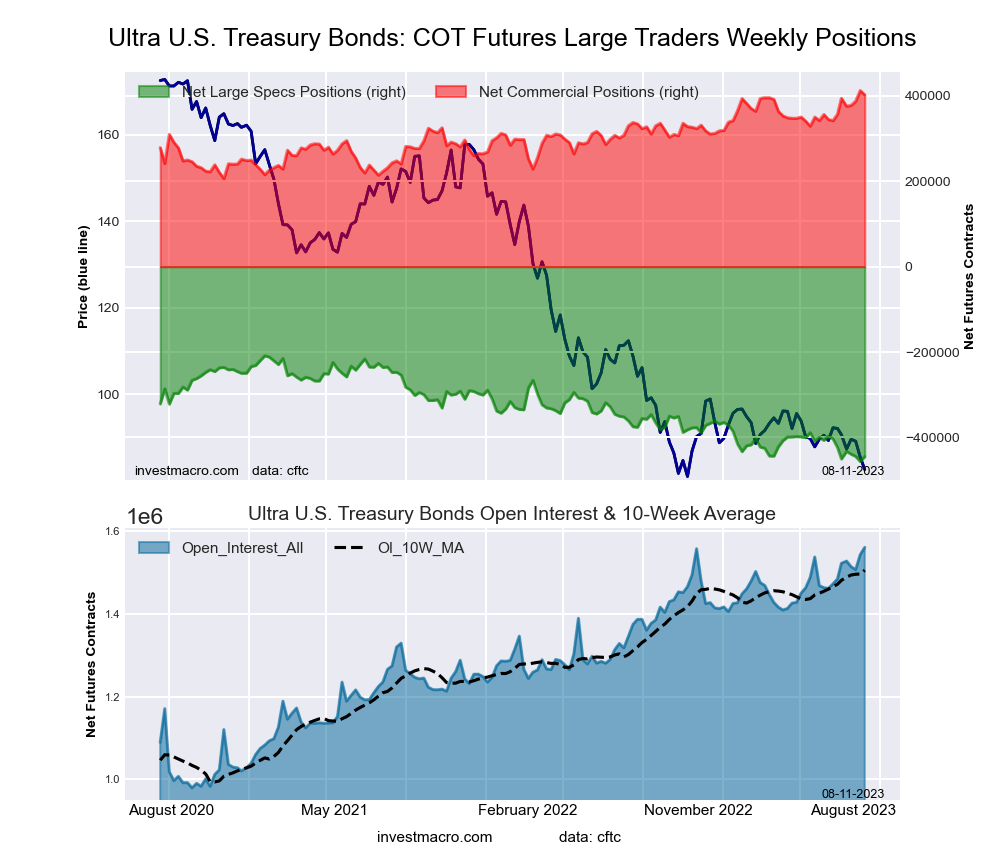 The Ultra US Treasury Bonds large speculator standing this week equaled a net position of -445,088 contracts in the data reported through Tuesday. This was a weekly boost of 11,341 contracts from the previous week which had a total of -456,429 net contracts.
This week’s current strength score (the trader positioning range over the past three years, measured from 0 to 100) shows the speculators are currently Bearish-Extreme with a score of 4.6 percent. The commercials are Bullish-Extreme with a score of 95.0 percent and the small traders (not shown in chart) are Bullish with a score of 77.6 percent.
Price Trend-Following Model: Strong Downtrend
Our weekly trend-following model classifies the current market price position as: Strong Downtrend. The current action for the model is considered to be: Hold – Maintain Short Position.
| Ultra US Treasury Bonds Statistics | SPECULATORS | COMMERCIALS | SMALL TRADERS |
| – Percent of Open Interest Longs: | 5.7 | 82.7 | 11.0 |
| – Percent of Open Interest Shorts: | 34.2 | 57.0 | 8.3 |
| – Net Position: | -445,088 | 402,286 | 42,802 |
| – Gross Longs: | 88,265 | 1,291,140 | 172,047 |
| – Gross Shorts: | 533,353 | 888,854 | 129,245 |
| – Long to Short Ratio: | 0.2 to 1 | 1.5 to 1 | 1.3 to 1 |
| NET POSITION TREND: | |||
| – Strength Index Score (3 Year Range Pct): | 4.6 | 95.0 | 77.6 |
| – Strength Index Reading (3 Year Range): | Bearish-Extreme | Bullish-Extreme | Bullish |
| NET POSITION MOVEMENT INDEX: | |||
| – 6-Week Change in Strength Index: | -8.6 | 21.9 | -22.4 |
Article By InvestMacro – Receive our weekly COT Newsletter
*COT Report: The COT data, released weekly to the public each Friday, is updated through the most recent Tuesday (data is 3 days old) and shows a quick view of how large speculators or non-commercials (for-profit traders) were positioned in the futures markets.
The CFTC categorizes trader positions according to commercial hedgers (traders who use futures contracts for hedging as part of the business), non-commercials (large traders who speculate to realize trading profits) and nonreportable traders (usually small traders/speculators) as well as their open interest (contracts open in the market at time of reporting). See CFTC criteria here.


