By JustMarkets
At yesterday’s stock market close, the Dow Jones (US30) index decreased by 0.52%, while the S&P 500 (US500) index lost 0.76%. The NASDAQ Technology Index (US100) closed negative 1.15% on Wednesday. The S&P 500 (US500) fell to a 5-week low, the Dow Jones (US30) fell to a 4-week low, and the Nasdaq 100 (US100) fell to a one-and-a-half-month low. Stock indices came under pressure as government bond yields jumped sharply after hawkish FOMC minutes.
According to the FOMC minutes of the US Federal Reserve’s July 25-26 meeting released Wednesday last month, most Fed officials still viewed high inflation as a persistent threat that could warrant further interest rate hikes. At the same time, officials saw some tentative signs that inflationary pressures may be easing. Most investors and economists believe the July rate hike was the last. Earlier this week, Goldman Sachs economists predicted the Fed would begin cutting rates by the middle of next year.
Other economic data showed that US housing starts rose by 3.9% m/m to 1.452 million in July, beating expectations of 1.450 million. However, July building permits, an indicator of future construction, rose just by 0.1% m/m to 1.442 million, weaker than expectations of 1.463 million. US manufacturing production unexpectedly rose by 0.5% m/m in July, beating expectations. Rising economic data, along with hawkish FOMC reports, supported the US index yesterday.
Equity markets in Europe traded flat yesterday. German DAX (DE40) rose by 0.14%, French CAC 40 (FR40) fell by 0.10% on Wednesday, Spanish IBEX 35 (ES35) added 0.05%, British FTSE 100 (UK100) closed negative 0.44%.
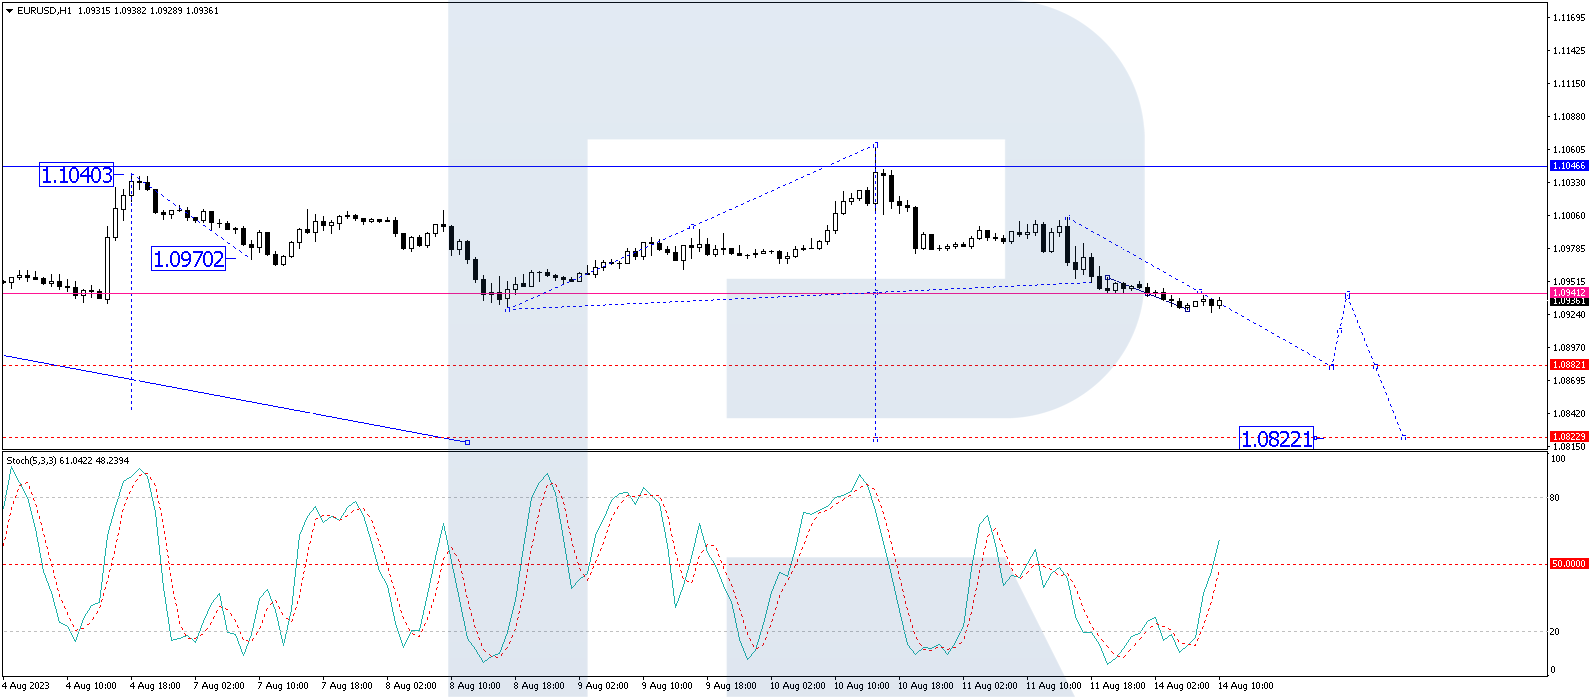
The Eurozone GDP report showed a slight increase from the previous quarter. Over the past three months, the Eurozone economy grew by 0.3%. On an annualized basis, GDP fell from 1.1% to 0.6%. Dutch GDP contracted by 0.3% in the second quarter of 2023. This marked the second consecutive quarterly contraction for the economy, meaning that the Netherlands is in a “technical recession.” Eurozone countries are gradually slipping into recession one by one.
The UK inflation report reinforced economists’ view that the Bank of England will continue to raise rates at its upcoming meetings. Although the consumer price index fell from 7.9% to 6.8% year-on-year, inflation remains the highest among the major developed economies, and the slowdown in inflation is again more modest than expected. Meanwhile, core inflation (which excludes energy and food prices) remained at 6.9% y/y in June, only slightly better than May’s record 7.1% y/y.
The dollar strengthening on Wednesday and the S&P 500 falling to a 5-week low put pressure on energy prices. In addition, oil is under pressure due to concerns about China’s economic growth after JPMorgan Chase and Barclays lowered their forecasts for China’s growth in 2023. Crude oil prices fell on Wednesday despite the EIA’s weekly crude inventories falling more than expected.
Asian markets were mostly down yesterday. Japan’s Nikkei 225 (JP225) decreased by 0.46% yesterday, China’s FTSE China A50 (CHA50) fell by 0.29%, Hong Kong’s Hang Seng (HK50) was down by 1.26% for the day, and Australia’s S&P/ASX 200 (AU200) was in negative 1.50% for Wednesday.
China’s economic problems continue to weigh on global markets. Yesterday, the Chinese yuan fell to its lowest in 9.5 months, and Chinese indices closed lower after China’s July home sales fell for the second month, the biggest drop in 7 months. In addition, liquidity concerns in China’s shadow banking system intensified after Zhongrong International Trust missed payments on dozens of its investment products. JPMorgan Chase cut China’s 2023 GDP forecast to 4.8% from an estimate of 6.4% in May. Barclays cut China’s 2023 GDP forecast to 4.5% from a previous estimate of 4.9%.
S&P 500 (F)(US500) 4,404.33 −33.53 (−0.76%)
Dow Jones (US30) 34,765.74 −180.65 (−0.52%)
DAX (DE40) 15,789.45 +22.17 (+0.14%)
FTSE 100 (UK100) 7,356.88 −32.76 (−0.44%)
USD Index 103.48 +0.27 (+0.26%)
- – New Zealand Producer Price Index (q/q) at 01:45 (GMT+3);
- – Japan Trade Balance (m/m) at 02:50 (GMT+3);
- – Australia Unemployment Rate (m/m) at 04:30 (GMT+3);
- – Norwegian Norges Interest Rate Decision at 11:00 (GMT+3);
- – Eurozone Trade Balance (m/m) at 12:00 (GMT+3);
- – US Initial Jobless Claims (w/w) at 15:30 (GMT+3);
- – US Philadelphia Fed Manufacturing Index (m/m) at 15:30 (GMT+3);
- – US Natural Gas Storage (w/w) at 17:30 (GMT+3)
By JustMarkets
This article reflects a personal opinion and should not be interpreted as an investment advice, and/or offer, and/or a persistent request for carrying out financial transactions, and/or a guarantee, and/or a forecast of future events.

.png)
.png)