
BRENT
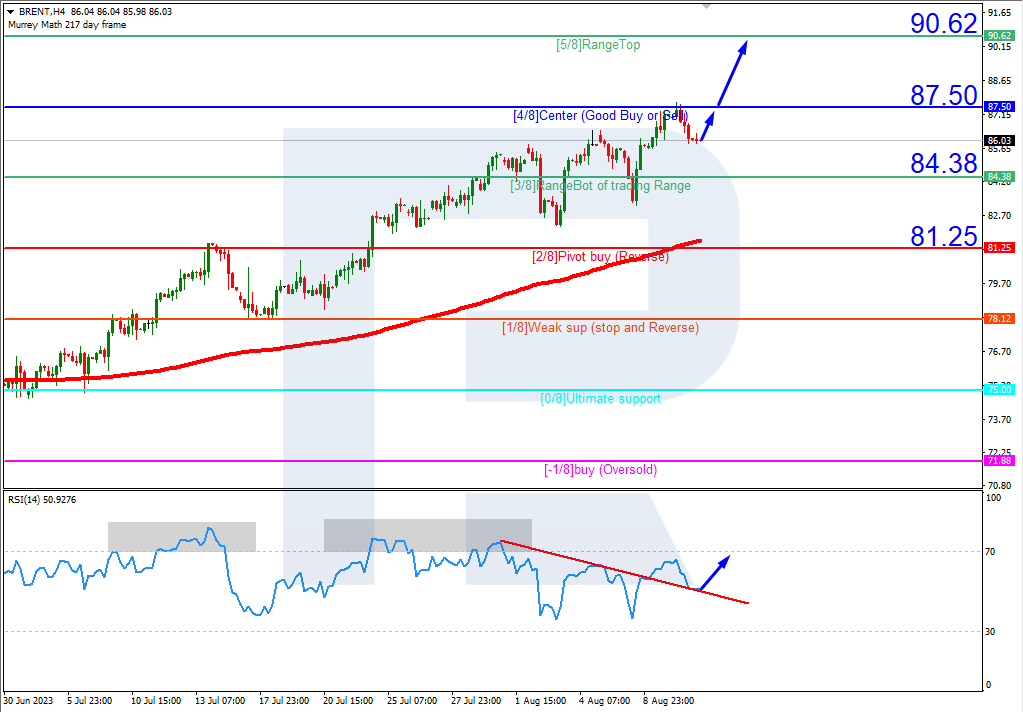
Brent quotes are above the 200-day Moving Average on H4, indicating a prevailing uptrend. The RSI is testing the support line. In these circumstances, the quotes are expected to break the 4/8 (87.50) level and reach the resistance level at 5/8 (90.62). The scenario can be cancelled by a downward breakout of the support at 3/8 (84.38). In this case, the quotes could drop to 2/8 (81.25).

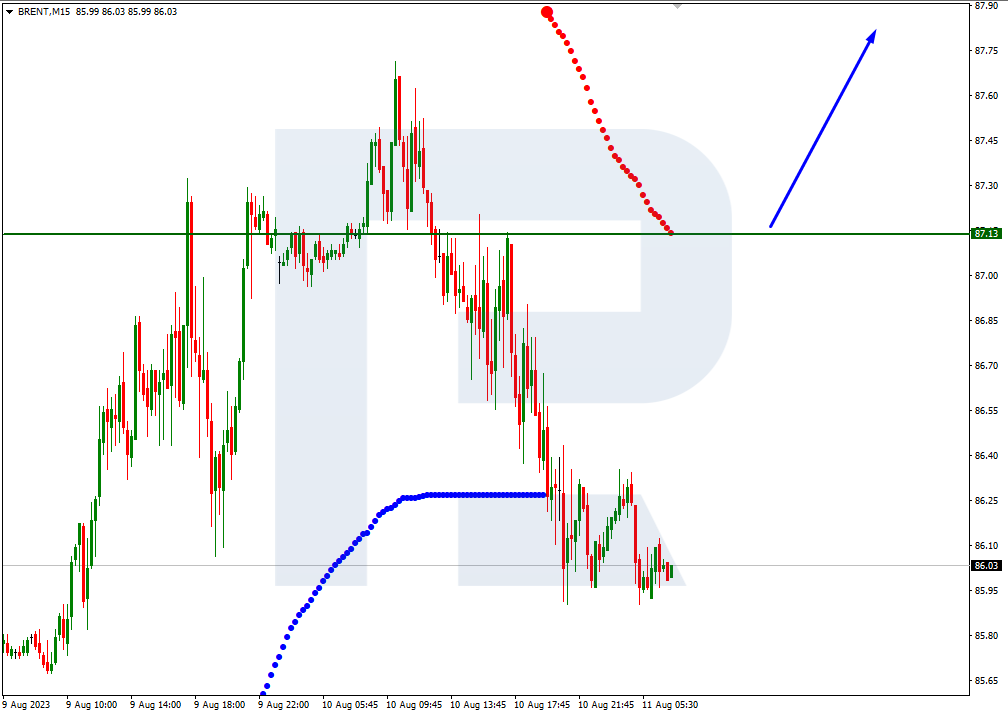
On M15, price growth might be additionally supported by a breakout of the upper line of the VoltyChannel.
Free Reports:
 Get our Weekly Commitment of Traders Reports - See where the biggest traders (Hedge Funds and Commercial Hedgers) are positioned in the futures markets on a weekly basis.
 Sign Up for Our Stock Market Newsletter – Get updated on News, Charts & Rankings of Public Companies when you join our Stocks Newsletter
S&P 500
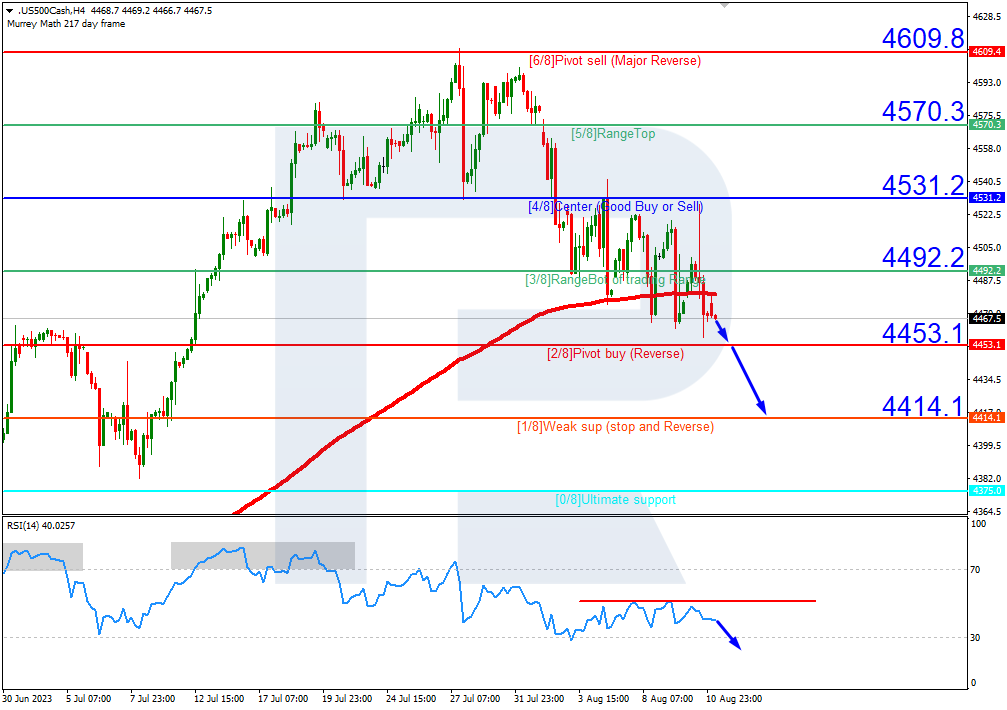
S&P 500 quotes have broken the 200-day Moving Average on H4 and are now below it, which indicates a potential downtrend. The RSI has rebounded from the resistance line. In this situation, the price is expected to test the 2/8 (4453.1) level, break it, and fall to the support at 1/8 (4414.1). The scenario can be cancelled by a breakout of the resistance at 3/8 (4492.2). In this case, the S&P 500 index could return to 4/8 (4531.2).
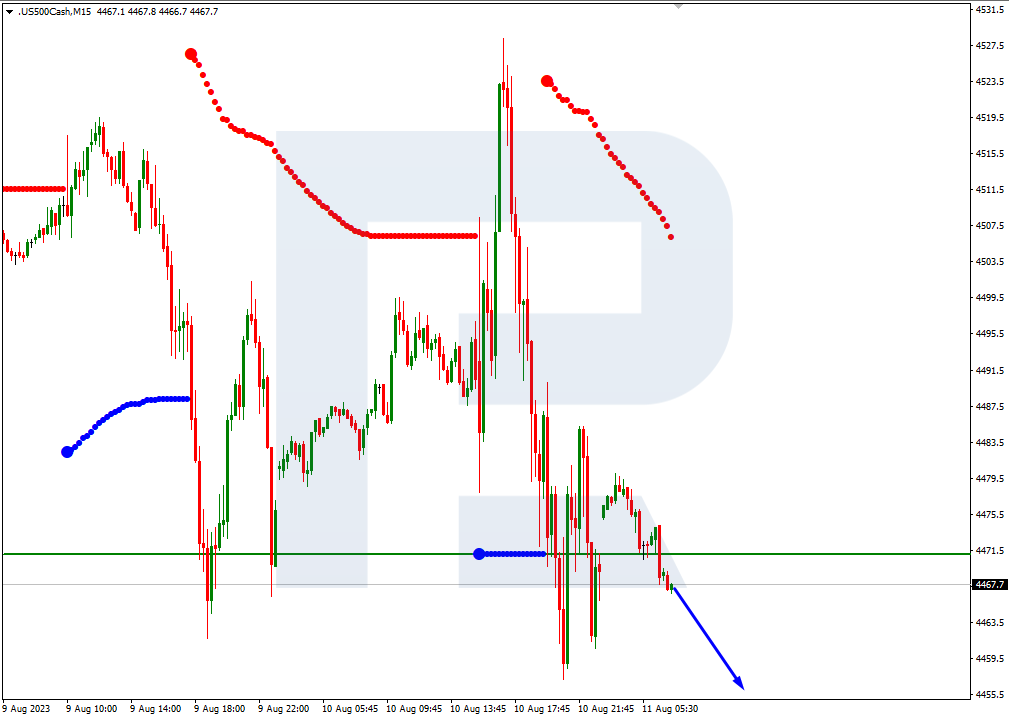
On M15, the lower line of the VoltyChannel is broken, which increases the probability of a further price decline.
Article By RoboForex.com
Attention!
Forecasts presented in this section only reflect the author s private opinion and should not be considered as guidance for trading. RoboForex LP bears no responsibility for trading results based on trading recommendations described in these analytical reviews.

- Oil prices jumped 4% amid a new wave of escalation between the US and Iran Jul 13, 2026
- EUR/USD: US Inflation Will Determine Everything Jul 13, 2026
- COT Metals Charts: Weekly Speculator Bets see small gains for Silver & Gold Jul 12, 2026
- COT Bonds Charts: Speculator Bets led by SOFR 3-Months & 2-Year Bonds Jul 12, 2026
- COT Energy Charts: Weekly Speculator Changes led by Brent Oil Jul 12, 2026
- COT Soft Commodities Charts: Weekly Speculator Changes led by Sugar, Corn & Soybeans Jul 12, 2026
- The US and European stock indices are rising again amid renewed investor interest in the AI industry. Jul 10, 2026
- USD/JPY Falls as Yen Recovers Weekly Losses Jul 10, 2026
- Crude oil prices surged sharply by 7% in reaction to the rapid escalation of the conflict in the Middle East Jul 9, 2026
- Middle East Tensions Weigh on Gold Jul 9, 2026