By InvestMacro
Here are the latest charts and statistics for the Commitment of Traders (COT) reports data published by the Commodities Futures Trading Commission (CFTC).
The latest COT data is updated through Tuesday June 4th and shows a quick view of how large traders (for-profit speculators and commercial entities) were positioned in the futures markets.
Weekly Speculator Changes led by Coffee & Cocoa
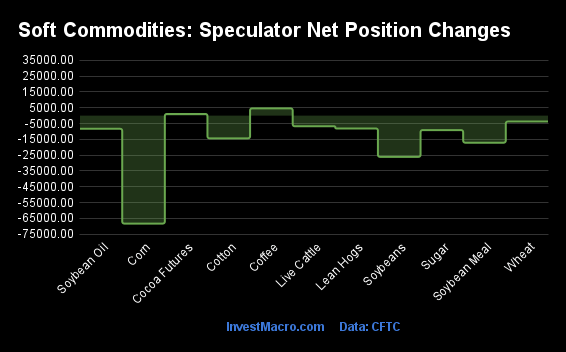
The COT soft commodities markets speculator bets were lower overall this week as just two out of the eleven softs markets we cover had higher positioning while the other nine markets had lower speculator contracts.
Leading the gains for the softs markets was Coffee (4,616 contracts) with Cocoa (1,075 contracts) as the only other market showing a positive week.
The markets with the declines in speculator bets this week were Corn (-68,301 contracts), Soybeans (-26,081 contracts), Soybean Meal (-17,113 contracts), Cotton (-14,369 contracts), Sugar (-9,145 contracts), Soybean Oil (-8,321 contracts), Lean Hogs (-8,116 contracts), Live Cattle (-6,722 contracts) and with Wheat (-3,728 contracts) also registering lower bets on the week.
Soft Commodities Net Speculators Leaderboard
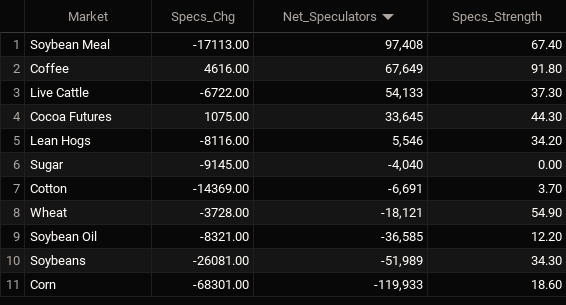
Legend: Weekly Speculators Change | Speculators Current Net Position | Speculators Strength Score compared to last 3-Years (0-100 range)
Strength Scores led by Coffee
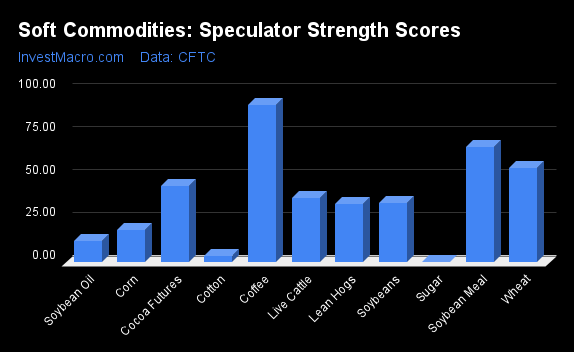
COT Strength Scores (a normalized measure of Speculator positions over a 3-Year range, from 0 to 100 where above 80 is Extreme-Bullish and below 20 is Extreme-Bearish) showed that Coffee (92 percent) leads the softs markets this week. Soybean Meal (67 percent) and Wheat (55 percent) come in as the next highest in the weekly strength scores.
On the downside, Sugar (0 percent), Cotton (4 percent), Soybean Oil (12 percent) and Corn (19 percent) come in at the lowest strength levels currently and are in Extreme-Bearish territory (below 20 percent).
Strength Statistics:
Corn (18.6 percent) vs Corn previous week (27.3 percent)
Sugar (0.0 percent) vs Sugar previous week (3.0 percent)
Coffee (91.8 percent) vs Coffee previous week (87.3 percent)
Soybeans (34.3 percent) vs Soybeans previous week (40.4 percent)
Soybean Oil (12.2 percent) vs Soybean Oil previous week (17.2 percent)
Soybean Meal (67.4 percent) vs Soybean Meal previous week (74.4 percent)
Live Cattle (37.3 percent) vs Live Cattle previous week (44.6 percent)
Lean Hogs (34.2 percent) vs Lean Hogs previous week (40.9 percent)
Cotton (3.7 percent) vs Cotton previous week (14.5 percent)
Cocoa (44.3 percent) vs Cocoa previous week (43.2 percent)
Wheat (54.9 percent) vs Wheat previous week (57.5 percent)
Soybean Meal & Soybeans top the 6-Week Strength Trends
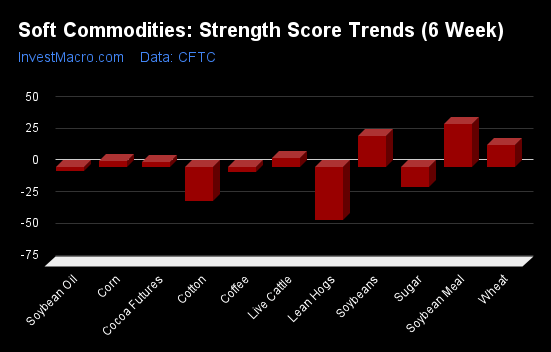
COT Strength Score Trends (or move index, calculates the 6-week changes in strength scores) showed that Soybean Meal (34 percent) and Soybeans (24 percent) lead the past six weeks trends for soft commodities. Wheat (18 percent), Live Cattle (7 percent) and Corn (5 percent) are the next highest positive movers in the latest trends data.
Lean Hogs (-42 percent) leads the downside trend scores currently with Cotton (-27 percent), Sugar (-16 percent) and Coffee (-4 percent) following next with lower trend scores.
Strength Trend Statistics:
Corn (5.1 percent) vs Corn previous week (19.5 percent)
Sugar (-16.0 percent) vs Sugar previous week (-18.8 percent)
Coffee (-4.1 percent) vs Coffee previous week (-12.7 percent)
Soybeans (24.2 percent) vs Soybeans previous week (34.5 percent)
Soybean Oil (-3.2 percent) vs Soybean Oil previous week (3.8 percent)
Soybean Meal (34.0 percent) vs Soybean Meal previous week (52.2 percent)
Live Cattle (7.1 percent) vs Live Cattle previous week (19.2 percent)
Lean Hogs (-42.0 percent) vs Lean Hogs previous week (-35.2 percent)
Cotton (-26.8 percent) vs Cotton previous week (-33.6 percent)
Cocoa (4.1 percent) vs Cocoa previous week (-1.3 percent)
Wheat (17.5 percent) vs Wheat previous week (33.7 percent)
Individual Soft Commodities Markets:
CORN Futures:
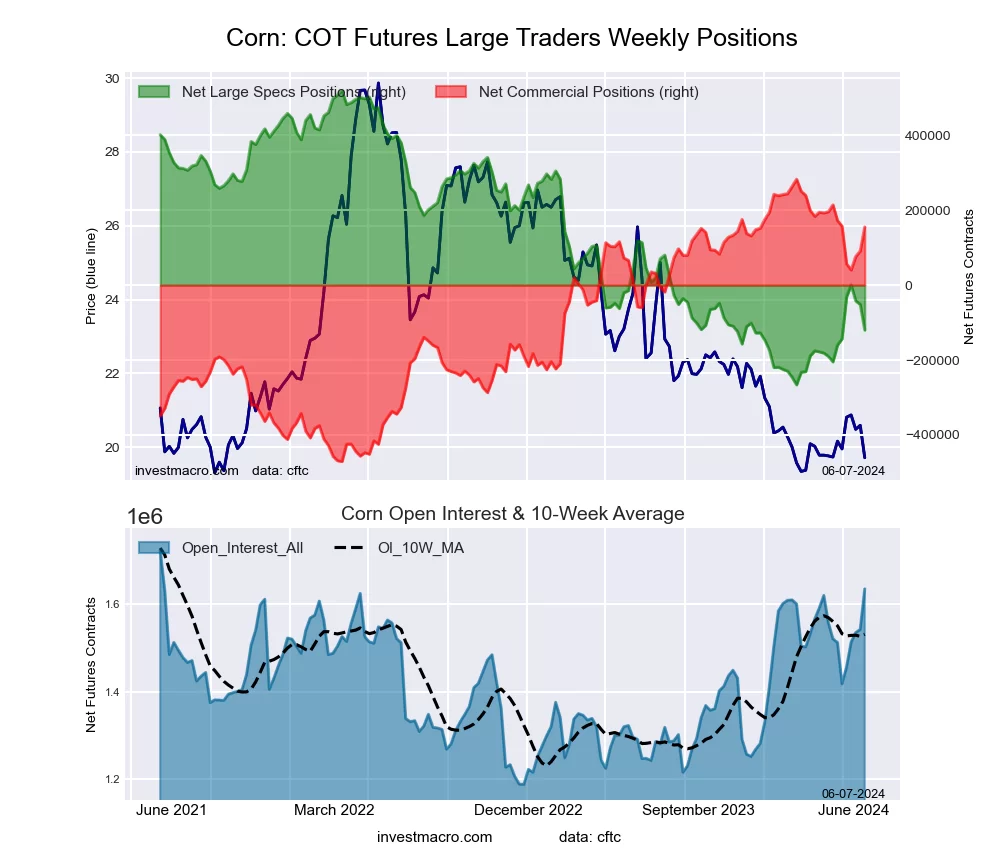 The CORN large speculator standing this week resulted in a net position of -119,933 contracts in the data reported through Tuesday. This was a weekly lowering of -68,301 contracts from the previous week which had a total of -51,632 net contracts.
This week’s current strength score (the trader positioning range over the past three years, measured from 0 to 100) shows the speculators are currently Bearish-Extreme with a score of 18.6 percent. The commercials are Bullish-Extreme with a score of 83.1 percent and the small traders (not shown in chart) are Bullish with a score of 60.7 percent.
Price Trend-Following Model: Weak Uptrend
Our weekly trend-following model classifies the current market price position as: Weak Uptrend. The current action for the model is considered to be: Hold – Maintain Long Position.
| CORN Futures Statistics | SPECULATORS | COMMERCIALS | SMALL TRADERS |
| – Percent of Open Interest Longs: | 20.7 | 42.9 | 8.8 |
| – Percent of Open Interest Shorts: | 28.1 | 33.5 | 10.9 |
| – Net Position: | -119,933 | 155,249 | -35,316 |
| – Gross Longs: | 339,144 | 702,466 | 143,787 |
| – Gross Shorts: | 459,077 | 547,217 | 179,103 |
| – Long to Short Ratio: | 0.7 to 1 | 1.3 to 1 | 0.8 to 1 |
| NET POSITION TREND: | | | |
| – Strength Index Score (3 Year Range Pct): | 18.6 | 83.1 | 60.7 |
| – Strength Index Reading (3 Year Range): | Bearish-Extreme | Bullish-Extreme | Bullish |
| NET POSITION MOVEMENT INDEX: | | | |
| – 6-Week Change in Strength Index: | 5.1 | -2.3 | -30.6 |
SUGAR Futures:
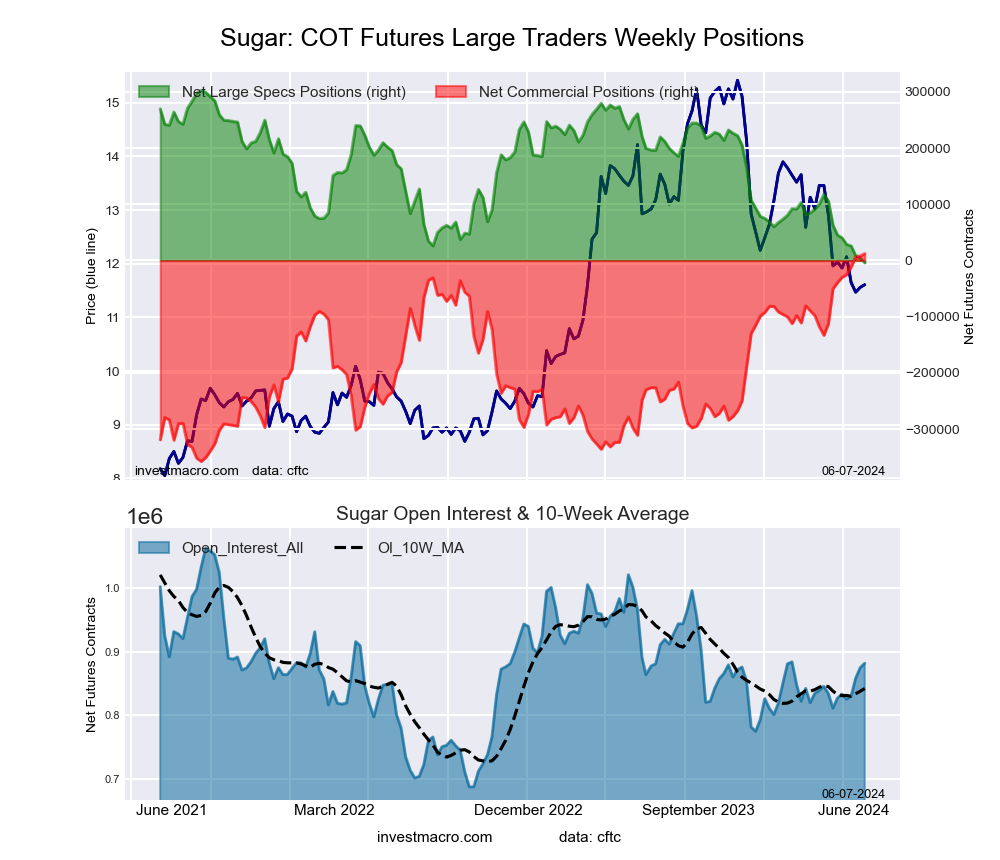 The SUGAR large speculator standing this week resulted in a net position of -4,040 contracts in the data reported through Tuesday. This was a weekly fall of -9,145 contracts from the previous week which had a total of 5,105 net contracts.
This week’s current strength score (the trader positioning range over the past three years, measured from 0 to 100) shows the speculators are currently Bearish-Extreme with a score of 0.0 percent. The commercials are Bullish-Extreme with a score of 100.0 percent and the small traders (not shown in chart) are Bearish-Extreme with a score of 8.8 percent.
Price Trend-Following Model: Downtrend
Our weekly trend-following model classifies the current market price position as: Downtrend. The current action for the model is considered to be: Hold – Maintain Short Position.
| SUGAR Futures Statistics | SPECULATORS | COMMERCIALS | SMALL TRADERS |
| – Percent of Open Interest Longs: | 22.0 | 53.2 | 7.8 |
| – Percent of Open Interest Shorts: | 22.4 | 51.8 | 8.8 |
| – Net Position: | -4,040 | 12,341 | -8,301 |
| – Gross Longs: | 193,811 | 469,221 | 69,222 |
| – Gross Shorts: | 197,851 | 456,880 | 77,523 |
| – Long to Short Ratio: | 1.0 to 1 | 1.0 to 1 | 0.9 to 1 |
| NET POSITION TREND: | | | |
| – Strength Index Score (3 Year Range Pct): | 0.0 | 100.0 | 8.8 |
| – Strength Index Reading (3 Year Range): | Bearish-Extreme | Bullish-Extreme | Bearish-Extreme |
| NET POSITION MOVEMENT INDEX: | | | |
| – 6-Week Change in Strength Index: | -16.0 | 13.9 | -3.1 |
COFFEE Futures:
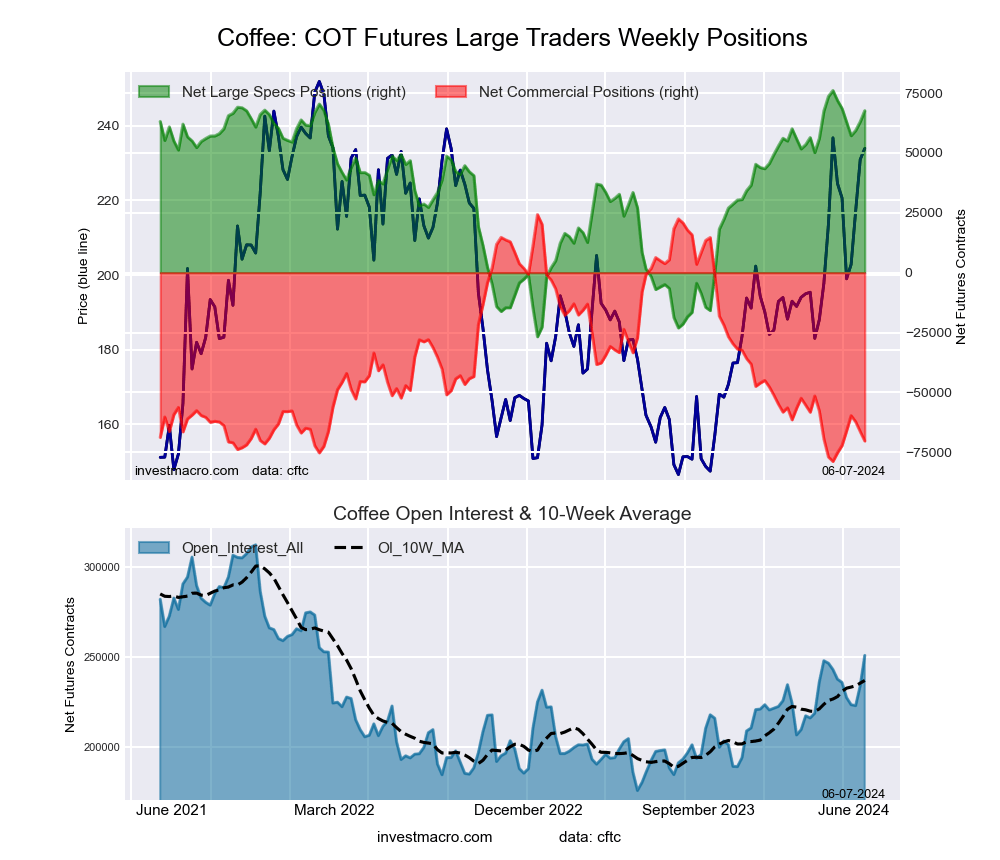 The COFFEE large speculator standing this week resulted in a net position of 67,649 contracts in the data reported through Tuesday. This was a weekly advance of 4,616 contracts from the previous week which had a total of 63,033 net contracts.
This week’s current strength score (the trader positioning range over the past three years, measured from 0 to 100) shows the speculators are currently Bullish-Extreme with a score of 91.8 percent. The commercials are Bearish-Extreme with a score of 8.3 percent and the small traders (not shown in chart) are Bullish with a score of 55.0 percent.
Price Trend-Following Model: Strong Uptrend
Our weekly trend-following model classifies the current market price position as: Strong Uptrend. The current action for the model is considered to be: Hold – Maintain Long Position.
| COFFEE Futures Statistics | SPECULATORS | COMMERCIALS | SMALL TRADERS |
| – Percent of Open Interest Longs: | 33.9 | 35.4 | 3.6 |
| – Percent of Open Interest Shorts: | 6.9 | 63.4 | 2.6 |
| – Net Position: | 67,649 | -70,285 | 2,636 |
| – Gross Longs: | 84,948 | 88,759 | 9,069 |
| – Gross Shorts: | 17,299 | 159,044 | 6,433 |
| – Long to Short Ratio: | 4.9 to 1 | 0.6 to 1 | 1.4 to 1 |
| NET POSITION TREND: | | | |
| – Strength Index Score (3 Year Range Pct): | 91.8 | 8.3 | 55.0 |
| – Strength Index Reading (3 Year Range): | Bullish-Extreme | Bearish-Extreme | Bullish |
| NET POSITION MOVEMENT INDEX: | | | |
| – 6-Week Change in Strength Index: | -4.1 | 4.8 | -9.9 |
SOYBEANS Futures:
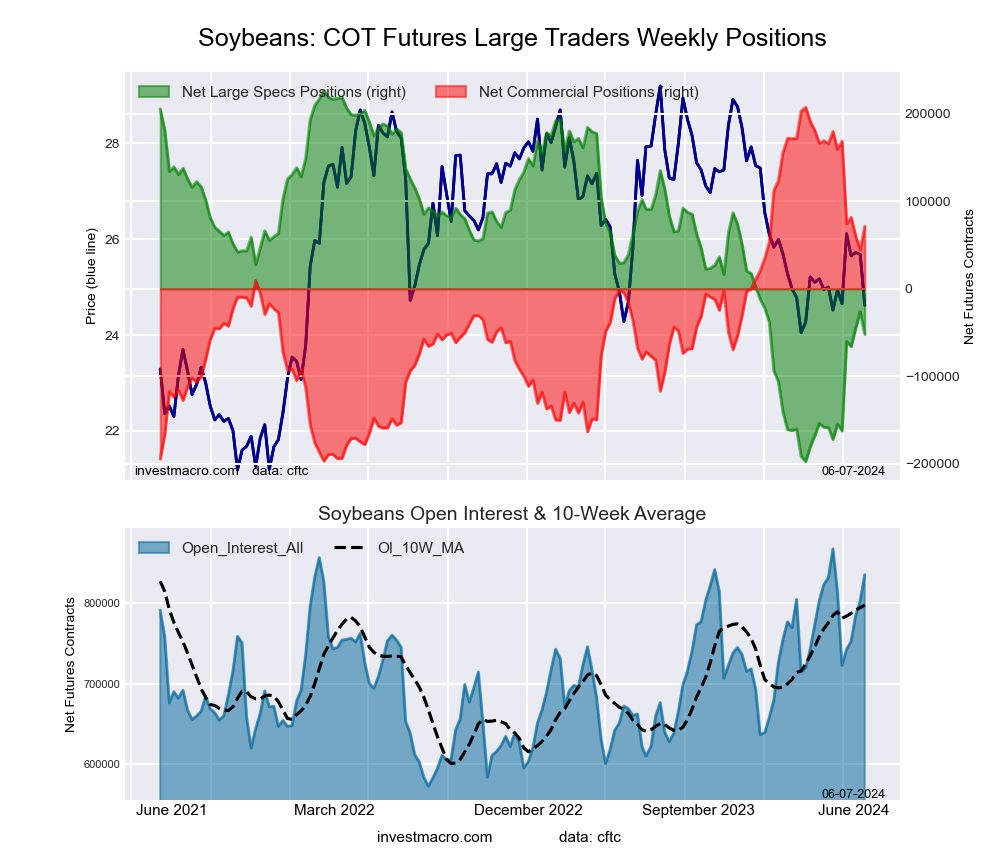 The SOYBEANS large speculator standing this week resulted in a net position of -51,989 contracts in the data reported through Tuesday. This was a weekly fall of -26,081 contracts from the previous week which had a total of -25,908 net contracts.
This week’s current strength score (the trader positioning range over the past three years, measured from 0 to 100) shows the speculators are currently Bearish with a score of 34.3 percent. The commercials are Bullish with a score of 66.3 percent and the small traders (not shown in chart) are Bullish with a score of 62.1 percent.
Price Trend-Following Model: Weak Uptrend
Our weekly trend-following model classifies the current market price position as: Weak Uptrend. The current action for the model is considered to be: Hold – Maintain Long Position.
| SOYBEANS Futures Statistics | SPECULATORS | COMMERCIALS | SMALL TRADERS |
| – Percent of Open Interest Longs: | 15.3 | 57.3 | 6.1 |
| – Percent of Open Interest Shorts: | 21.5 | 48.8 | 8.4 |
| – Net Position: | -51,989 | 71,292 | -19,303 |
| – Gross Longs: | 128,076 | 479,270 | 51,219 |
| – Gross Shorts: | 180,065 | 407,978 | 70,522 |
| – Long to Short Ratio: | 0.7 to 1 | 1.2 to 1 | 0.7 to 1 |
| NET POSITION TREND: | | | |
| – Strength Index Score (3 Year Range Pct): | 34.3 | 66.3 | 62.1 |
| – Strength Index Reading (3 Year Range): | Bearish | Bullish | Bullish |
| NET POSITION MOVEMENT INDEX: | | | |
| – 6-Week Change in Strength Index: | 24.2 | -21.8 | -37.9 |
SOYBEAN OIL Futures:
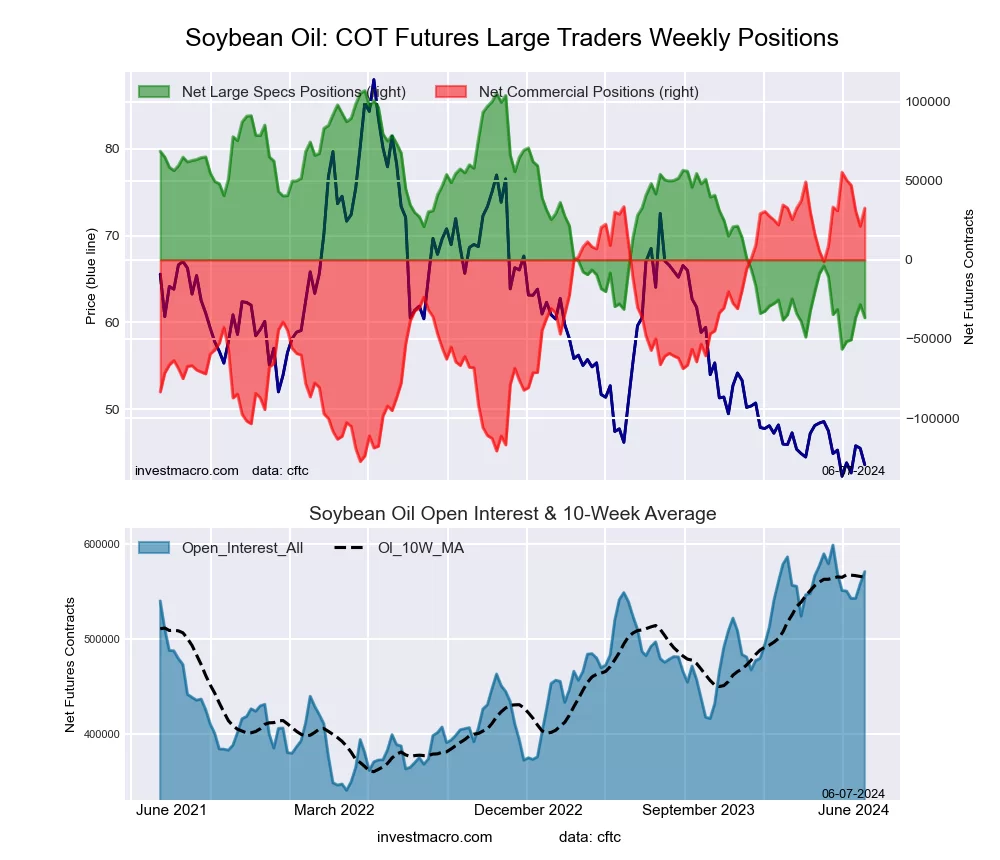 The SOYBEAN OIL large speculator standing this week resulted in a net position of -36,585 contracts in the data reported through Tuesday. This was a weekly fall of -8,321 contracts from the previous week which had a total of -28,264 net contracts.
This week’s current strength score (the trader positioning range over the past three years, measured from 0 to 100) shows the speculators are currently Bearish-Extreme with a score of 12.2 percent. The commercials are Bullish-Extreme with a score of 87.6 percent and the small traders (not shown in chart) are Bearish with a score of 29.2 percent.
Price Trend-Following Model: Strong Downtrend
Our weekly trend-following model classifies the current market price position as: Strong Downtrend. The current action for the model is considered to be: Hold – Maintain Short Position.
| SOYBEAN OIL Futures Statistics | SPECULATORS | COMMERCIALS | SMALL TRADERS |
| – Percent of Open Interest Longs: | 20.1 | 54.2 | 5.5 |
| – Percent of Open Interest Shorts: | 26.5 | 48.5 | 4.9 |
| – Net Position: | -36,585 | 32,683 | 3,902 |
| – Gross Longs: | 114,518 | 309,548 | 31,673 |
| – Gross Shorts: | 151,103 | 276,865 | 27,771 |
| – Long to Short Ratio: | 0.8 to 1 | 1.1 to 1 | 1.1 to 1 |
| NET POSITION TREND: | | | |
| – Strength Index Score (3 Year Range Pct): | 12.2 | 87.6 | 29.2 |
| – Strength Index Reading (3 Year Range): | Bearish-Extreme | Bullish-Extreme | Bearish |
| NET POSITION MOVEMENT INDEX: | | | |
| – 6-Week Change in Strength Index: | -3.2 | 0.9 | 13.8 |
SOYBEAN MEAL Futures:
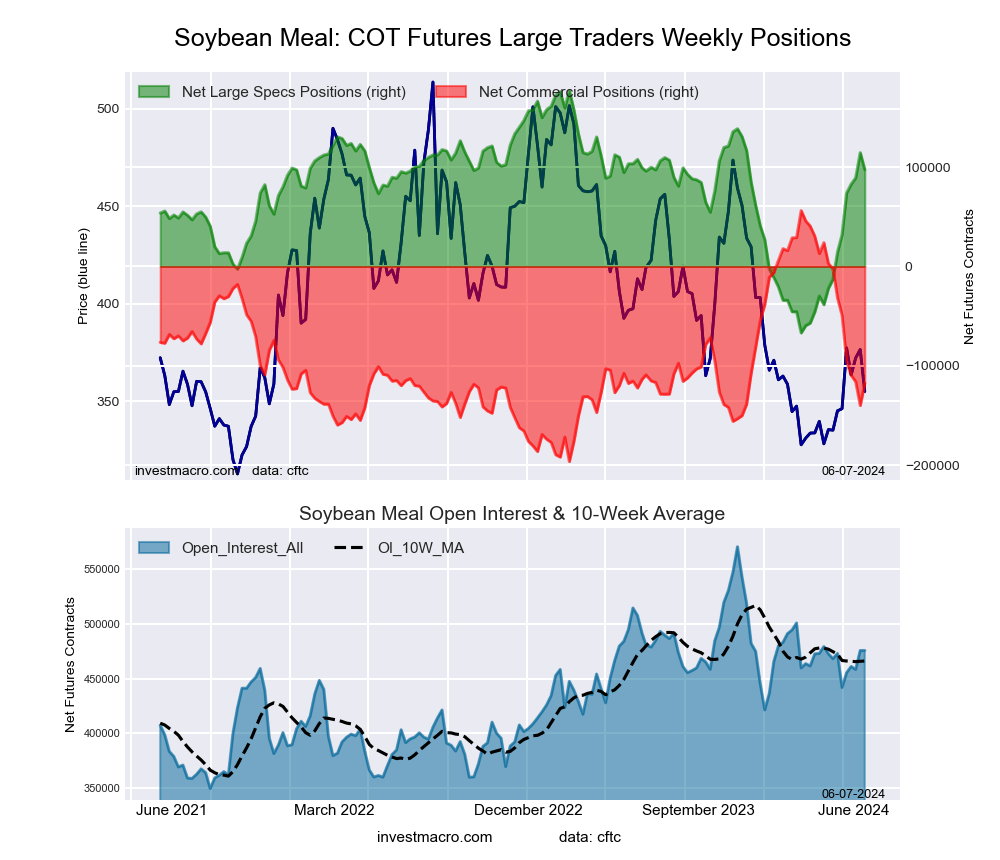 The SOYBEAN MEAL large speculator standing this week resulted in a net position of 97,408 contracts in the data reported through Tuesday. This was a weekly decrease of -17,113 contracts from the previous week which had a total of 114,521 net contracts.
This week’s current strength score (the trader positioning range over the past three years, measured from 0 to 100) shows the speculators are currently Bullish with a score of 67.4 percent. The commercials are Bearish with a score of 31.2 percent and the small traders (not shown in chart) are Bearish with a score of 45.3 percent.
Price Trend-Following Model: Strong Uptrend
Our weekly trend-following model classifies the current market price position as: Strong Uptrend. The current action for the model is considered to be: Hold – Maintain Long Position.
| SOYBEAN MEAL Futures Statistics | SPECULATORS | COMMERCIALS | SMALL TRADERS |
| – Percent of Open Interest Longs: | 31.9 | 39.2 | 9.9 |
| – Percent of Open Interest Shorts: | 11.5 | 63.8 | 5.7 |
| – Net Position: | 97,408 | -117,328 | 19,920 |
| – Gross Longs: | 151,919 | 186,344 | 47,039 |
| – Gross Shorts: | 54,511 | 303,672 | 27,119 |
| – Long to Short Ratio: | 2.8 to 1 | 0.6 to 1 | 1.7 to 1 |
| NET POSITION TREND: | | | |
| – Strength Index Score (3 Year Range Pct): | 67.4 | 31.2 | 45.3 |
| – Strength Index Reading (3 Year Range): | Bullish | Bearish | Bearish |
| NET POSITION MOVEMENT INDEX: | | | |
| – 6-Week Change in Strength Index: | 34.0 | -34.0 | 12.6 |
LIVE CATTLE Futures:
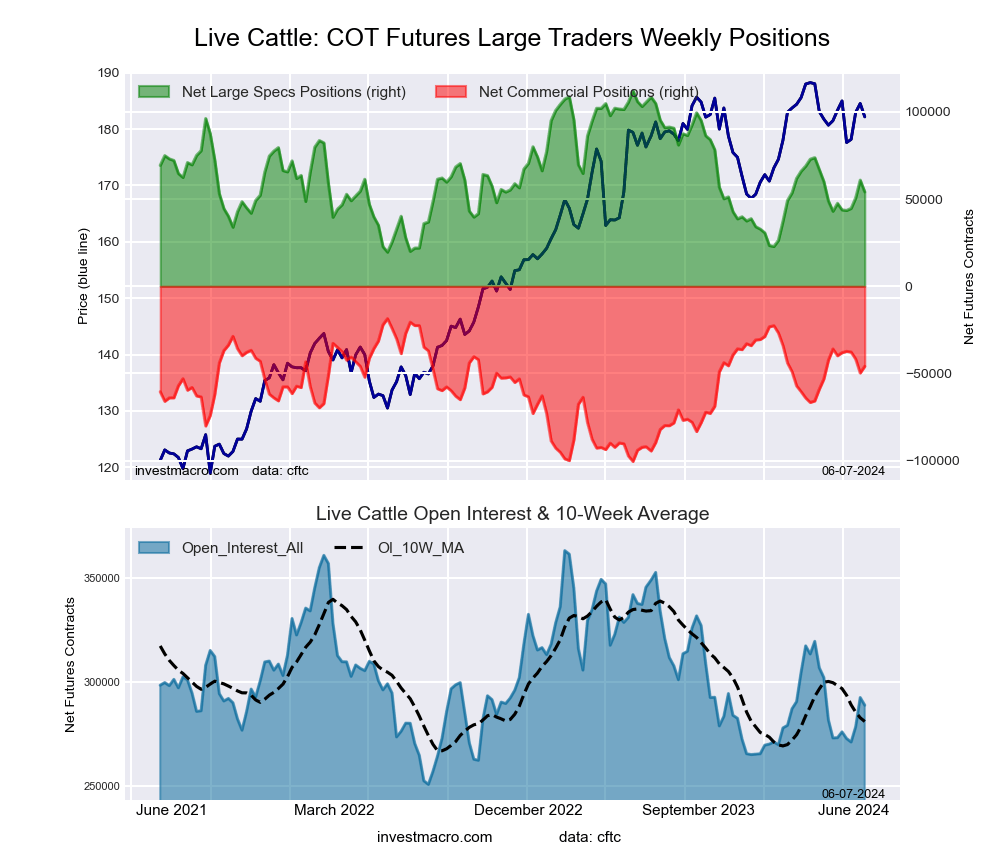 The LIVE CATTLE large speculator standing this week resulted in a net position of 54,133 contracts in the data reported through Tuesday. This was a weekly decline of -6,722 contracts from the previous week which had a total of 60,855 net contracts.
This week’s current strength score (the trader positioning range over the past three years, measured from 0 to 100) shows the speculators are currently Bearish with a score of 37.3 percent. The commercials are Bullish with a score of 66.6 percent and the small traders (not shown in chart) are Bearish with a score of 45.8 percent.
Price Trend-Following Model: Downtrend
Our weekly trend-following model classifies the current market price position as: Downtrend. The current action for the model is considered to be: New Sell – Short Position.
| LIVE CATTLE Futures Statistics | SPECULATORS | COMMERCIALS | SMALL TRADERS |
| – Percent of Open Interest Longs: | 39.9 | 33.6 | 9.9 |
| – Percent of Open Interest Shorts: | 21.2 | 49.5 | 12.7 |
| – Net Position: | 54,133 | -45,886 | -8,247 |
| – Gross Longs: | 115,314 | 97,046 | 28,476 |
| – Gross Shorts: | 61,181 | 142,932 | 36,723 |
| – Long to Short Ratio: | 1.9 to 1 | 0.7 to 1 | 0.8 to 1 |
| NET POSITION TREND: | | | |
| – Strength Index Score (3 Year Range Pct): | 37.3 | 66.6 | 45.8 |
| – Strength Index Reading (3 Year Range): | Bearish | Bullish | Bearish |
| NET POSITION MOVEMENT INDEX: | | | |
| – 6-Week Change in Strength Index: | 7.1 | -7.4 | -2.9 |
LEAN HOGS Futures:
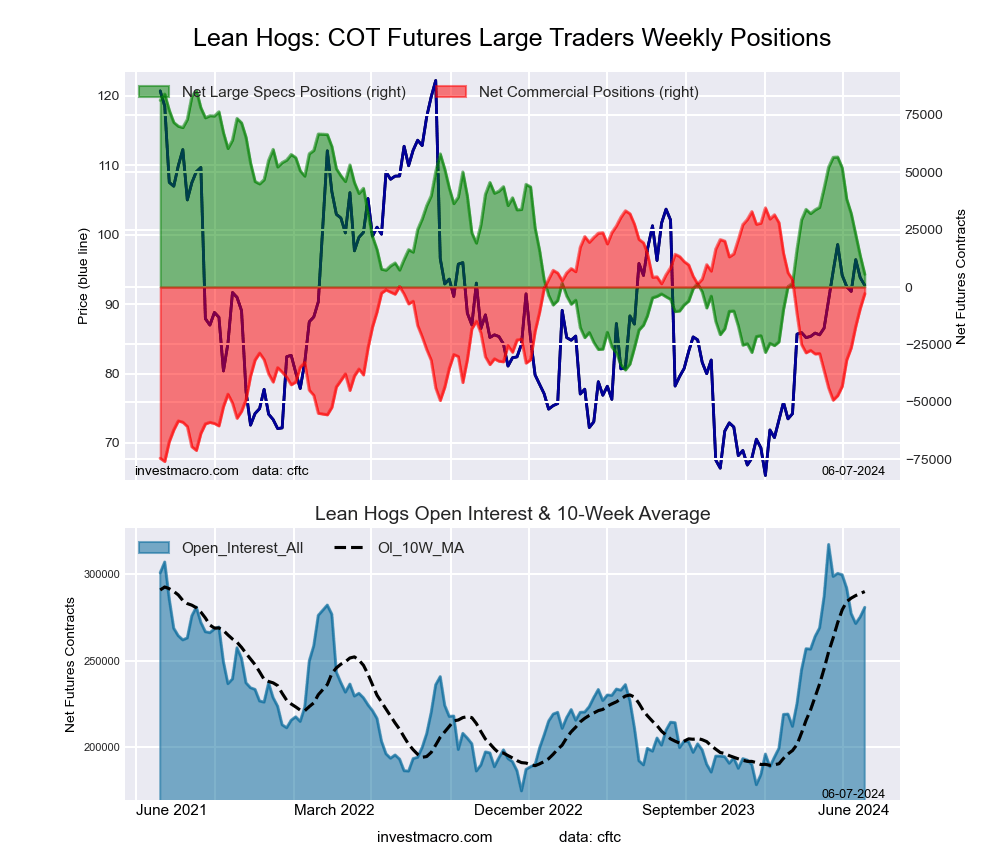 The LEAN HOGS large speculator standing this week resulted in a net position of 5,546 contracts in the data reported through Tuesday. This was a weekly reduction of -8,116 contracts from the previous week which had a total of 13,662 net contracts.
This week’s current strength score (the trader positioning range over the past three years, measured from 0 to 100) shows the speculators are currently Bearish with a score of 34.2 percent. The commercials are Bullish with a score of 66.2 percent and the small traders (not shown in chart) are Bullish with a score of 71.3 percent.
Price Trend-Following Model: Uptrend
Our weekly trend-following model classifies the current market price position as: Uptrend. The current action for the model is considered to be: Hold – Maintain Long Position.
| LEAN HOGS Futures Statistics | SPECULATORS | COMMERCIALS | SMALL TRADERS |
| – Percent of Open Interest Longs: | 28.8 | 39.1 | 7.9 |
| – Percent of Open Interest Shorts: | 26.8 | 40.1 | 8.9 |
| – Net Position: | 5,546 | -2,865 | -2,681 |
| – Gross Longs: | 80,913 | 109,683 | 22,185 |
| – Gross Shorts: | 75,367 | 112,548 | 24,866 |
| – Long to Short Ratio: | 1.1 to 1 | 1.0 to 1 | 0.9 to 1 |
| NET POSITION TREND: | | | |
| – Strength Index Score (3 Year Range Pct): | 34.2 | 66.2 | 71.3 |
| – Strength Index Reading (3 Year Range): | Bearish | Bullish | Bullish |
| NET POSITION MOVEMENT INDEX: | | | |
| – 6-Week Change in Strength Index: | -42.0 | 40.2 | 29.7 |
COTTON Futures:
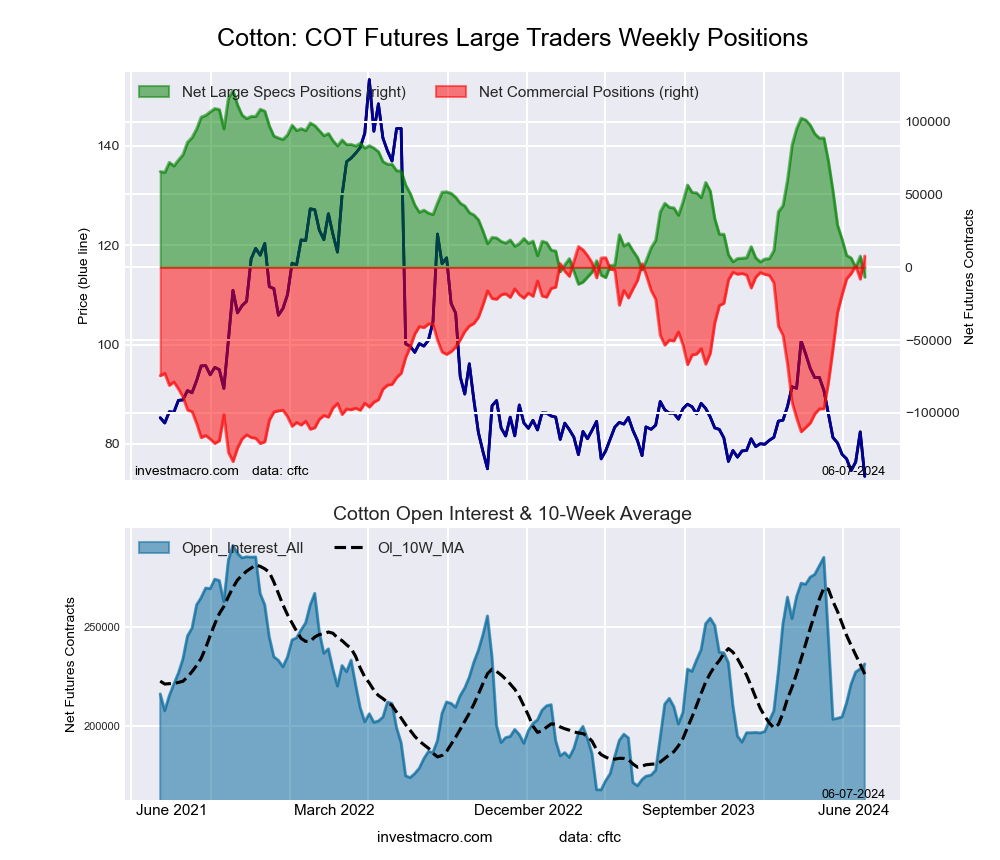 The COTTON large speculator standing this week resulted in a net position of -6,691 contracts in the data reported through Tuesday. This was a weekly fall of -14,369 contracts from the previous week which had a total of 7,678 net contracts.
This week’s current strength score (the trader positioning range over the past three years, measured from 0 to 100) shows the speculators are currently Bearish-Extreme with a score of 3.7 percent. The commercials are Bullish-Extreme with a score of 95.6 percent and the small traders (not shown in chart) are Bearish-Extreme with a score of 9.6 percent.
Price Trend-Following Model: Strong Downtrend
Our weekly trend-following model classifies the current market price position as: Strong Downtrend. The current action for the model is considered to be: Hold – Maintain Short Position.
| COTTON Futures Statistics | SPECULATORS | COMMERCIALS | SMALL TRADERS |
| – Percent of Open Interest Longs: | 29.1 | 46.4 | 5.5 |
| – Percent of Open Interest Shorts: | 32.0 | 43.0 | 6.0 |
| – Net Position: | -6,691 | 7,750 | -1,059 |
| – Gross Longs: | 67,396 | 107,335 | 12,729 |
| – Gross Shorts: | 74,087 | 99,585 | 13,788 |
| – Long to Short Ratio: | 0.9 to 1 | 1.1 to 1 | 0.9 to 1 |
| NET POSITION TREND: | | | |
| – Strength Index Score (3 Year Range Pct): | 3.7 | 95.6 | 9.6 |
| – Strength Index Reading (3 Year Range): | Bearish-Extreme | Bullish-Extreme | Bearish-Extreme |
| NET POSITION MOVEMENT INDEX: | | | |
| – 6-Week Change in Strength Index: | -26.8 | 26.3 | -19.9 |
COCOA Futures:
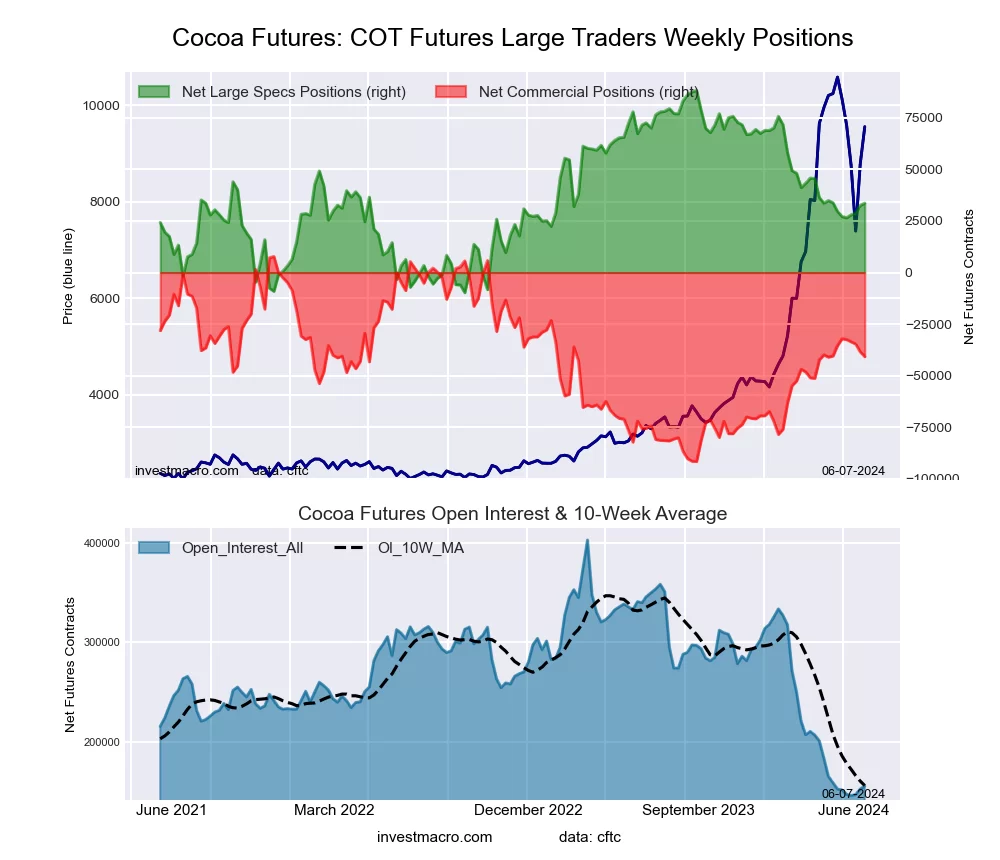 The COCOA large speculator standing this week resulted in a net position of 33,645 contracts in the data reported through Tuesday. This was a weekly lift of 1,075 contracts from the previous week which had a total of 32,570 net contracts.
This week’s current strength score (the trader positioning range over the past three years, measured from 0 to 100) shows the speculators are currently Bearish with a score of 44.3 percent. The commercials are Bullish with a score of 51.1 percent and the small traders (not shown in chart) are Bullish with a score of 73.1 percent.
Price Trend-Following Model: Uptrend
Our weekly trend-following model classifies the current market price position as: Uptrend. The current action for the model is considered to be: Hold – Maintain Long Position.
| COCOA Futures Statistics | SPECULATORS | COMMERCIALS | SMALL TRADERS |
| – Percent of Open Interest Longs: | 31.2 | 34.4 | 8.0 |
| – Percent of Open Interest Shorts: | 9.6 | 60.6 | 3.4 |
| – Net Position: | 33,645 | -40,799 | 7,154 |
| – Gross Longs: | 48,643 | 53,704 | 12,460 |
| – Gross Shorts: | 14,998 | 94,503 | 5,306 |
| – Long to Short Ratio: | 3.2 to 1 | 0.6 to 1 | 2.3 to 1 |
| NET POSITION TREND: | | | |
| – Strength Index Score (3 Year Range Pct): | 44.3 | 51.1 | 73.1 |
| – Strength Index Reading (3 Year Range): | Bearish | Bullish | Bullish |
| NET POSITION MOVEMENT INDEX: | | | |
| – 6-Week Change in Strength Index: | 4.1 | -5.4 | 11.3 |
WHEAT Futures:
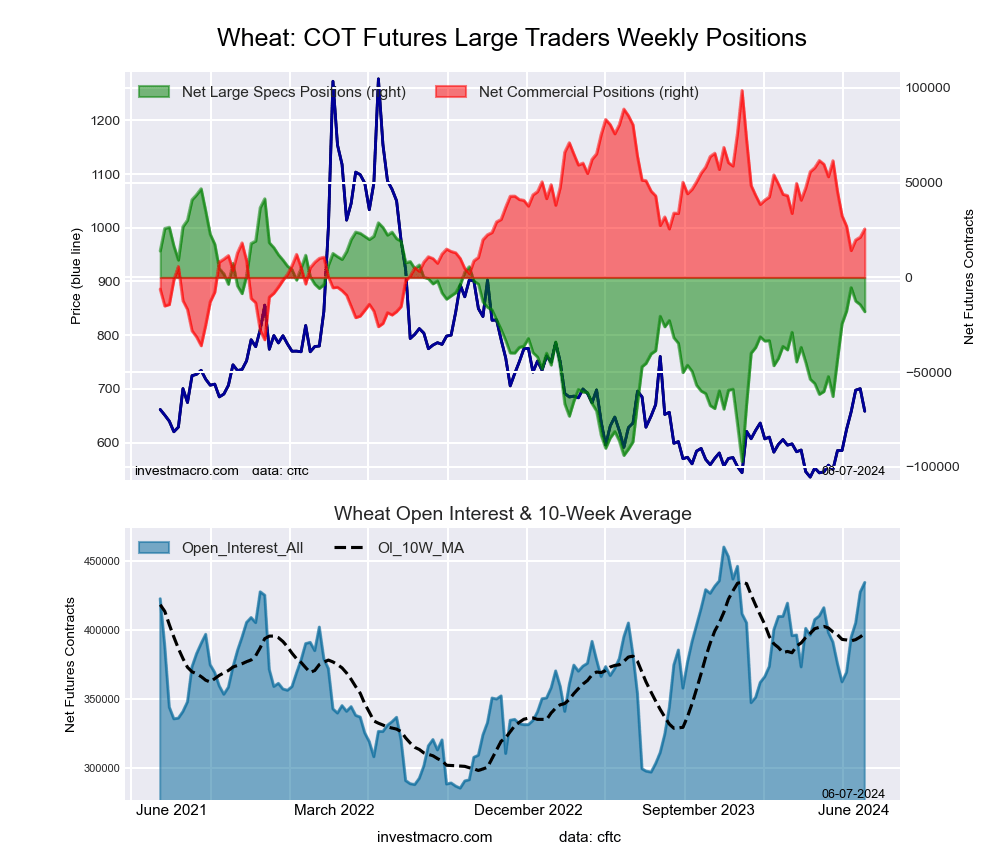 The WHEAT large speculator standing this week resulted in a net position of -18,121 contracts in the data reported through Tuesday. This was a weekly fall of -3,728 contracts from the previous week which had a total of -14,393 net contracts.
This week’s current strength score (the trader positioning range over the past three years, measured from 0 to 100) shows the speculators are currently Bullish with a score of 54.9 percent. The commercials are Bearish with a score of 45.7 percent and the small traders (not shown in chart) are Bearish with a score of 33.9 percent.
Price Trend-Following Model: Strong Uptrend
Our weekly trend-following model classifies the current market price position as: Strong Uptrend. The current action for the model is considered to be: Hold – Maintain Long Position.
| WHEAT Futures Statistics | SPECULATORS | COMMERCIALS | SMALL TRADERS |
| – Percent of Open Interest Longs: | 28.1 | 37.7 | 7.5 |
| – Percent of Open Interest Shorts: | 32.2 | 31.8 | 9.2 |
| – Net Position: | -18,121 | 25,545 | -7,424 |
| – Gross Longs: | 121,898 | 163,904 | 32,453 |
| – Gross Shorts: | 140,019 | 138,359 | 39,877 |
| – Long to Short Ratio: | 0.9 to 1 | 1.2 to 1 | 0.8 to 1 |
| NET POSITION TREND: | | | |
| – Strength Index Score (3 Year Range Pct): | 54.9 | 45.7 | 33.9 |
| – Strength Index Reading (3 Year Range): | Bullish | Bearish | Bearish |
| NET POSITION MOVEMENT INDEX: | | | |
| – 6-Week Change in Strength Index: | 17.5 | -14.6 | -24.2 |
Article By InvestMacro – Receive our weekly COT Newsletter
*COT Report: The COT data, released weekly to the public each Friday, is updated through the most recent Tuesday (data is 3 days old) and shows a quick view of how large speculators or non-commercials (for-profit traders) were positioned in the futures markets.
The CFTC categorizes trader positions according to commercial hedgers (traders who use futures contracts for hedging as part of the business), non-commercials (large traders who speculate to realize trading profits) and nonreportable traders (usually small traders/speculators) as well as their open interest (contracts open in the market at time of reporting). See CFTC criteria here.