By InvestMacro
Here are the latest charts and statistics for the Commitment of Traders (COT) data published by the Commodities Futures Trading Commission (CFTC).
The latest COT data is updated through Tuesday September 17th and shows a quick view of how large traders (for-profit speculators and commercial entities) were positioned in the futures markets.
Weekly Speculator Bets led by VIX & DowJones-Mini
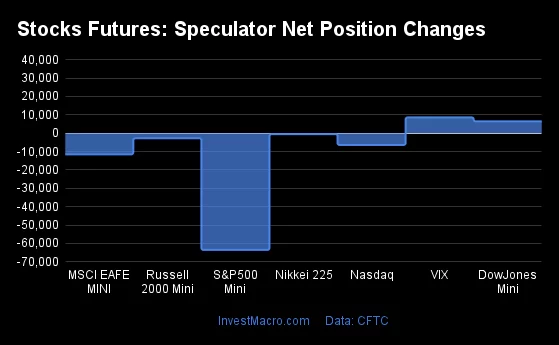
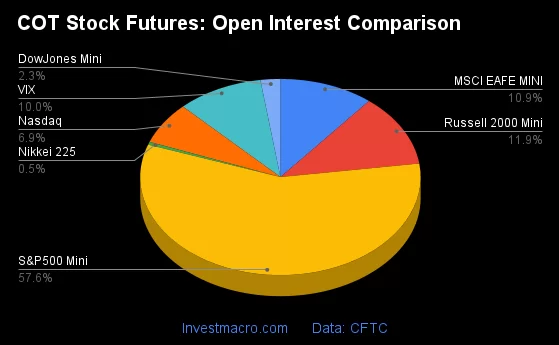
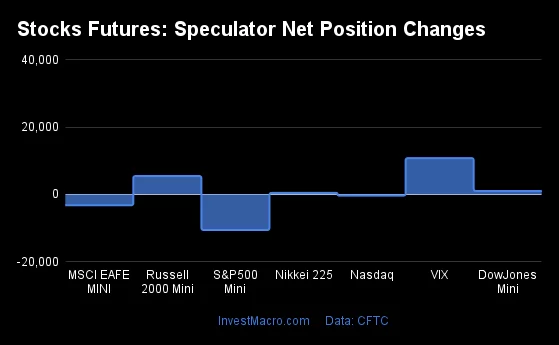
The COT stock markets speculator bets were lower this week as just two out of the seven stock markets we cover had higher positioning while the other five markets had lower speculator contracts.
Leading the gains for the stock markets was the VIX (8,598 contracts) with the DowJones-Mini (6,446 contracts) also showing a positive week.
The markets with the declines in speculator bets this week were the S&P500-Mini (-63,560 contracts), the MSCI EAFE-Mini (-11,500 contracts), the Nasdaq-Mini (-6,393 contracts), the Russell-Mini (-2,741 contracts) and with the Nikkei 225 (-498 contracts) also registering lower bets on the week.
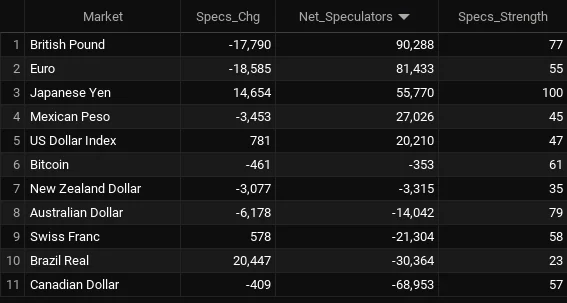
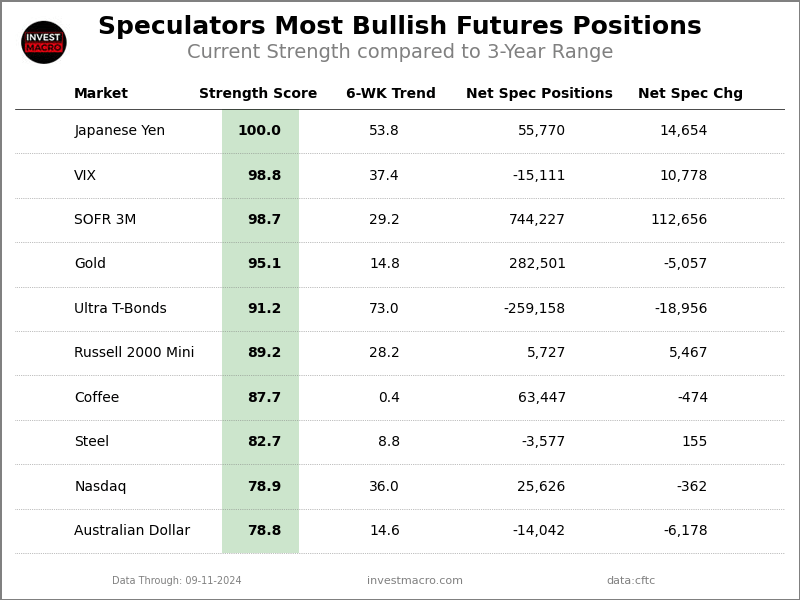
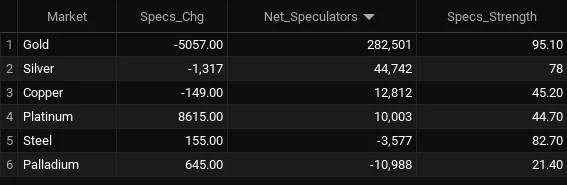
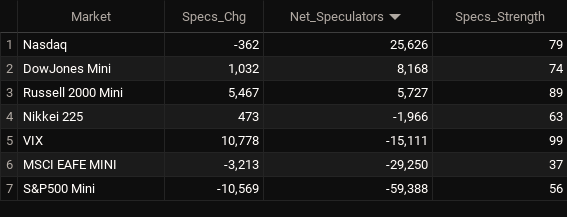
Stock Market Net Speculators Leaderboard
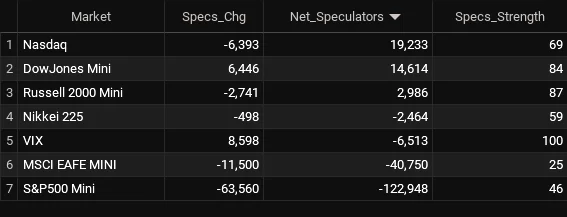
Legend: Weekly Speculators Change | Speculators Current Net Position | Speculators Strength Score compared to last 3-Years (0-100 range)
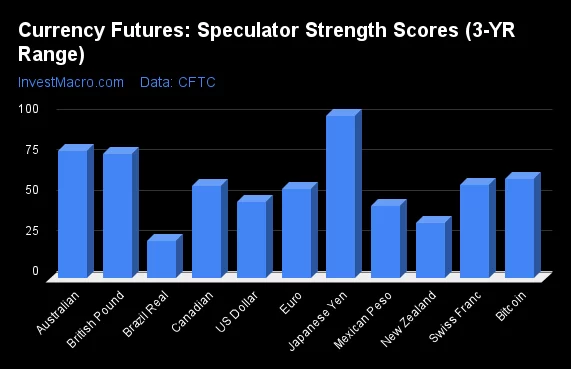
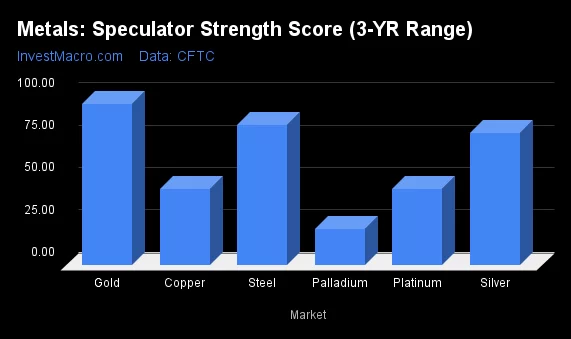
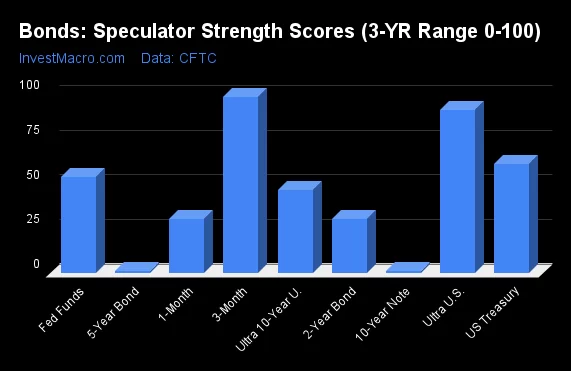
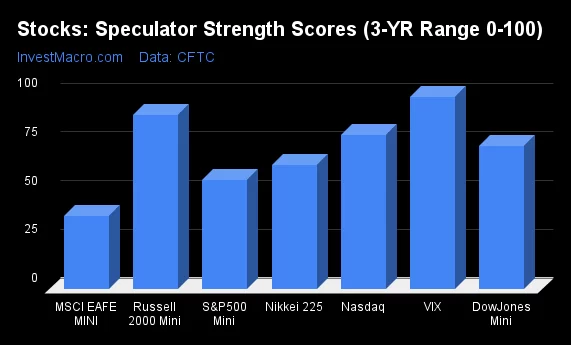
Strength Scores led by VIX & Russell-Mini
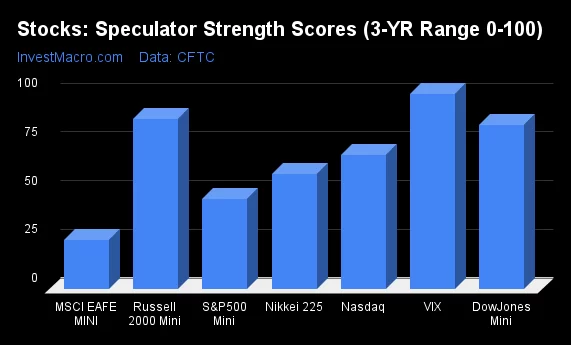
COT Strength Scores (a normalized measure of Speculator positions over a 3-Year range, from 0 to 100 where above 80 is Extreme-Bullish and below 20 is Extreme-Bearish) showed that the VIX (100 percent) and the Russell-Mini (87 percent) lead the stock markets this week. The DowJones-Mini (84 percent) and Nasdaq-Mini (69 percent) come in as the next highest in the weekly strength scores.
On the downside, the MSCI EAFE-Mini (25 percent) comes in at the lowest strength level currently. The next lowest strength score is the S&P500-Mini (46 percent).
Strength Statistics:
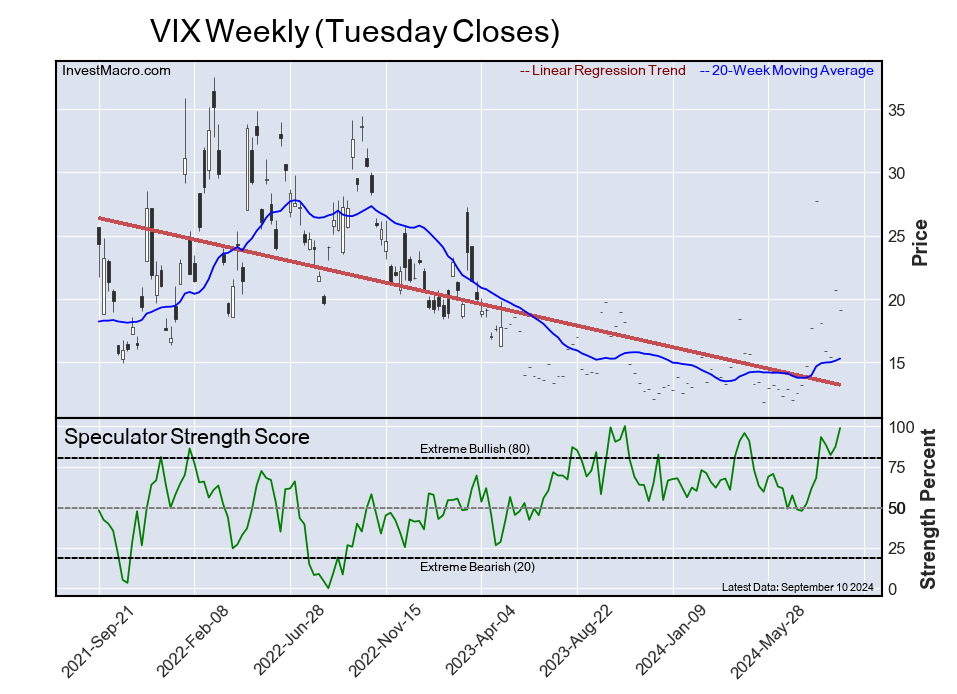
VIX (100.0 percent) vs VIX previous week (91.4 percent)
S&P500-Mini (46.4 percent) vs S&P500-Mini previous week (55.9 percent)
DowJones-Mini (84.1 percent) vs DowJones-Mini previous week (73.6 percent)
Nasdaq-Mini (69.0 percent) vs Nasdaq-Mini previous week (78.9 percent)
Russell2000-Mini (87.2 percent) vs Russell2000-Mini previous week (89.2 percent)
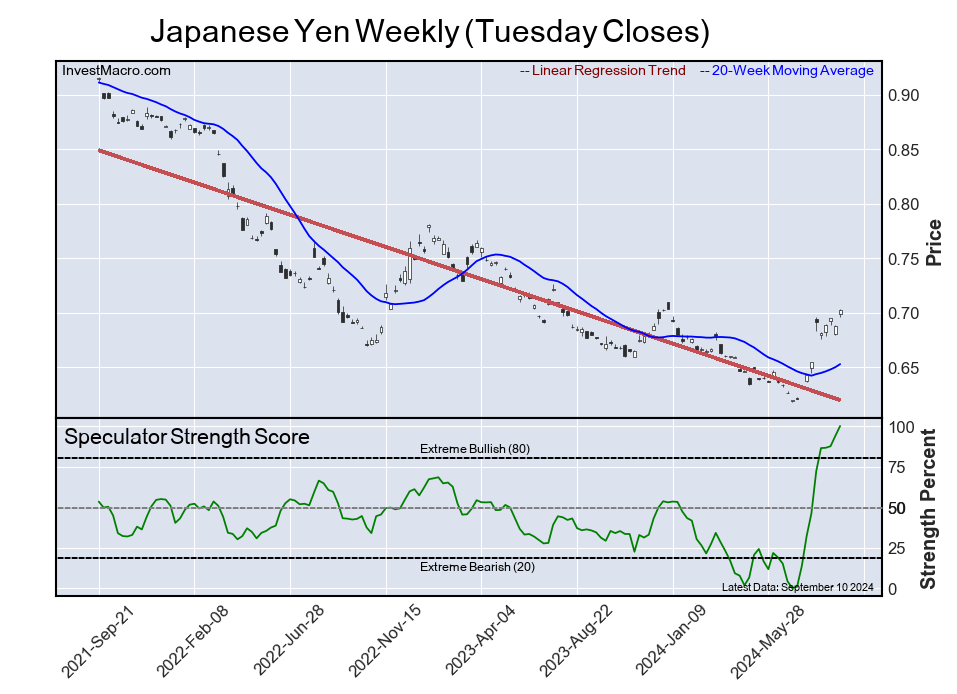
Nikkei USD (59.2 percent) vs Nikkei USD previous week (63.4 percent)
EAFE-Mini (25.1 percent) vs EAFE-Mini previous week (37.4 percent)
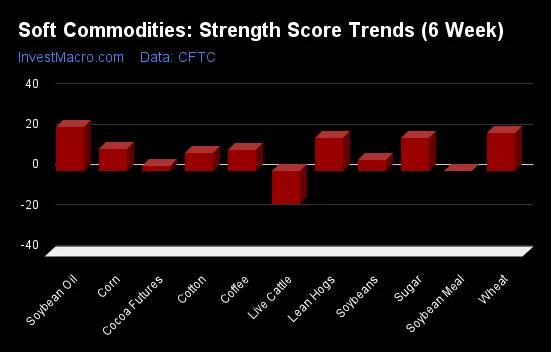
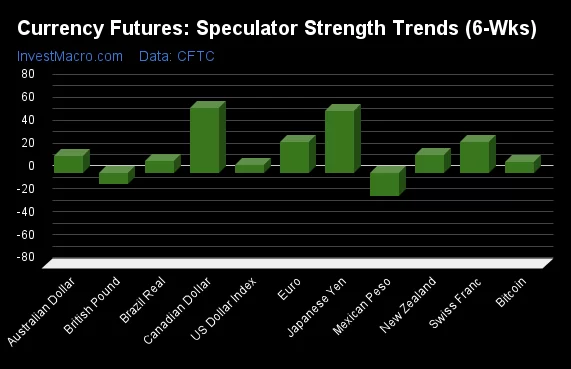
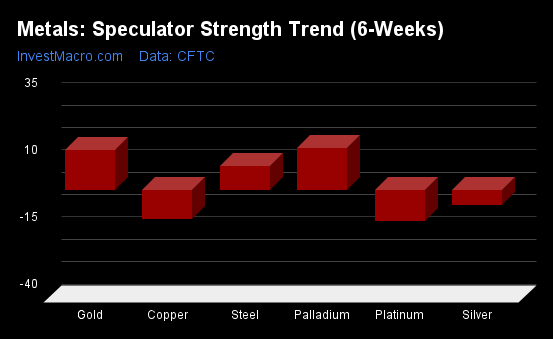
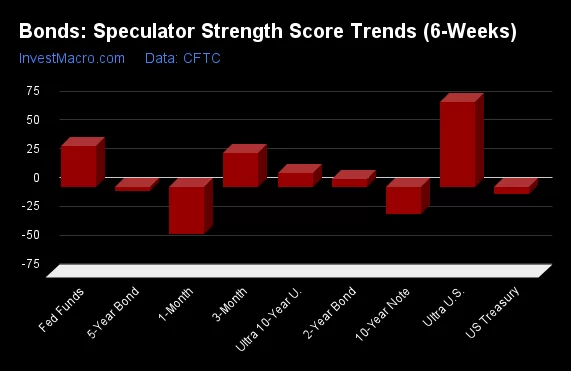
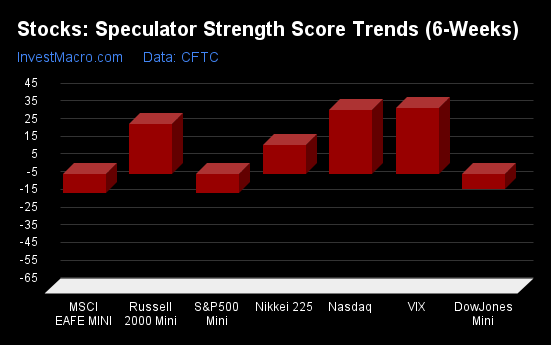
VIX top the 6-Week Strength Trends
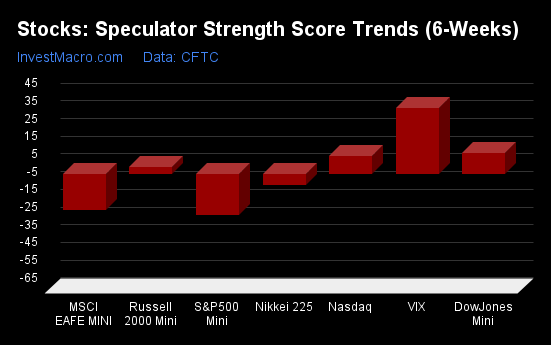
COT Strength Score Trends (or move index, calculates the 6-week changes in strength scores) showed that the VIX (37 percent) leads the past six weeks trends for the stock markets. The DowJones-Mini (12 percent), the Nasdaq-Mini (10 percent) and the Russell-Mini (4 percent) are the next highest positive movers in the latest trends data.
The S&P500-Mini (-23 percent) leads the downside trend scores currently with the MSCI EAFE-Mini (-21 percent) coming in as the next market with lower trend scores.
Strength Trend Statistics:
VIX (37.1 percent) vs VIX previous week (34.6 percent)
S&P500-Mini (-23.4 percent) vs S&P500-Mini previous week (-10.6 percent)
DowJones-Mini (11.8 percent) vs DowJones-Mini previous week (-8.7 percent)
Nasdaq-Mini (10.3 percent) vs Nasdaq-Mini previous week (36.0 percent)
Russell2000-Mini (4.0 percent) vs Russell2000-Mini previous week (28.2 percent)
Nikkei USD (-6.3 percent) vs Nikkei USD previous week (16.2 percent)
EAFE-Mini (-20.6 percent) vs EAFE-Mini previous week (-10.9 percent)
Individual Stock Market Charts:
VIX Volatility Futures:
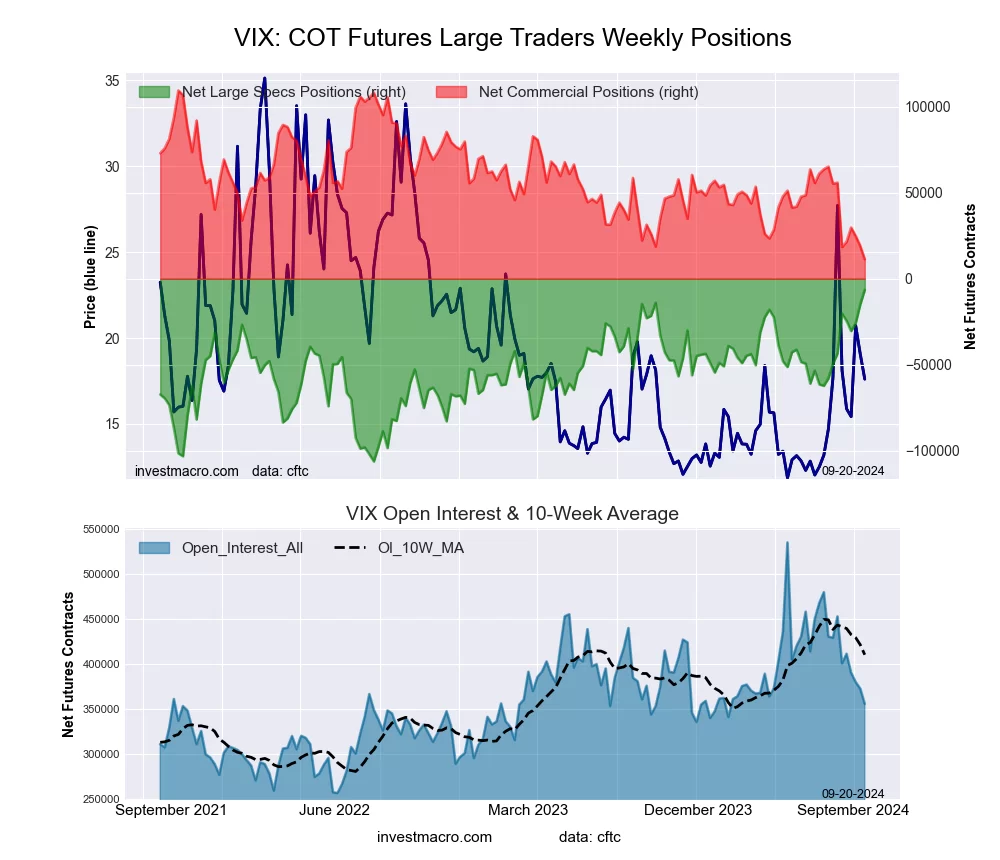 The VIX Volatility large speculator standing this week totaled a net position of -6,513 contracts in the data reported through Tuesday. This was a weekly lift of 8,598 contracts from the previous week which had a total of -15,111 net contracts.
This week’s current strength score (the trader positioning range over the past three years, measured from 0 to 100) shows the speculators are currently Bullish-Extreme with a score of 100.0 percent. The commercials are Bearish-Extreme with a score of 0.0 percent and the small traders (not shown in chart) are Bullish with a score of 64.2 percent.
Price Trend-Following Model: Uptrend
Our weekly trend-following model classifies the current market price position as: Uptrend. The current action for the model is considered to be: Hold – Maintain Long Position.
| VIX Volatility Futures Statistics | SPECULATORS | COMMERCIALS | SMALL TRADERS |
| – Percent of Open Interest Longs: | 20.7 | 42.2 | 7.2 |
| – Percent of Open Interest Shorts: | 22.5 | 39.0 | 8.5 |
| – Net Position: | -6,513 | 11,303 | -4,790 |
| – Gross Longs: | 73,617 | 150,291 | 25,574 |
| – Gross Shorts: | 80,130 | 138,988 | 30,364 |
| – Long to Short Ratio: | 0.9 to 1 | 1.1 to 1 | 0.8 to 1 |
| NET POSITION TREND: | |||
| – Strength Index Score (3 Year Range Pct): | 100.0 | 0.0 | 64.2 |
| – Strength Index Reading (3 Year Range): | Bullish-Extreme | Bearish-Extreme | Bullish |
| NET POSITION MOVEMENT INDEX: | |||
| – 6-Week Change in Strength Index: | 37.1 | -45.3 | 34.2 |
S&P500 Mini Futures:
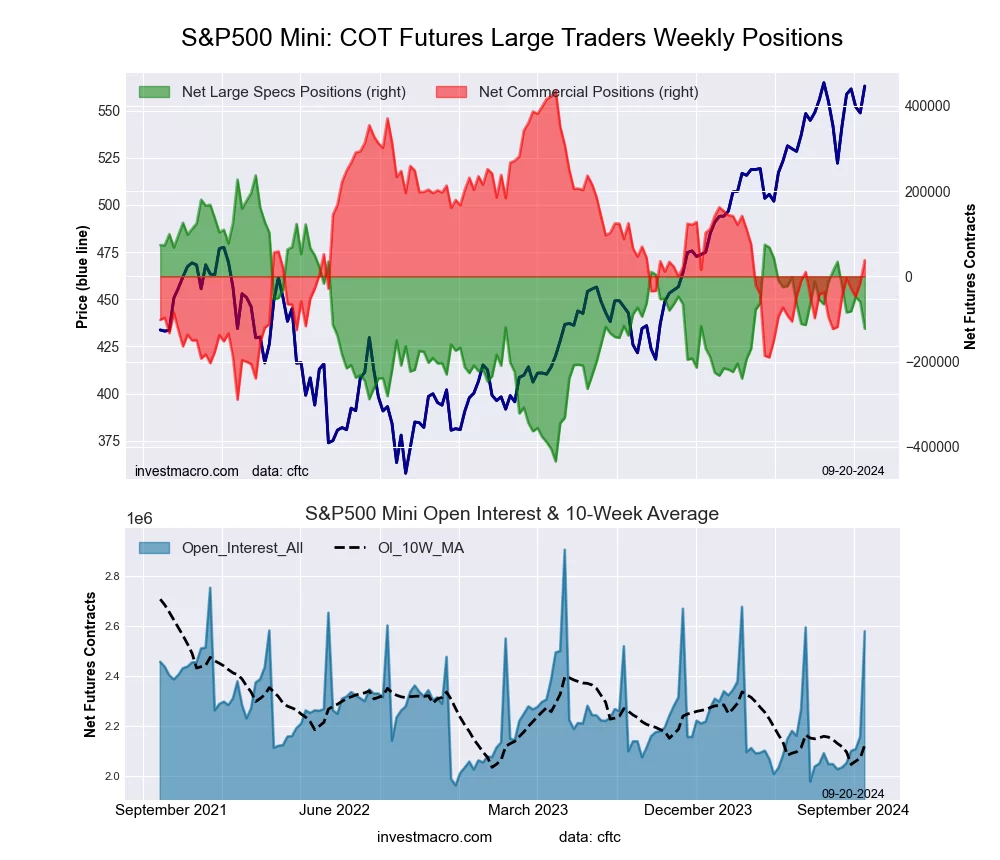 The S&P500 Mini large speculator standing this week totaled a net position of -122,948 contracts in the data reported through Tuesday. This was a weekly lowering of -63,560 contracts from the previous week which had a total of -59,388 net contracts.
This week’s current strength score (the trader positioning range over the past three years, measured from 0 to 100) shows the speculators are currently Bearish with a score of 46.4 percent. The commercials are Bearish with a score of 45.1 percent and the small traders (not shown in chart) are Bullish-Extreme with a score of 82.8 percent.
Price Trend-Following Model: Strong Uptrend
Our weekly trend-following model classifies the current market price position as: Strong Uptrend. The current action for the model is considered to be: Hold – Maintain Long Position.
| S&P500 Mini Futures Statistics | SPECULATORS | COMMERCIALS | SMALL TRADERS |
| – Percent of Open Interest Longs: | 11.6 | 72.1 | 10.7 |
| – Percent of Open Interest Shorts: | 16.3 | 70.7 | 7.4 |
| – Net Position: | -122,948 | 37,745 | 85,203 |
| – Gross Longs: | 298,516 | 1,860,927 | 277,262 |
| – Gross Shorts: | 421,464 | 1,823,182 | 192,059 |
| – Long to Short Ratio: | 0.7 to 1 | 1.0 to 1 | 1.4 to 1 |
| NET POSITION TREND: | |||
| – Strength Index Score (3 Year Range Pct): | 46.4 | 45.1 | 82.8 |
| – Strength Index Reading (3 Year Range): | Bearish | Bearish | Bullish-Extreme |
| NET POSITION MOVEMENT INDEX: | |||
| – 6-Week Change in Strength Index: | -23.4 | 21.6 | 0.3 |
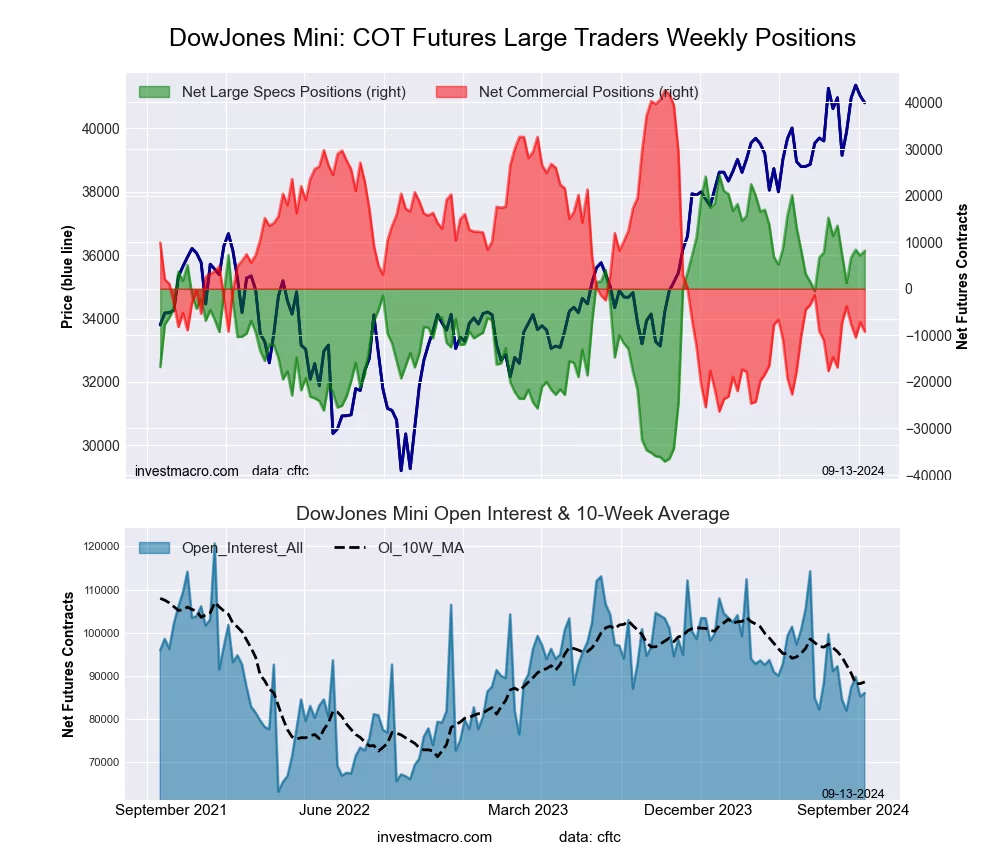
Dow Jones Mini Futures:
 The Dow Jones Mini large speculator standing this week totaled a net position of 14,614 contracts in the data reported through Tuesday. This was a weekly gain of 6,446 contracts from the previous week which had a total of 8,168 net contracts.
This week’s current strength score (the trader positioning range over the past three years, measured from 0 to 100) shows the speculators are currently Bullish-Extreme with a score of 84.1 percent. The commercials are Bearish-Extreme with a score of 15.0 percent and the small traders (not shown in chart) are Bullish with a score of 62.8 percent.
Price Trend-Following Model: Strong Uptrend
Our weekly trend-following model classifies the current market price position as: Strong Uptrend. The current action for the model is considered to be: Hold – Maintain Long Position.
| Dow Jones Mini Futures Statistics | SPECULATORS | COMMERCIALS | SMALL TRADERS |
| – Percent of Open Interest Longs: | 23.0 | 56.8 | 16.5 |
| – Percent of Open Interest Shorts: | 8.1 | 73.1 | 15.1 |
| – Net Position: | 14,614 | -15,981 | 1,367 |
| – Gross Longs: | 22,588 | 55,756 | 16,195 |
| – Gross Shorts: | 7,974 | 71,737 | 14,828 |
| – Long to Short Ratio: | 2.8 to 1 | 0.8 to 1 | 1.1 to 1 |
| NET POSITION TREND: | |||
| – Strength Index Score (3 Year Range Pct): | 84.1 | 15.0 | 62.8 |
| – Strength Index Reading (3 Year Range): | Bullish-Extreme | Bearish-Extreme | Bullish |
| NET POSITION MOVEMENT INDEX: | |||
| – 6-Week Change in Strength Index: | 11.8 | -12.6 | 8.6 |
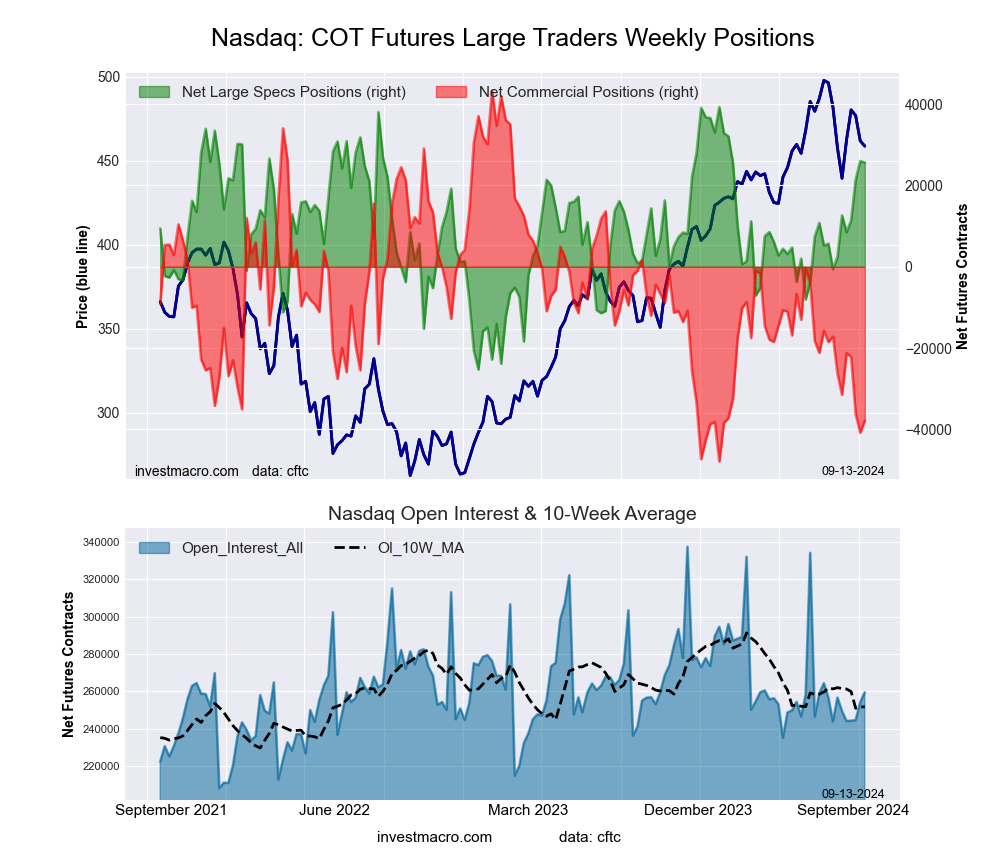
Nasdaq Mini Futures:
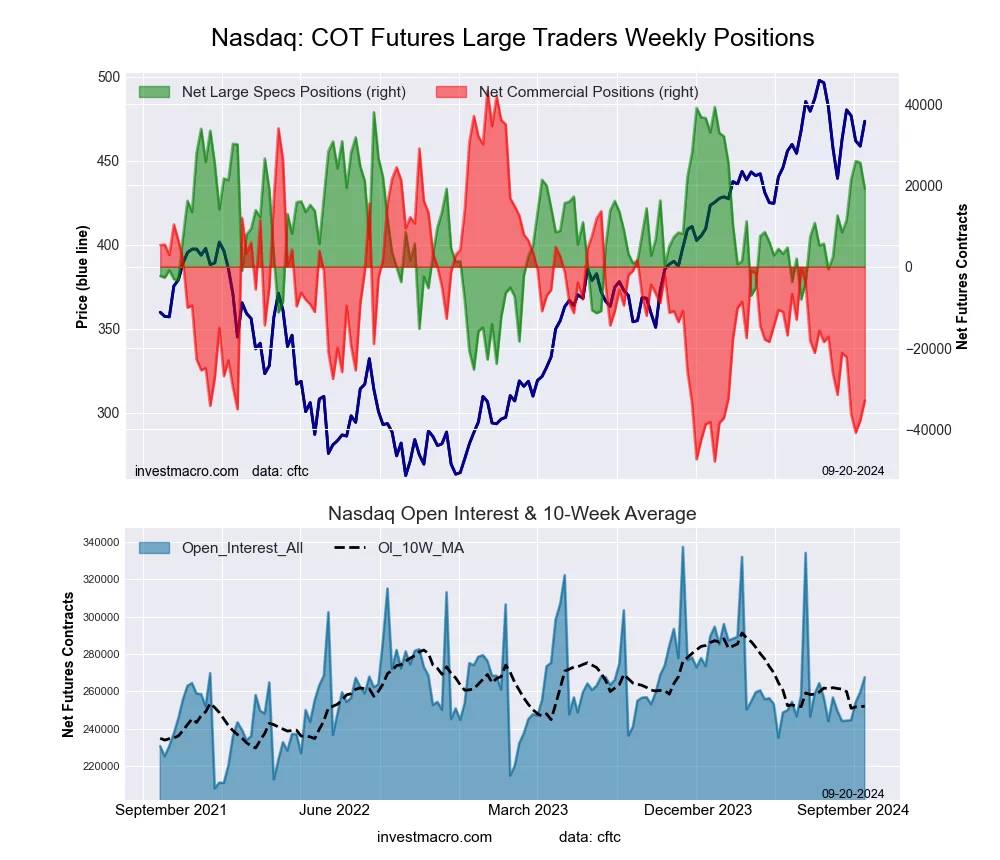 The Nasdaq Mini large speculator standing this week totaled a net position of 19,233 contracts in the data reported through Tuesday. This was a weekly fall of -6,393 contracts from the previous week which had a total of 25,626 net contracts.
This week’s current strength score (the trader positioning range over the past three years, measured from 0 to 100) shows the speculators are currently Bullish with a score of 69.0 percent. The commercials are Bearish-Extreme with a score of 16.4 percent and the small traders (not shown in chart) are Bullish-Extreme with a score of 80.7 percent.
Price Trend-Following Model: Strong Uptrend
Our weekly trend-following model classifies the current market price position as: Strong Uptrend. The current action for the model is considered to be: Hold – Maintain Long Position.
| Nasdaq Mini Futures Statistics | SPECULATORS | COMMERCIALS | SMALL TRADERS |
| – Percent of Open Interest Longs: | 25.5 | 55.4 | 15.7 |
| – Percent of Open Interest Shorts: | 18.3 | 67.7 | 10.6 |
| – Net Position: | 19,233 | -32,928 | 13,695 |
| – Gross Longs: | 68,287 | 148,042 | 42,112 |
| – Gross Shorts: | 49,054 | 180,970 | 28,417 |
| – Long to Short Ratio: | 1.4 to 1 | 0.8 to 1 | 1.5 to 1 |
| NET POSITION TREND: | |||
| – Strength Index Score (3 Year Range Pct): | 69.0 | 16.4 | 80.7 |
| – Strength Index Reading (3 Year Range): | Bullish | Bearish-Extreme | Bullish-Extreme |
| NET POSITION MOVEMENT INDEX: | |||
| – 6-Week Change in Strength Index: | 10.3 | -1.6 | -9.9 |
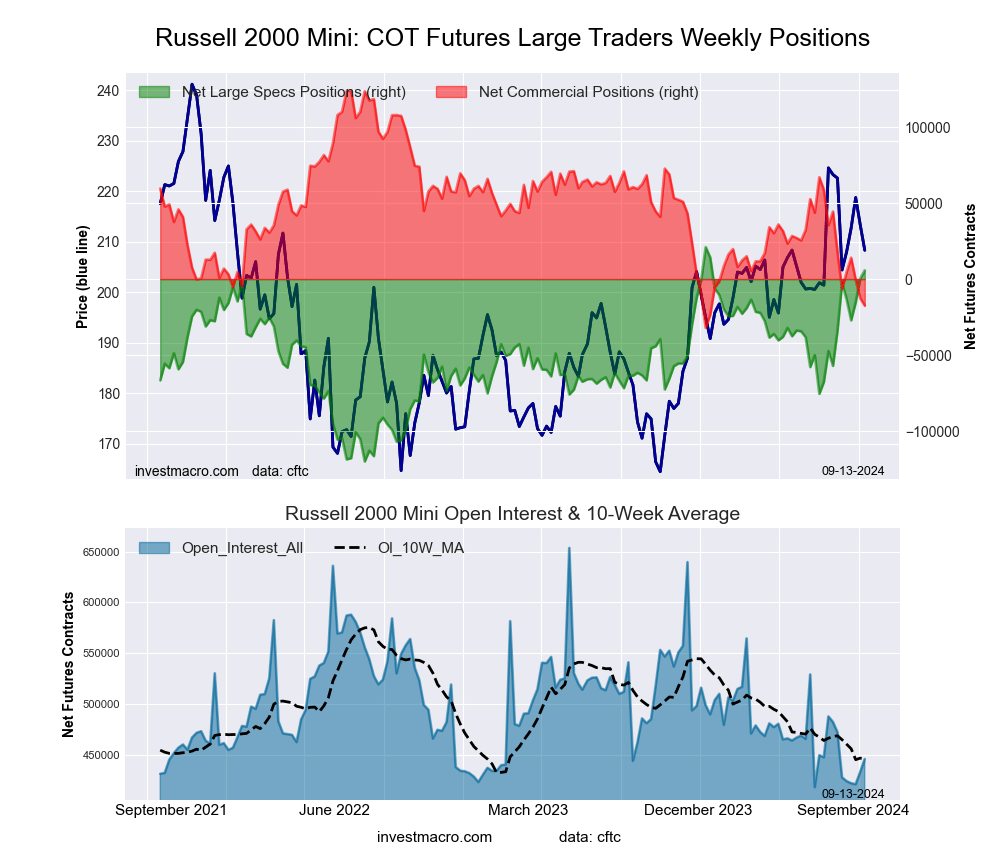
Russell 2000 Mini Futures:
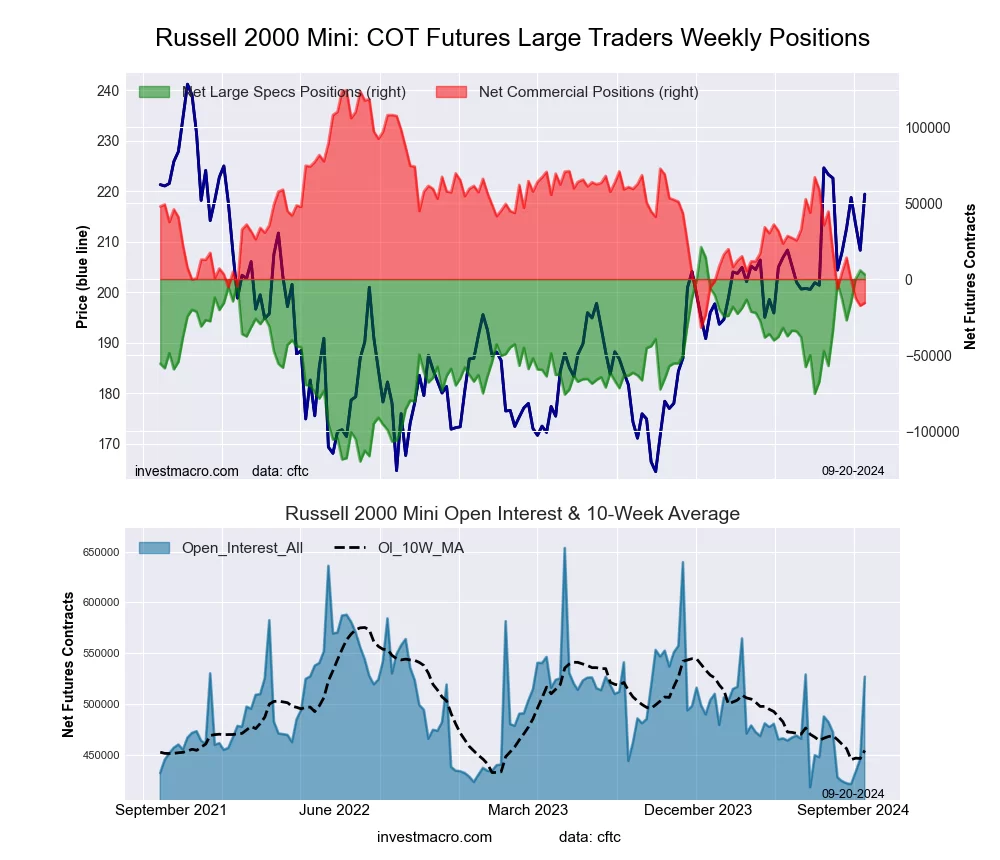 The Russell 2000 Mini large speculator standing this week totaled a net position of 2,986 contracts in the data reported through Tuesday. This was a weekly decrease of -2,741 contracts from the previous week which had a total of 5,727 net contracts.
This week’s current strength score (the trader positioning range over the past three years, measured from 0 to 100) shows the speculators are currently Bullish-Extreme with a score of 87.2 percent. The commercials are Bearish-Extreme with a score of 10.4 percent and the small traders (not shown in chart) are Bullish with a score of 71.8 percent.
Price Trend-Following Model: Strong Uptrend
Our weekly trend-following model classifies the current market price position as: Strong Uptrend. The current action for the model is considered to be: Hold – Maintain Long Position.
| Russell 2000 Mini Futures Statistics | SPECULATORS | COMMERCIALS | SMALL TRADERS |
| – Percent of Open Interest Longs: | 14.8 | 73.0 | 6.1 |
| – Percent of Open Interest Shorts: | 14.3 | 76.0 | 3.7 |
| – Net Position: | 2,986 | -15,705 | 12,719 |
| – Gross Longs: | 78,186 | 384,670 | 32,407 |
| – Gross Shorts: | 75,200 | 400,375 | 19,688 |
| – Long to Short Ratio: | 1.0 to 1 | 1.0 to 1 | 1.6 to 1 |
| NET POSITION TREND: | |||
| – Strength Index Score (3 Year Range Pct): | 87.2 | 10.4 | 71.8 |
| – Strength Index Reading (3 Year Range): | Bullish-Extreme | Bearish-Extreme | Bullish |
| NET POSITION MOVEMENT INDEX: | |||
| – 6-Week Change in Strength Index: | 4.0 | -5.9 | 12.2 |
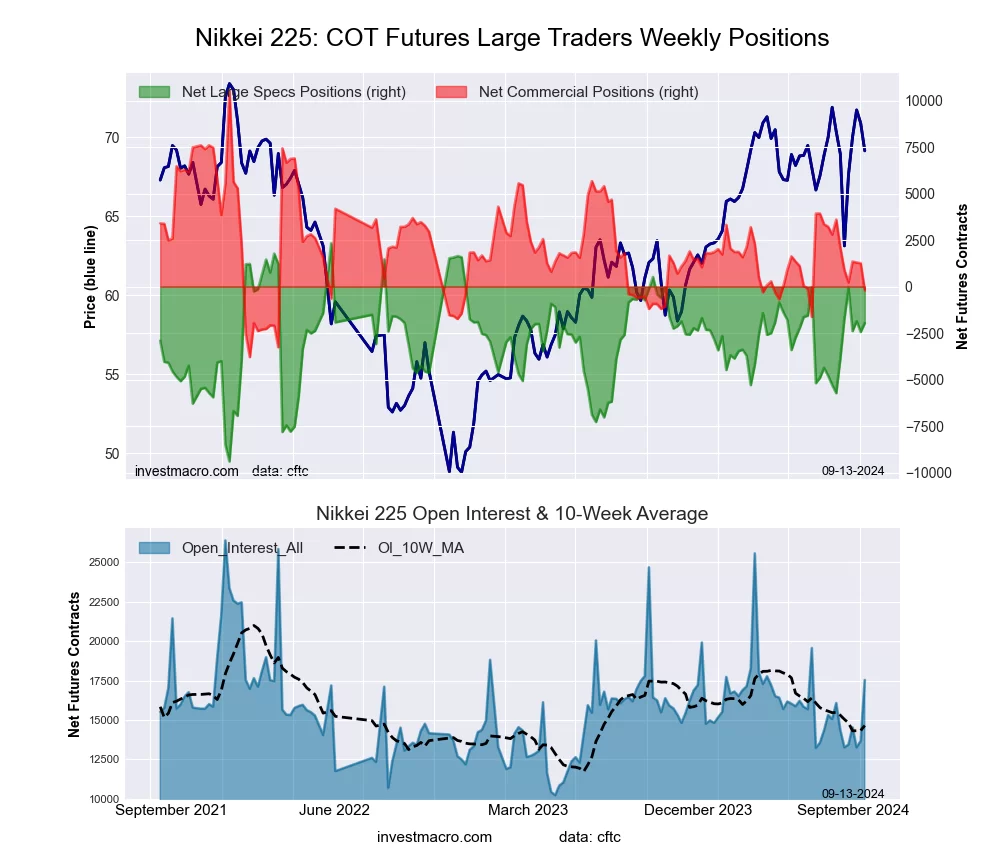
Nikkei Stock Average (USD) Futures:
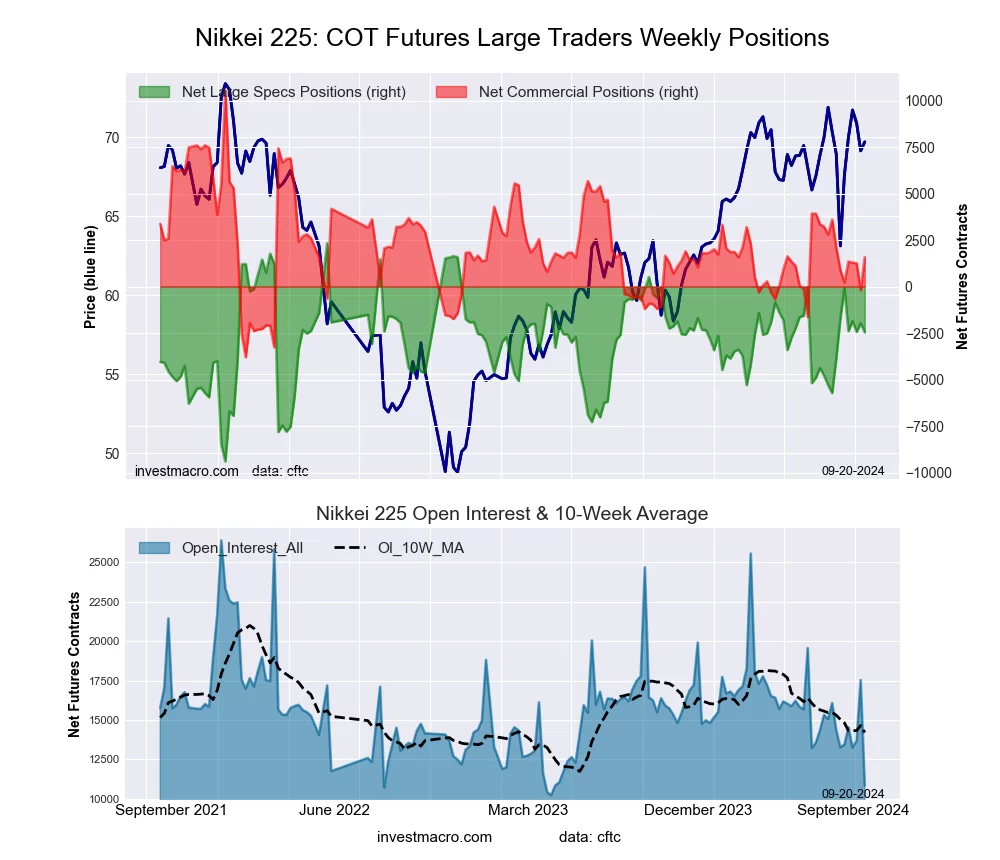 The Nikkei Stock Average (USD) large speculator standing this week totaled a net position of -2,464 contracts in the data reported through Tuesday. This was a weekly lowering of -498 contracts from the previous week which had a total of -1,966 net contracts.
This week’s current strength score (the trader positioning range over the past three years, measured from 0 to 100) shows the speculators are currently Bullish with a score of 59.2 percent. The commercials are Bearish with a score of 37.5 percent and the small traders (not shown in chart) are Bullish with a score of 60.1 percent.
Price Trend-Following Model: Strong Uptrend
Our weekly trend-following model classifies the current market price position as: Strong Uptrend. The current action for the model is considered to be: Hold – Maintain Long Position.
| Nikkei Stock Average Futures Statistics | SPECULATORS | COMMERCIALS | SMALL TRADERS |
| – Percent of Open Interest Longs: | 2.0 | 70.2 | 27.7 |
| – Percent of Open Interest Shorts: | 24.7 | 55.7 | 19.5 |
| – Net Position: | -2,464 | 1,576 | 888 |
| – Gross Longs: | 221 | 7,620 | 3,008 |
| – Gross Shorts: | 2,685 | 6,044 | 2,120 |
| – Long to Short Ratio: | 0.1 to 1 | 1.3 to 1 | 1.4 to 1 |
| NET POSITION TREND: | |||
| – Strength Index Score (3 Year Range Pct): | 59.2 | 37.5 | 60.1 |
| – Strength Index Reading (3 Year Range): | Bullish | Bearish | Bullish |
| NET POSITION MOVEMENT INDEX: | |||
| – 6-Week Change in Strength Index: | -6.3 | 4.8 | 1.0 |
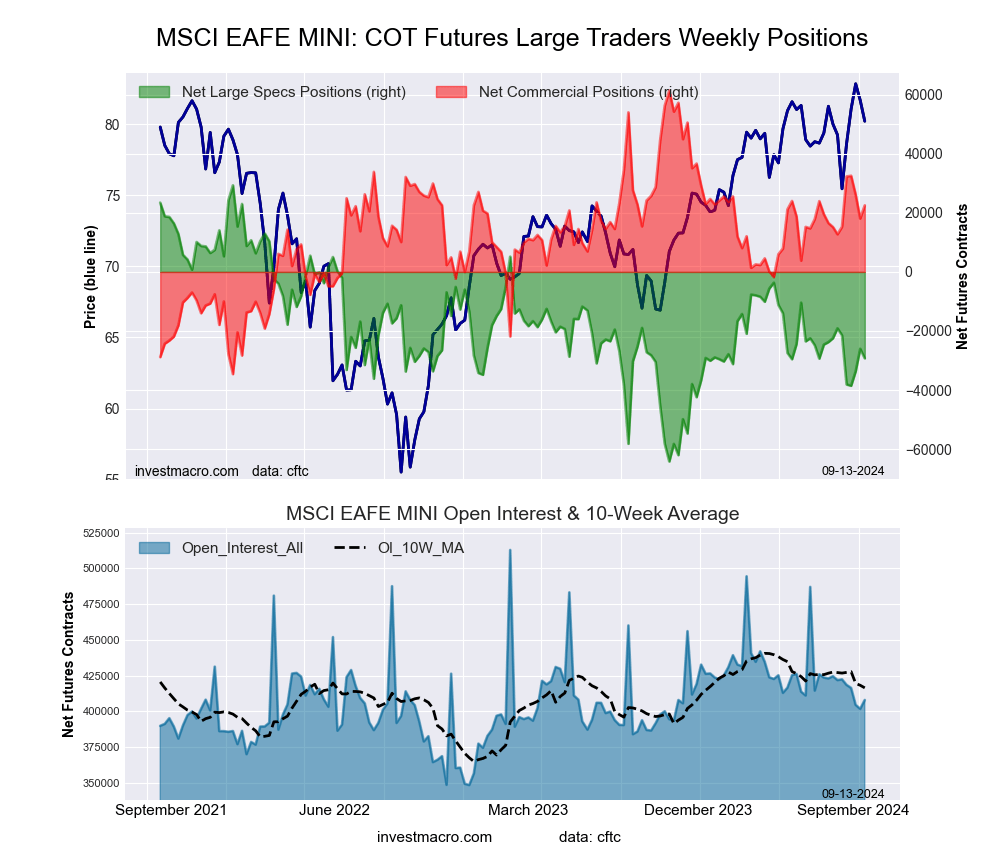
MSCI EAFE Mini Futures:
 The MSCI EAFE Mini large speculator standing this week totaled a net position of -40,750 contracts in the data reported through Tuesday. This was a weekly fall of -11,500 contracts from the previous week which had a total of -29,250 net contracts.
This week’s current strength score (the trader positioning range over the past three years, measured from 0 to 100) shows the speculators are currently Bearish with a score of 25.1 percent. The commercials are Bullish with a score of 71.6 percent and the small traders (not shown in chart) are Bearish with a score of 49.9 percent.
Price Trend-Following Model: Strong Uptrend
Our weekly trend-following model classifies the current market price position as: Strong Uptrend. The current action for the model is considered to be: Hold – Maintain Long Position.
| MSCI EAFE Mini Futures Statistics | SPECULATORS | COMMERCIALS | SMALL TRADERS |
| – Percent of Open Interest Longs: | 5.5 | 90.0 | 3.8 |
| – Percent of Open Interest Shorts: | 13.4 | 83.4 | 2.6 |
| – Net Position: | -40,750 | 34,144 | 6,606 |
| – Gross Longs: | 28,094 | 463,792 | 19,771 |
| – Gross Shorts: | 68,844 | 429,648 | 13,165 |
| – Long to Short Ratio: | 0.4 to 1 | 1.1 to 1 | 1.5 to 1 |
| NET POSITION TREND: | |||
| – Strength Index Score (3 Year Range Pct): | 25.1 | 71.6 | 49.9 |
| – Strength Index Reading (3 Year Range): | Bearish | Bullish | Bearish |
| NET POSITION MOVEMENT INDEX: | |||
| – 6-Week Change in Strength Index: | -20.6 | 19.6 | 2.1 |
Article By InvestMacro – Receive our weekly COT Newsletter
*COT Report: The COT data, released weekly to the public each Friday, is updated through the most recent Tuesday (data is 3 days old) and shows a quick view of how large speculators or non-commercials (for-profit traders) were positioned in the futures markets.
The CFTC categorizes trader positions according to commercial hedgers (traders who use futures contracts for hedging as part of the business), non-commercials (large traders who speculate to realize trading profits) and nonreportable traders (usually small traders/speculators) as well as their open interest (contracts open in the market at time of reporting). See CFTC criteria here.