By InvestMacro
Here are the latest charts and statistics for the Commitment of Traders (COT) reports data published by the Commodities Futures Trading Commission (CFTC).
The latest COT data is updated through Tuesday March 31st and shows a quick view of how large traders (for-profit speculators and commercial hedgers) were positioned in the futures markets.
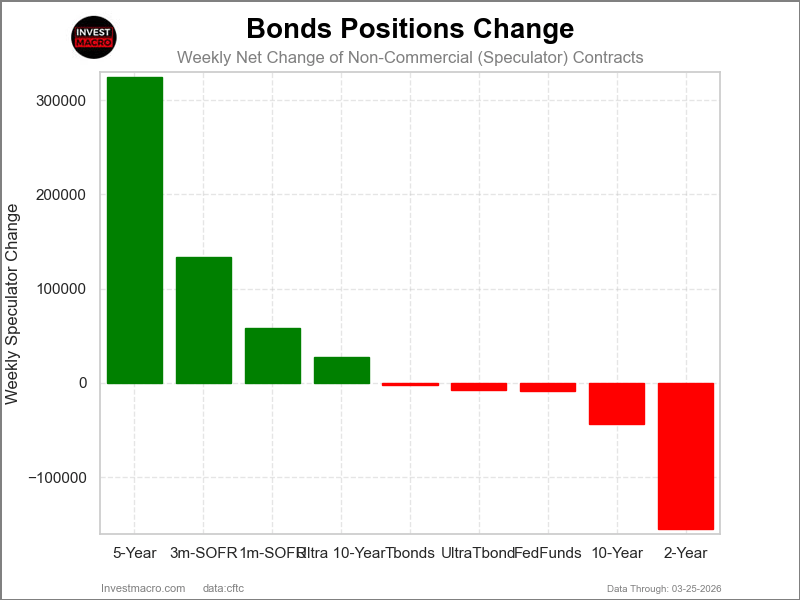
Weekly Speculator Changes led by SOFR 1-Month
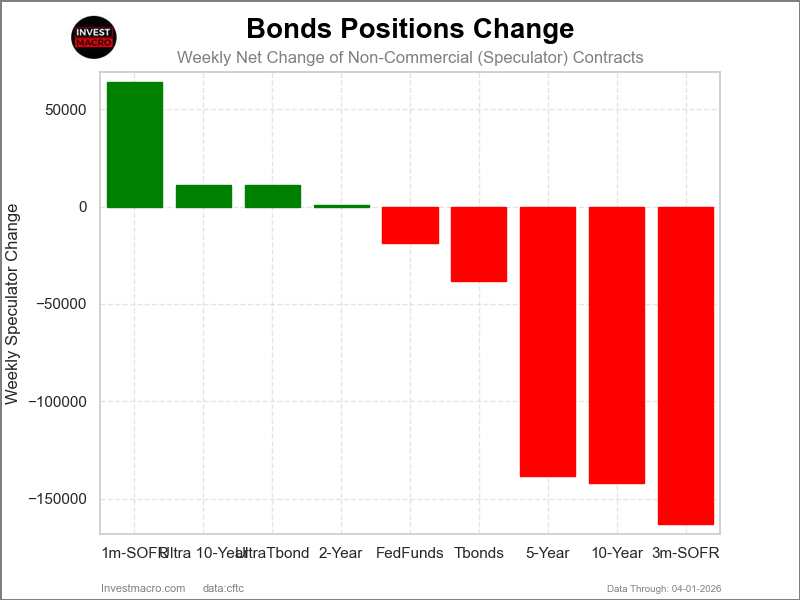
The COT bond market speculator bets were overall lower this week as four out of the nine bond markets we cover had higher positioning while the other five markets had lower speculator contracts.
Leading the gains for the bond markets was the SOFR 1-Month (64,159 contracts) with the Ultra 10-Year Bonds (11,341 contracts), the Ultra Treasury Bonds (11,058 contracts) and the 2-Year Bonds (855 contracts) also showing positive weeks.
The bond markets with declines in speculator bets for the week were the SOFR 3-Months (-163,229 contracts), the 10-Year Bonds (-142,176 contracts), the 5-Year Bonds (-138,404 contracts), the US Treasury Bonds (-38,203 contracts) and with the Fed Funds (-18,664 contracts) also seeing lower bets on the week.
The Bond market price performances were higher across the board this week
The major Bond Markets were led higher this week in price performance by the long U.S. Treasury Bond, which rose by 0.55% over the past five days. The 10-Year Note followed along with a 0.24% increase, while the 5-Year Bond was higher by 0.11%.
The 2-Year Bond was slightly higher with a 0.03% uptick, and the Fed Funds Futures saw a minuscule edge higher by 0.01%. The 1-Month Secured Overnight Financing Rate also was up by 0.01%, as was the 3-Month Secured Overnight Financing Rate, which also rose by 0.01%.
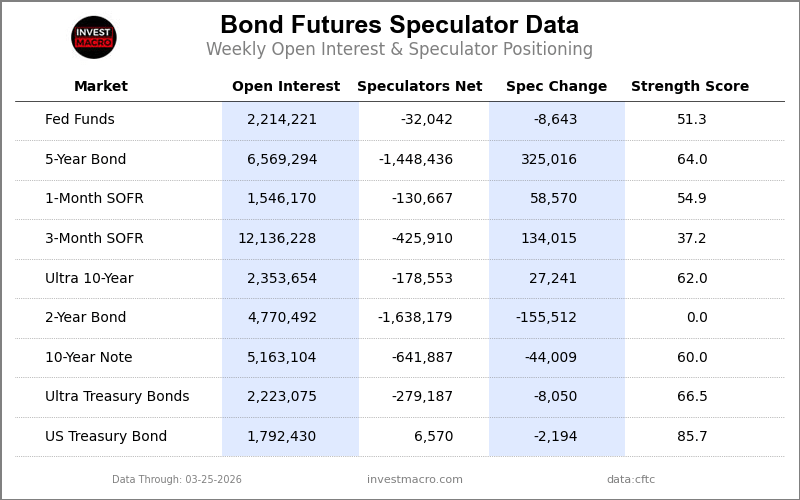
Bonds Data:
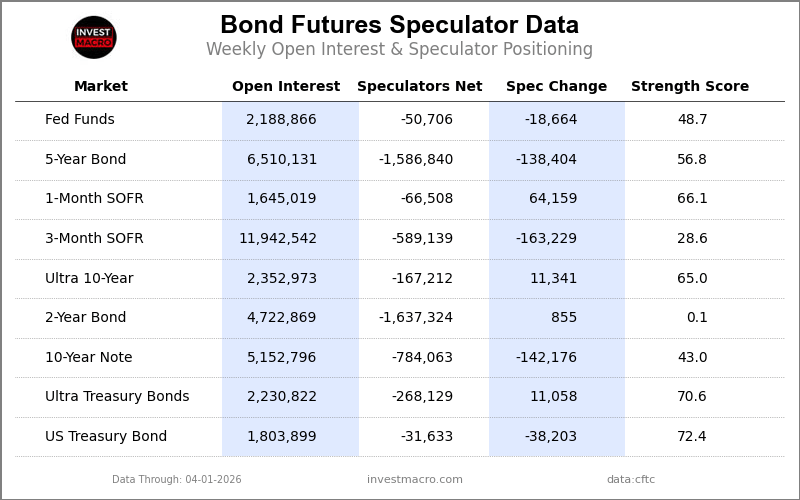
Legend: Open Interest | Speculators Current Net Position | Weekly Specs Change | Specs Strength Score compared to last 3-Years (0-100 range)
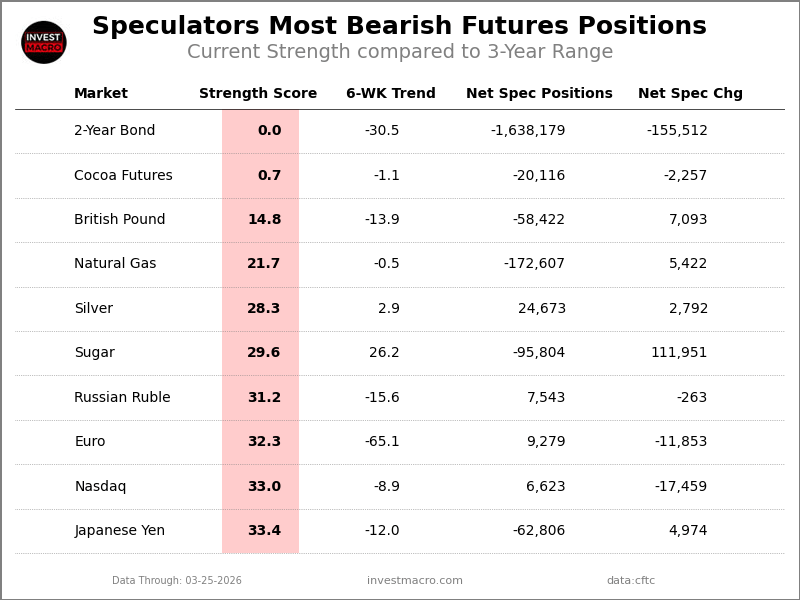
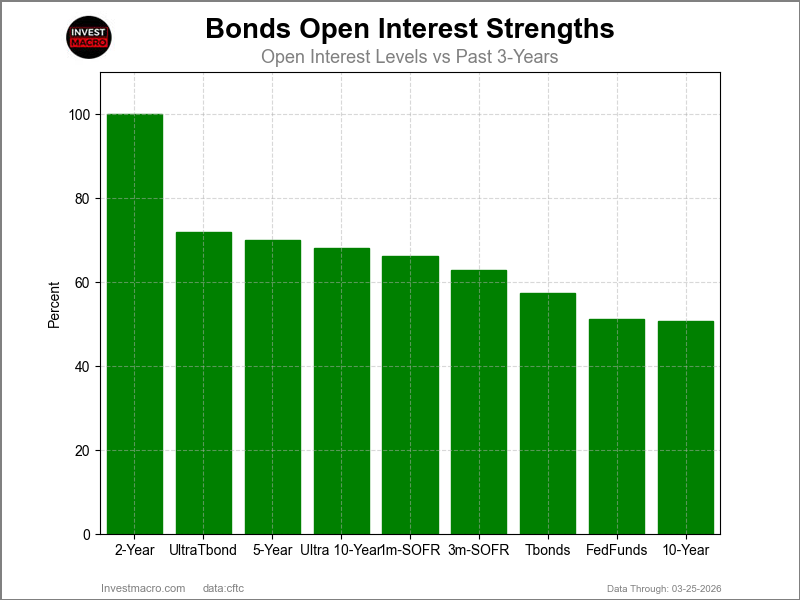
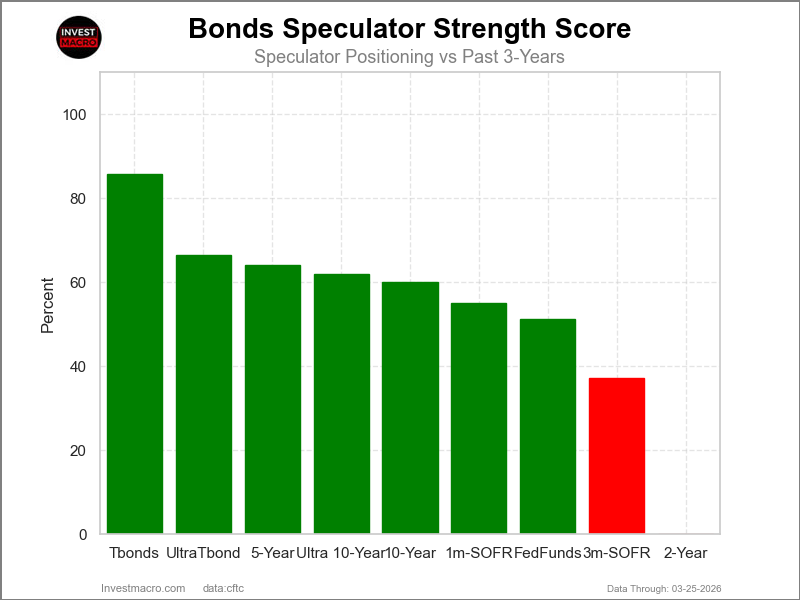
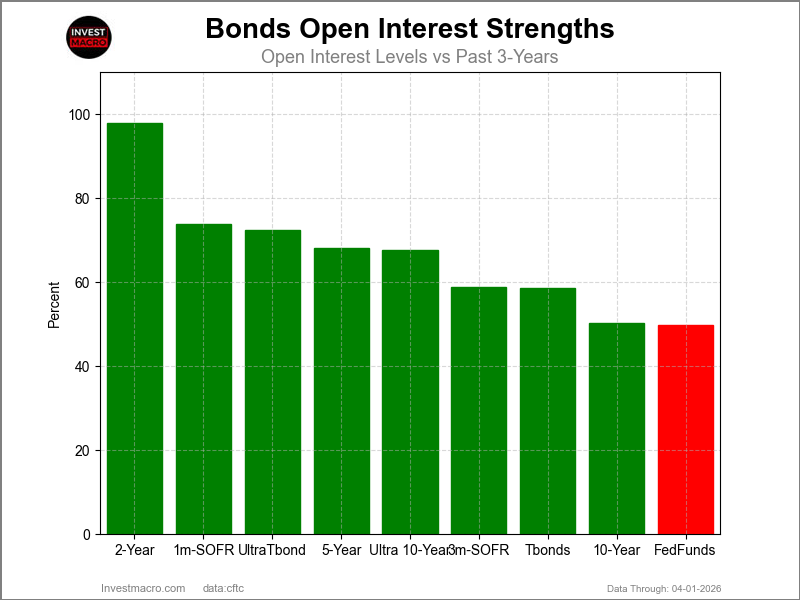
Strength Scores led by US Treasury Bonds & Ultra Treasury Bonds
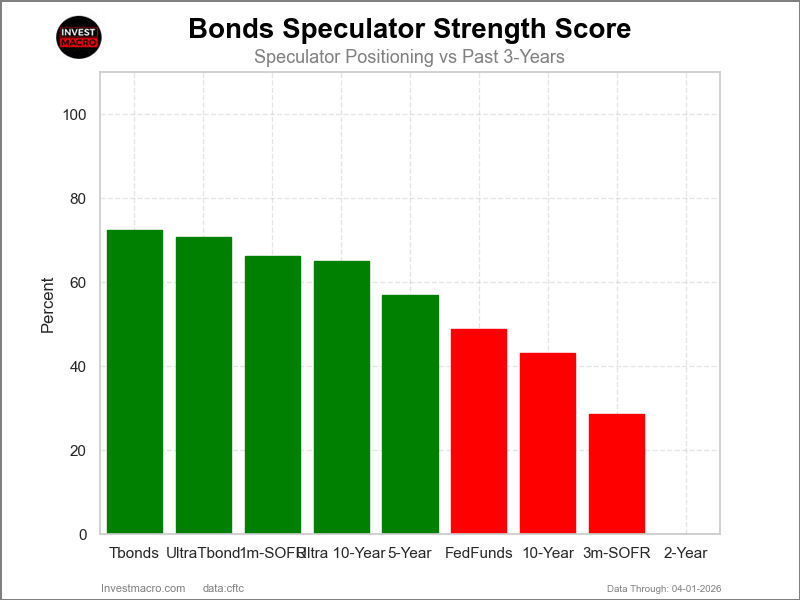
COT Strength Scores (a normalized measure of Speculator positions over a 3-Year range, from 0 to 100 where above 80 is Extreme-Bullish and below 20 is Extreme-Bearish) showed that the US Treasury Bonds (72 percent) and the Ultra Treasury Bonds (71 percent) lead the bond markets this week. The SOFR 1-Month (66 percent) comes in as the next highest in the weekly strength scores.
On the downside, the 2-Year Bond (0 percent) comes in at the lowest strength level currently and continues to be in Extreme-Bearish territory (below 20 percent). The next lowest strength scores were the SOFR 3-Months (29 percent) and the 10-Year Bonds (43 percent).
Strength Statistics:
Fed Funds (48.7 percent) vs Fed Funds previous week (51.3 percent)
2-Year Bond (0.1 percent) vs 2-Year Bond previous week (0.0 percent)
5-Year Bond (56.8 percent) vs 5-Year Bond previous week (64.0 percent)
10-Year Bond (43.0 percent) vs 10-Year Bond previous week (60.0 percent)
Ultra 10-Year Bond (65.0 percent) vs Ultra 10-Year Bond previous week (62.0 percent)
US Treasury Bond (72.4 percent) vs US Treasury Bond previous week (85.7 percent)
Ultra US Treasury Bond (70.6 percent) vs Ultra US Treasury Bond previous week (66.5 percent)
SOFR 1-Month (66.1 percent) vs SOFR 1-Month previous week (54.9 percent)
SOFR 3-Months (28.6 percent) vs SOFR 3-Months previous week (37.2 percent)
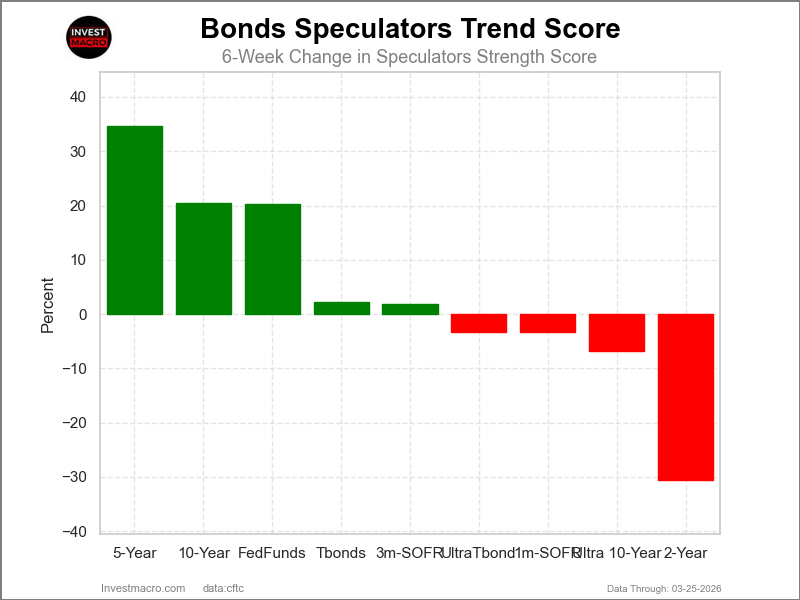
5-Year Bonds & Fed Funds top the 6-Week Strength Trends
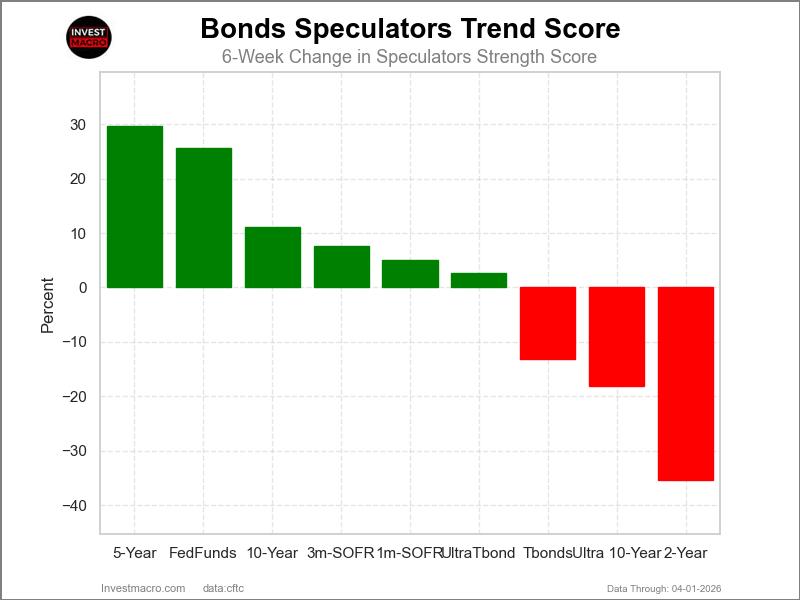
COT Strength Score Trends (or move index, calculates the 6-week changes in strength scores) showed that the 5-Year Bonds (30 percent) and the Fed Funds (26 percent) lead the past six weeks trends for bonds. The 10-Year Bonds (11 percent) are the next highest positive movers in the latest trends data.
The 2-Year Bond (-35 percent) leads the downside trend scores currently with the Ultra 10-Year Bonds (-18 percent) and the US Treasury Bond (-13 percent) following next with lower trend scores.
Strength Trend Statistics:
Fed Funds (25.6 percent) vs Fed Funds previous week (20.2 percent)
2-Year Bond (-35.3 percent) vs 2-Year Bond previous week (-30.5 percent)
5-Year Bond (29.6 percent) vs 5-Year Bond previous week (34.6 percent)
10-Year Bond (11.2 percent) vs 10-Year Bond previous week (20.5 percent)
Ultra 10-Year Bond (-18.1 percent) vs Ultra 10-Year Bond previous week (-6.8 percent)
US Treasury Bond (-13.2 percent) vs US Treasury Bond previous week (2.3 percent)
Ultra US Treasury Bond (2.6 percent) vs Ultra US Treasury Bond previous week (-3.2 percent)
SOFR 1-Month (5.0 percent) vs SOFR 1-Month previous week (-3.3 percent)
SOFR 3-Months (7.6 percent) vs SOFR 3-Months previous week (1.9 percent)
30-Day Federal Funds Futures:
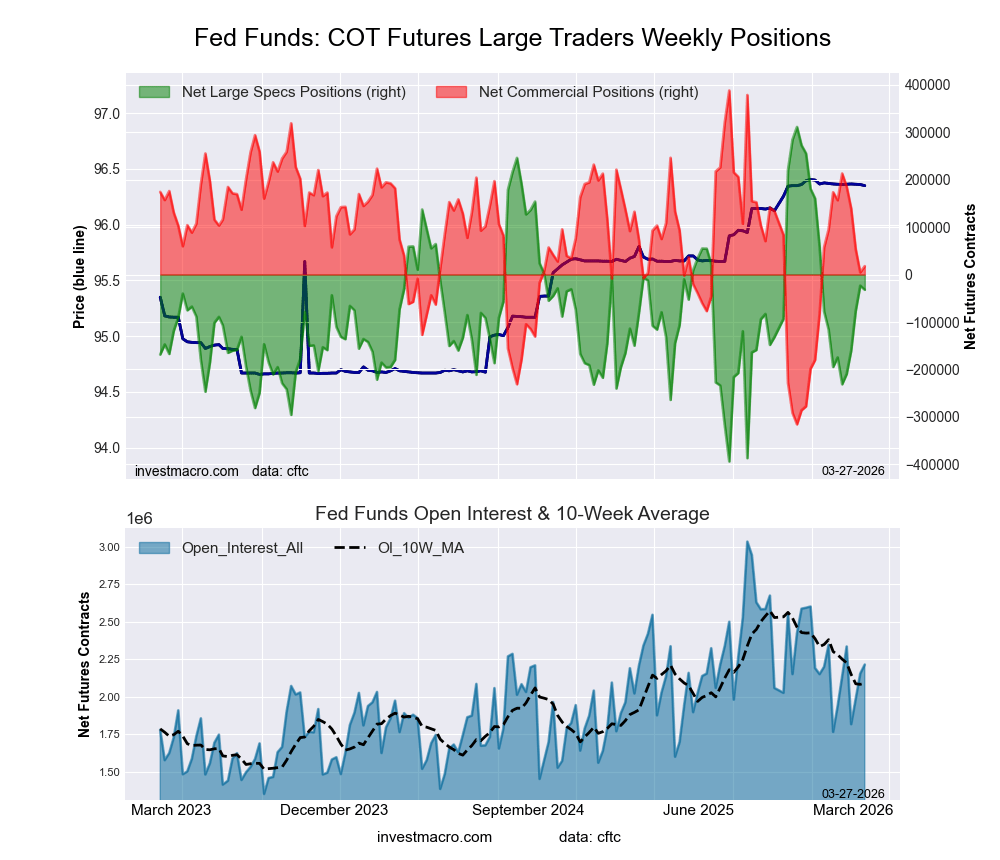
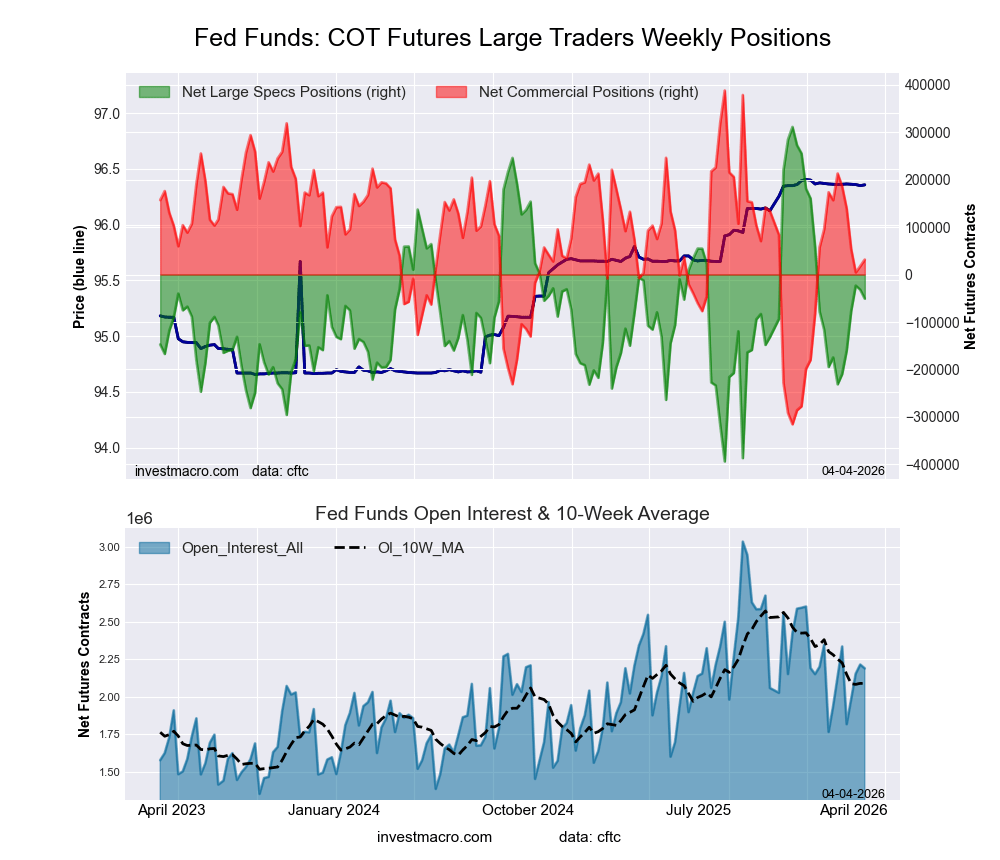 The 30-Day Federal Funds large speculator standing this week equaled a net position of -50,706 contracts in the data reported through Tuesday. This was a weekly fall of -18,664 contracts from the previous week which had a total of -32,042 net contracts.
This week’s current strength score (the trader positioning range over the past three years, measured from 0 to 100) shows the speculators are currently Bearish with a score of 48.7 percent. The commercials are Bearish with a score of 49.4 percent and the small traders (not shown in chart) are Bullish-Extreme with a score of 83.5 percent.
Price Trend-Following Model: Weak Uptrend
Our weekly trend-following model classifies the current market price position as: Weak Uptrend.
| 30-Day Federal Funds Statistics | SPECULATORS | COMMERCIALS | SMALL TRADERS |
| – Percent of Open Interest Longs: | 15.1 | 65.3 | 3.8 |
| – Percent of Open Interest Shorts: | 17.5 | 63.9 | 3.0 |
| – Net Position: | -50,706 | 31,530 | 19,176 |
| – Gross Longs: | 331,480 | 1,430,175 | 83,806 |
| – Gross Shorts: | 382,186 | 1,398,645 | 64,630 |
| – Long to Short Ratio: | 0.9 to 1 | 1.0 to 1 | 1.3 to 1 |
| NET POSITION TREND: | |||
| – Strength Index Score (3 Year Range Pct): | 48.7 | 49.4 | 83.5 |
| – Strength Index Reading (3 Year Range): | Bearish | Bearish | Bullish-Extreme |
| NET POSITION MOVEMENT INDEX: | |||
| – 6-Week Change in Strength Index: | 25.6 | -25.8 | 1.5 |
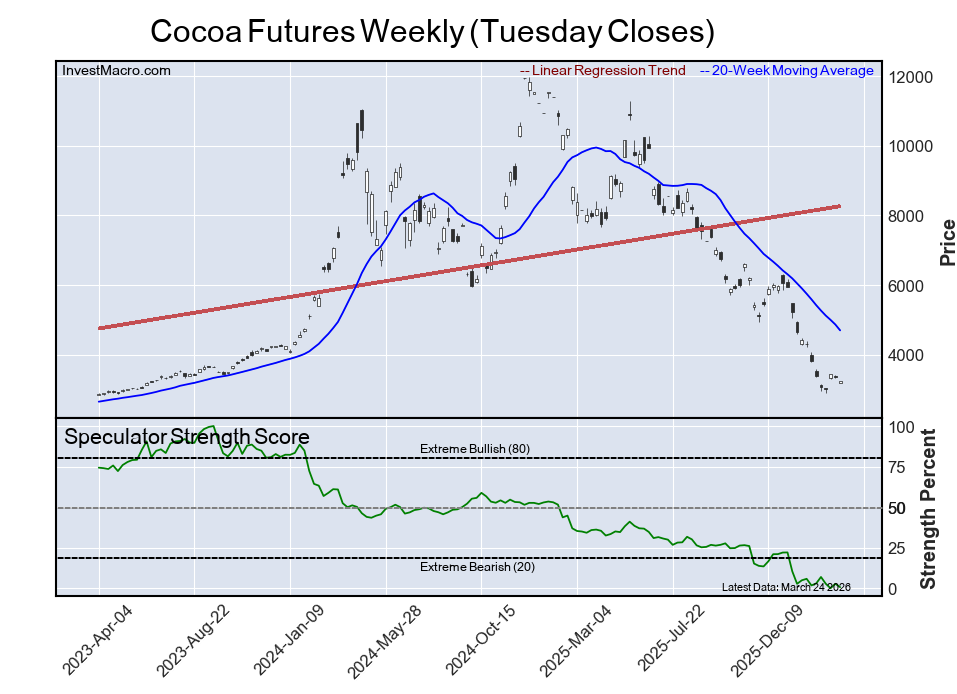
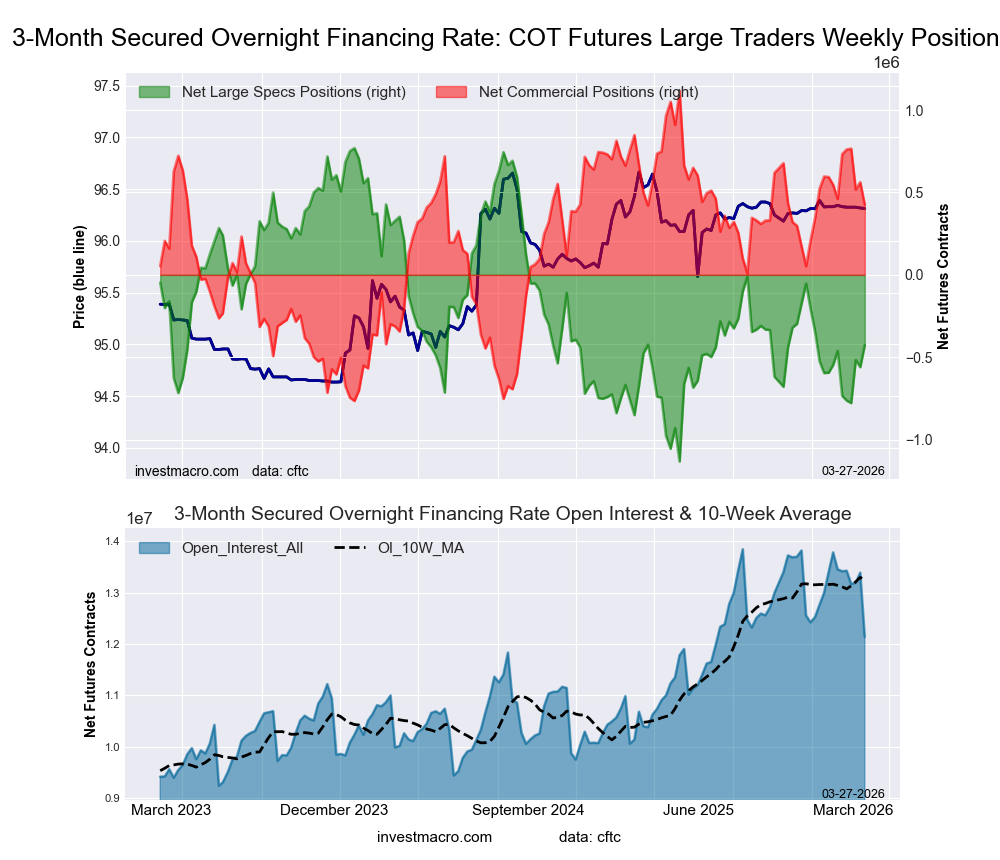
Secured Overnight Financing Rate (3-Month) Futures:
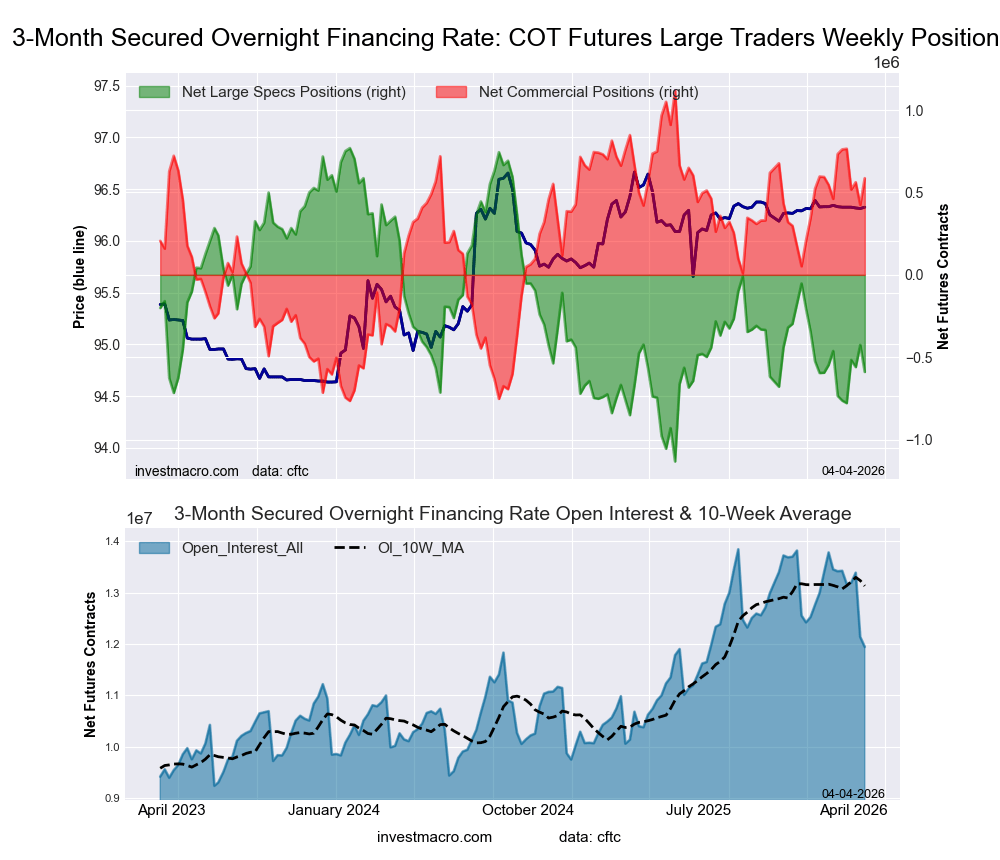 The Secured Overnight Financing Rate (3-Month) large speculator standing this week equaled a net position of -589,139 contracts in the data reported through Tuesday. This was a weekly fall of -163,229 contracts from the previous week which had a total of -425,910 net contracts.
This week’s current strength score (the trader positioning range over the past three years, measured from 0 to 100) shows the speculators are currently Bearish with a score of 28.6 percent. The commercials are Bullish with a score of 71.7 percent and the small traders (not shown in chart) are Bearish with a score of 43.9 percent.
Price Trend-Following Model: Weak Uptrend
Our weekly trend-following model classifies the current market price position as: Weak Uptrend.
| SOFR 3-Months Statistics | SPECULATORS | COMMERCIALS | SMALL TRADERS |
| – Percent of Open Interest Longs: | 16.4 | 58.3 | 0.2 |
| – Percent of Open Interest Shorts: | 21.3 | 53.4 | 0.2 |
| – Net Position: | -589,139 | 586,476 | 2,663 |
| – Gross Longs: | 1,953,604 | 6,958,456 | 26,736 |
| – Gross Shorts: | 2,542,743 | 6,371,980 | 24,073 |
| – Long to Short Ratio: | 0.8 to 1 | 1.1 to 1 | 1.1 to 1 |
| NET POSITION TREND: | |||
| – Strength Index Score (3 Year Range Pct): | 28.6 | 71.7 | 43.9 |
| – Strength Index Reading (3 Year Range): | Bearish | Bullish | Bearish |
| NET POSITION MOVEMENT INDEX: | |||
| – 6-Week Change in Strength Index: | 7.6 | -7.8 | 1.5 |
Individual Bond Markets:
Secured Overnight Financing Rate (1-Month) Futures:
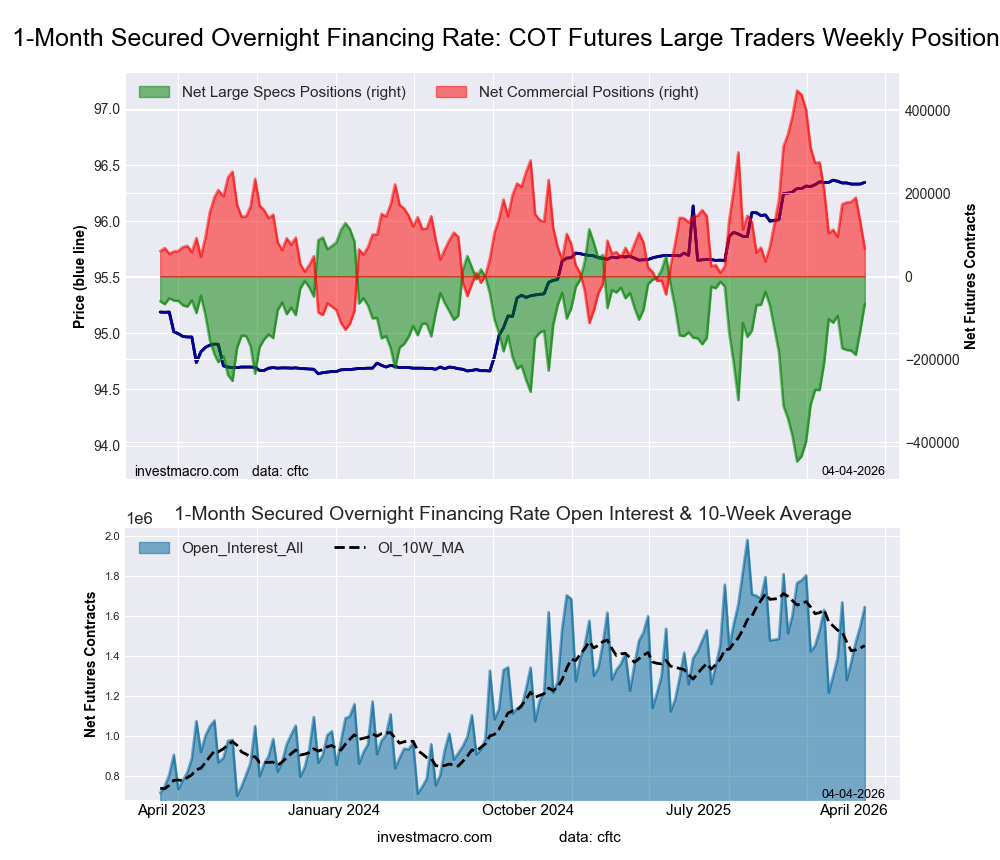 The Secured Overnight Financing Rate (1-Month) large speculator standing this week equaled a net position of -66,508 contracts in the data reported through Tuesday. This was a weekly gain of 64,159 contracts from the previous week which had a total of -130,667 net contracts.
This week’s current strength score (the trader positioning range over the past three years, measured from 0 to 100) shows the speculators are currently Bullish with a score of 66.1 percent. The commercials are Bearish with a score of 33.9 percent and the small traders (not shown in chart) are Bullish with a score of 66.8 percent.
Price Trend-Following Model: Uptrend
Our weekly trend-following model classifies the current market price position as: Uptrend.
| SOFR 1-Month Statistics | SPECULATORS | COMMERCIALS | SMALL TRADERS |
| – Percent of Open Interest Longs: | 23.0 | 58.1 | 1.5 |
| – Percent of Open Interest Shorts: | 27.0 | 54.1 | 1.5 |
| – Net Position: | -66,508 | 66,512 | -4 |
| – Gross Longs: | 378,084 | 955,984 | 25,104 |
| – Gross Shorts: | 444,592 | 889,472 | 25,108 |
| – Long to Short Ratio: | 0.9 to 1 | 1.1 to 1 | 1.0 to 1 |
| NET POSITION TREND: | |||
| – Strength Index Score (3 Year Range Pct): | 66.1 | 33.9 | 66.8 |
| – Strength Index Reading (3 Year Range): | Bullish | Bearish | Bullish |
| NET POSITION MOVEMENT INDEX: | |||
| – 6-Week Change in Strength Index: | 5.0 | -5.0 | 0.0 |
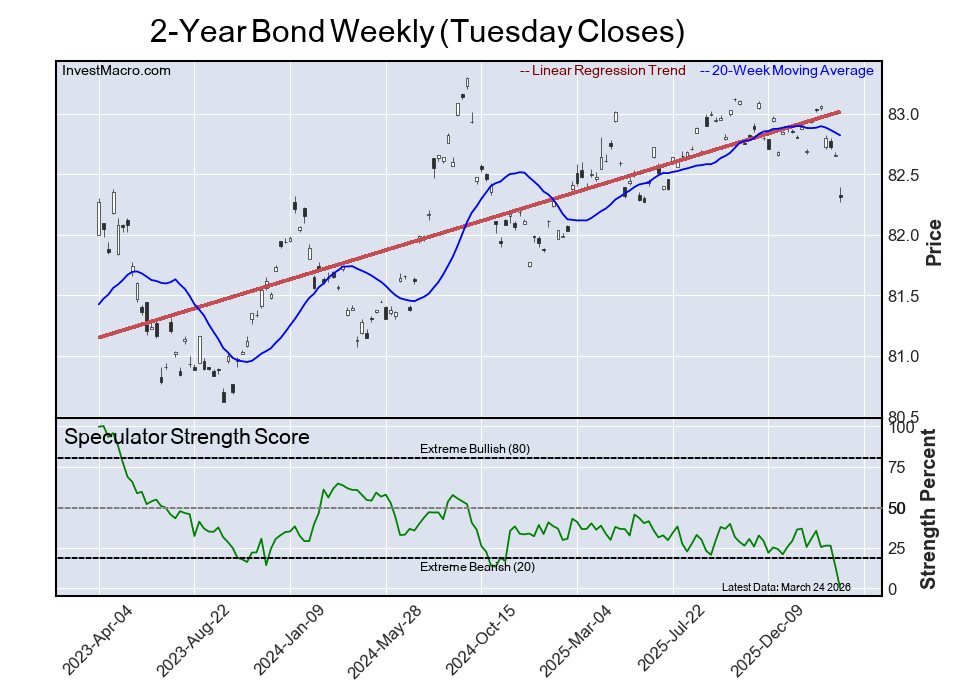
2-Year Treasury Note Futures:
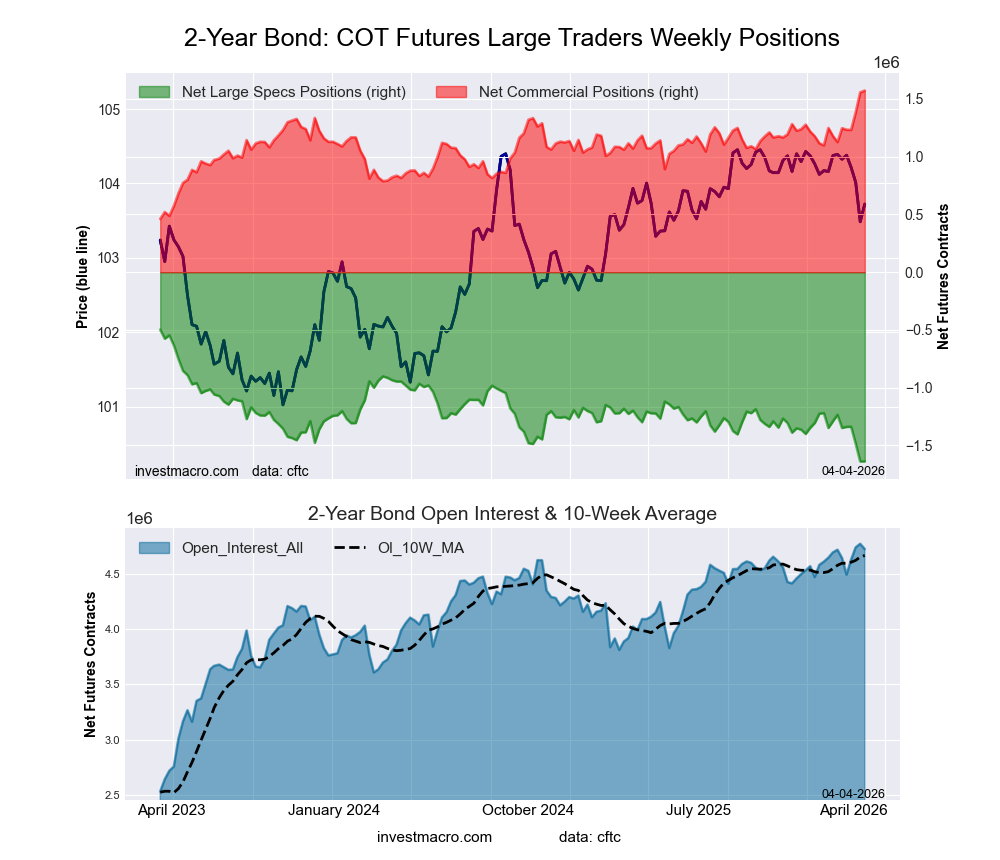 The 2-Year Treasury Note large speculator standing this week equaled a net position of -1,637,324 contracts in the data reported through Tuesday. This was a weekly gain of 855 contracts from the previous week which had a total of -1,638,179 net contracts.
This week’s current strength score (the trader positioning range over the past three years, measured from 0 to 100) shows the speculators are currently Bearish-Extreme with a score of 0.1 percent. The commercials are Bullish-Extreme with a score of 100.0 percent and the small traders (not shown in chart) are Bearish-Extreme with a score of 15.0 percent.
Price Trend-Following Model: Strong Downtrend
Our weekly trend-following model classifies the current market price position as: Strong Downtrend.
| 2-Year Treasury Note Statistics | SPECULATORS | COMMERCIALS | SMALL TRADERS |
| – Percent of Open Interest Longs: | 12.0 | 80.2 | 4.5 |
| – Percent of Open Interest Shorts: | 46.6 | 46.9 | 3.2 |
| – Net Position: | -1,637,324 | 1,572,073 | 65,251 |
| – Gross Longs: | 565,540 | 3,787,152 | 214,812 |
| – Gross Shorts: | 2,202,864 | 2,215,079 | 149,561 |
| – Long to Short Ratio: | 0.3 to 1 | 1.7 to 1 | 1.4 to 1 |
| NET POSITION TREND: | |||
| – Strength Index Score (3 Year Range Pct): | 0.1 | 100.0 | 15.0 |
| – Strength Index Reading (3 Year Range): | Bearish-Extreme | Bullish-Extreme | Bearish-Extreme |
| NET POSITION MOVEMENT INDEX: | |||
| – 6-Week Change in Strength Index: | -35.3 | 40.2 | -22.6 |
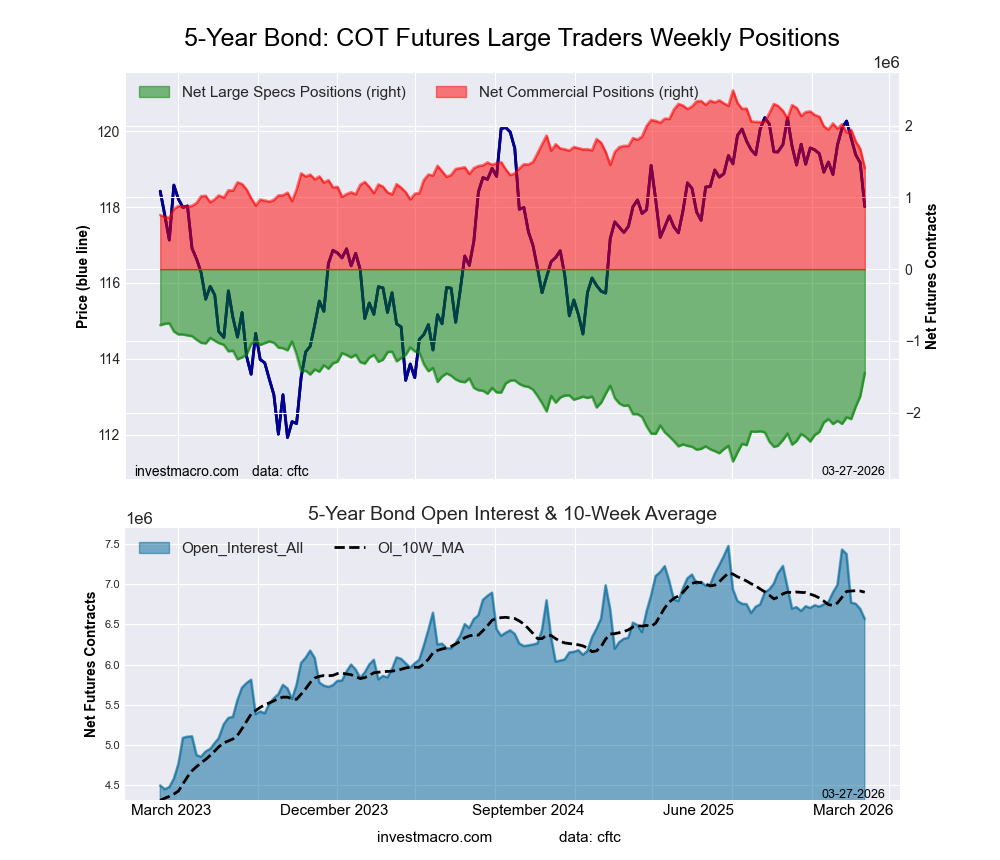
5-Year Treasury Note Futures:
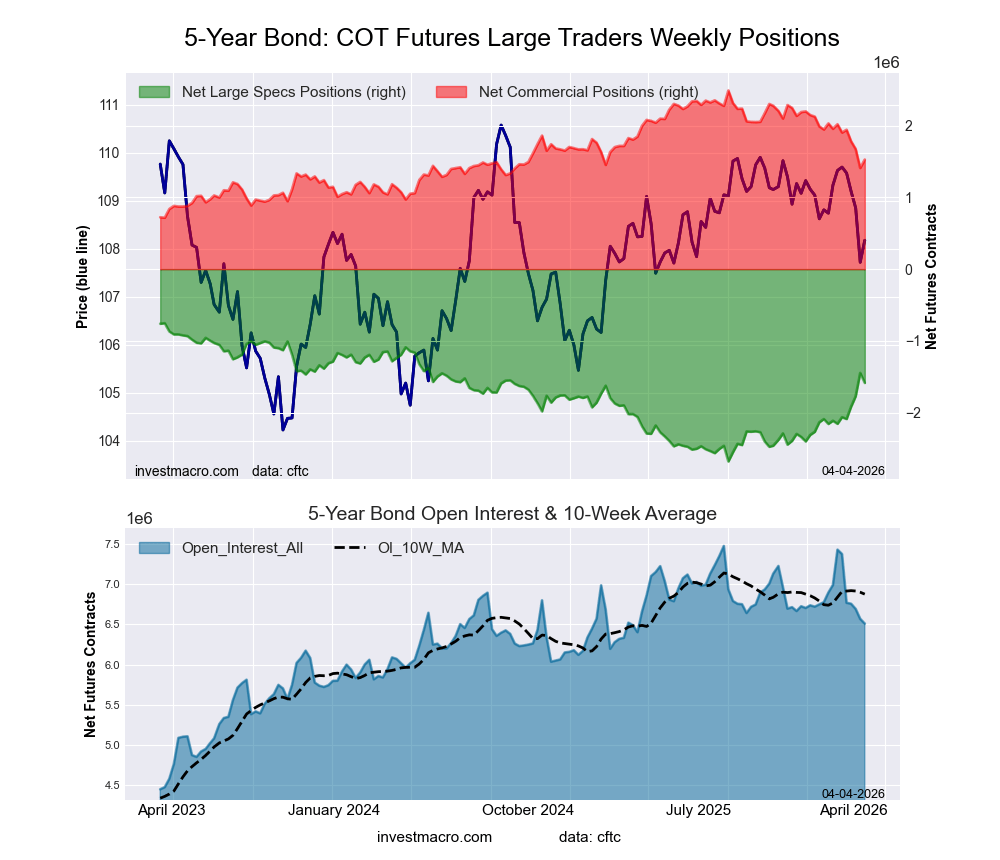 The 5-Year Treasury Note large speculator standing this week equaled a net position of -1,586,840 contracts in the data reported through Tuesday. This was a weekly reduction of -138,404 contracts from the previous week which had a total of -1,448,436 net contracts.
This week’s current strength score (the trader positioning range over the past three years, measured from 0 to 100) shows the speculators are currently Bullish with a score of 56.8 percent. The commercials are Bearish with a score of 45.7 percent and the small traders (not shown in chart) are Bearish with a score of 22.7 percent.
Price Trend-Following Model: Strong Downtrend
Our weekly trend-following model classifies the current market price position as: Strong Downtrend.
| 5-Year Treasury Note Statistics | SPECULATORS | COMMERCIALS | SMALL TRADERS |
| – Percent of Open Interest Longs: | 10.0 | 80.6 | 6.2 |
| – Percent of Open Interest Shorts: | 34.4 | 57.2 | 5.3 |
| – Net Position: | -1,586,840 | 1,527,540 | 59,300 |
| – Gross Longs: | 651,244 | 5,250,315 | 401,332 |
| – Gross Shorts: | 2,238,084 | 3,722,775 | 342,032 |
| – Long to Short Ratio: | 0.3 to 1 | 1.4 to 1 | 1.2 to 1 |
| NET POSITION TREND: | |||
| – Strength Index Score (3 Year Range Pct): | 56.8 | 45.7 | 22.7 |
| – Strength Index Reading (3 Year Range): | Bullish | Bearish | Bearish |
| NET POSITION MOVEMENT INDEX: | |||
| – 6-Week Change in Strength Index: | 29.6 | -27.7 | -31.6 |
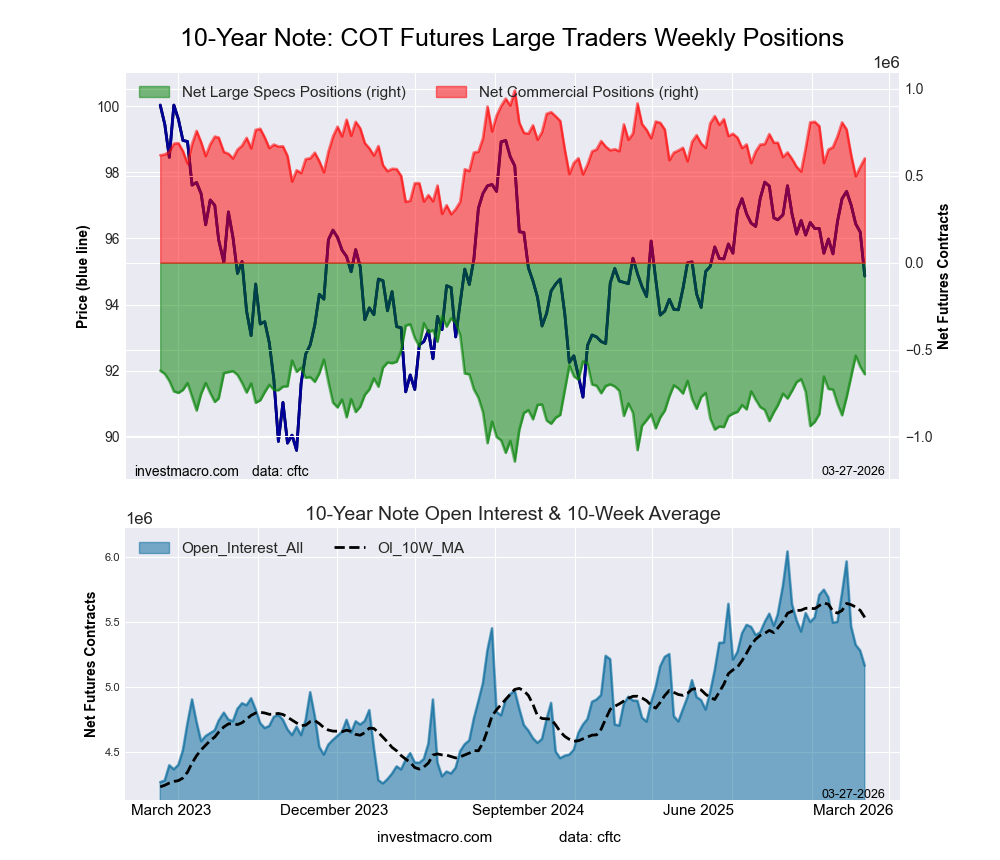
10-Year Treasury Note Futures:
 The 10-Year Treasury Note large speculator standing this week equaled a net position of -784,063 contracts in the data reported through Tuesday. This was a weekly decrease of -142,176 contracts from the previous week which had a total of -641,887 net contracts.
This week’s current strength score (the trader positioning range over the past three years, measured from 0 to 100) shows the speculators are currently Bearish with a score of 43.0 percent. The commercials are Bullish with a score of 65.9 percent and the small traders (not shown in chart) are Bearish with a score of 29.5 percent.
Price Trend-Following Model: Strong Downtrend
Our weekly trend-following model classifies the current market price position as: Strong Downtrend.
| 10-Year Treasury Note Statistics | SPECULATORS | COMMERCIALS | SMALL TRADERS |
| – Percent of Open Interest Longs: | 12.2 | 77.8 | 7.8 |
| – Percent of Open Interest Shorts: | 27.4 | 63.3 | 7.1 |
| – Net Position: | -784,063 | 748,325 | 35,738 |
| – Gross Longs: | 626,486 | 4,009,481 | 403,820 |
| – Gross Shorts: | 1,410,549 | 3,261,156 | 368,082 |
| – Long to Short Ratio: | 0.4 to 1 | 1.2 to 1 | 1.1 to 1 |
| NET POSITION TREND: | |||
| – Strength Index Score (3 Year Range Pct): | 43.0 | 65.9 | 29.5 |
| – Strength Index Reading (3 Year Range): | Bearish | Bullish | Bearish |
| NET POSITION MOVEMENT INDEX: | |||
| – 6-Week Change in Strength Index: | 11.2 | -8.2 | -17.2 |
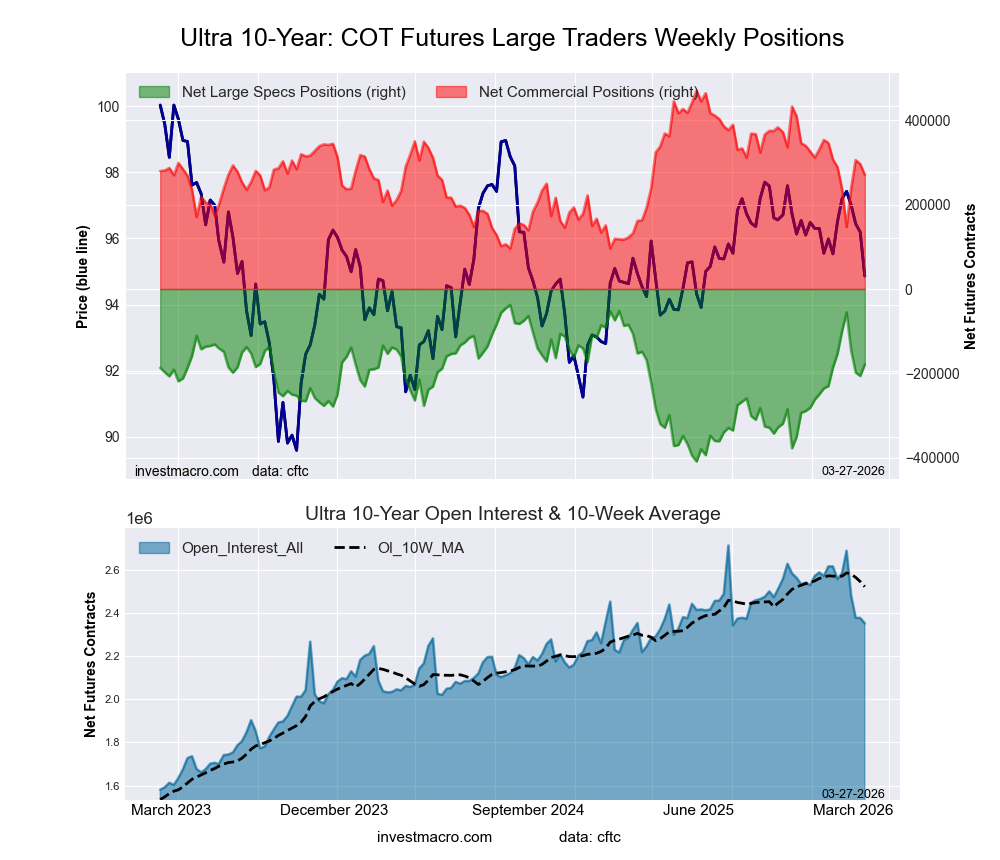
Ultra 10-Year Notes Futures:
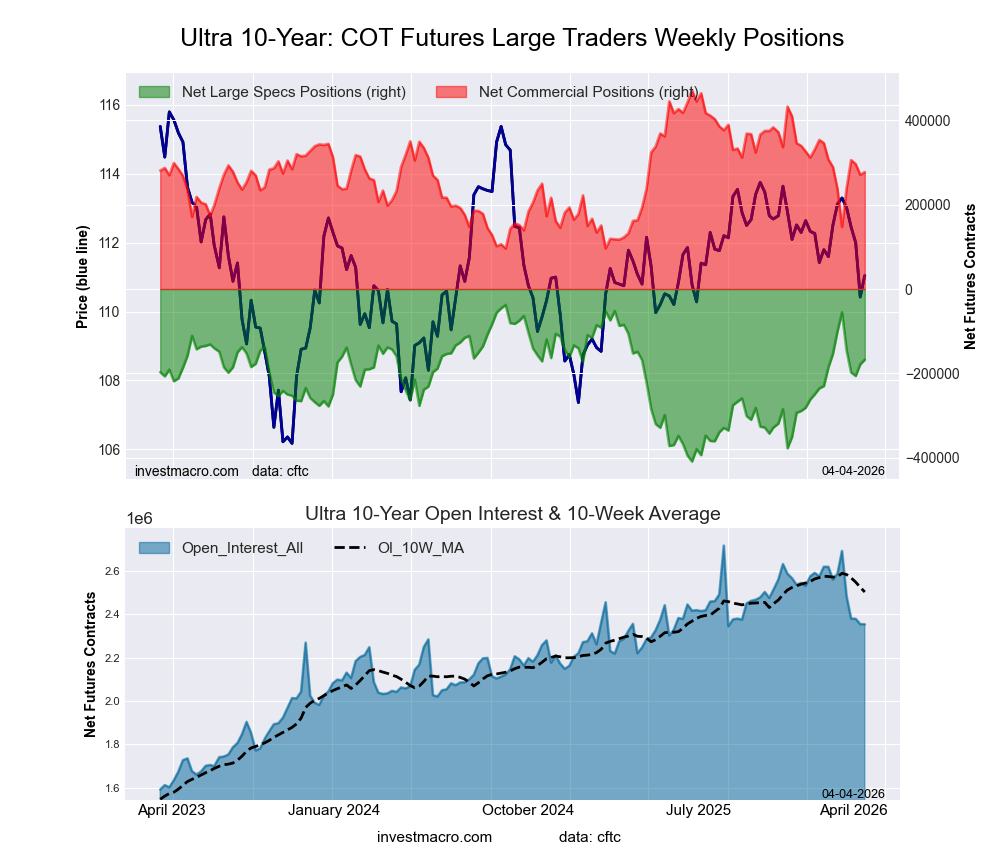 The Ultra 10-Year Notes large speculator standing this week equaled a net position of -167,212 contracts in the data reported through Tuesday. This was a weekly advance of 11,341 contracts from the previous week which had a total of -178,553 net contracts.
This week’s current strength score (the trader positioning range over the past three years, measured from 0 to 100) shows the speculators are currently Bullish with a score of 65.0 percent. The commercials are Bearish with a score of 48.4 percent and the small traders (not shown in chart) are Bearish with a score of 21.1 percent.
Price Trend-Following Model: Strong Downtrend
Our weekly trend-following model classifies the current market price position as: Strong Downtrend.
| Ultra 10-Year Notes Statistics | SPECULATORS | COMMERCIALS | SMALL TRADERS |
| – Percent of Open Interest Longs: | 8.6 | 82.1 | 8.5 |
| – Percent of Open Interest Shorts: | 15.7 | 70.3 | 13.1 |
| – Net Position: | -167,212 | 276,819 | -109,607 |
| – Gross Longs: | 203,324 | 1,931,851 | 199,734 |
| – Gross Shorts: | 370,536 | 1,655,032 | 309,341 |
| – Long to Short Ratio: | 0.5 to 1 | 1.2 to 1 | 0.6 to 1 |
| NET POSITION TREND: | |||
| – Strength Index Score (3 Year Range Pct): | 65.0 | 48.4 | 21.1 |
| – Strength Index Reading (3 Year Range): | Bullish | Bearish | Bearish |
| NET POSITION MOVEMENT INDEX: | |||
| – 6-Week Change in Strength Index: | -18.1 | 10.7 | 21.1 |
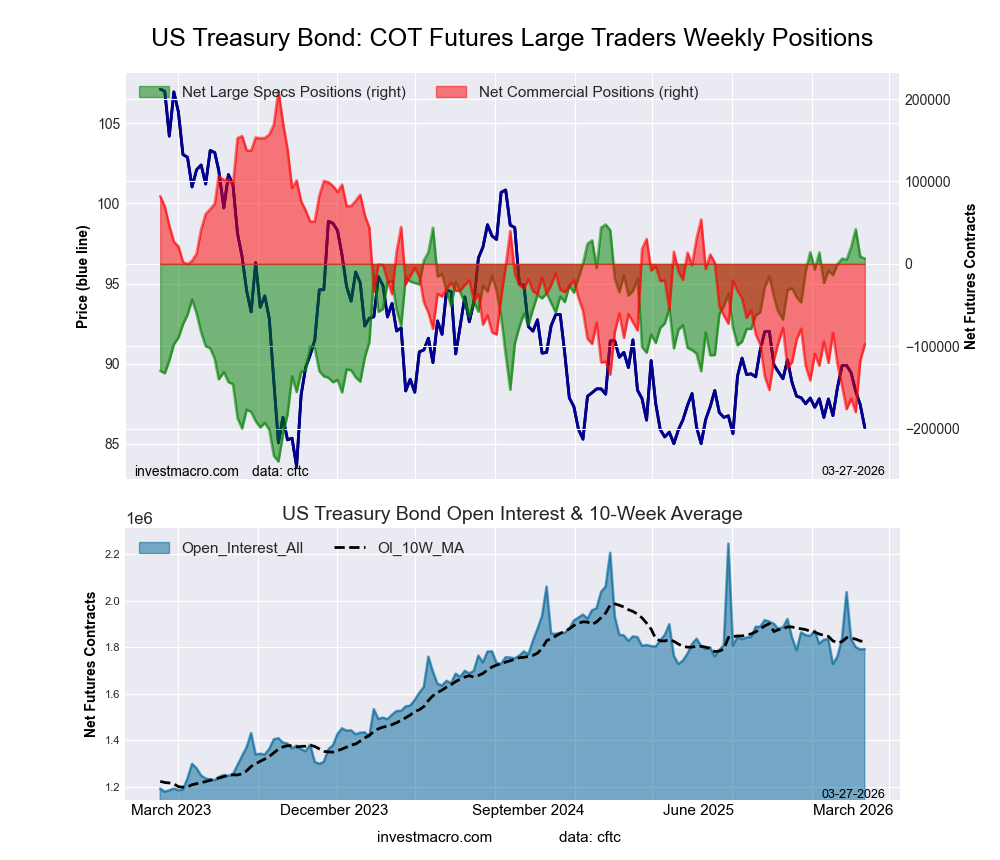
US Treasury Bonds Futures:
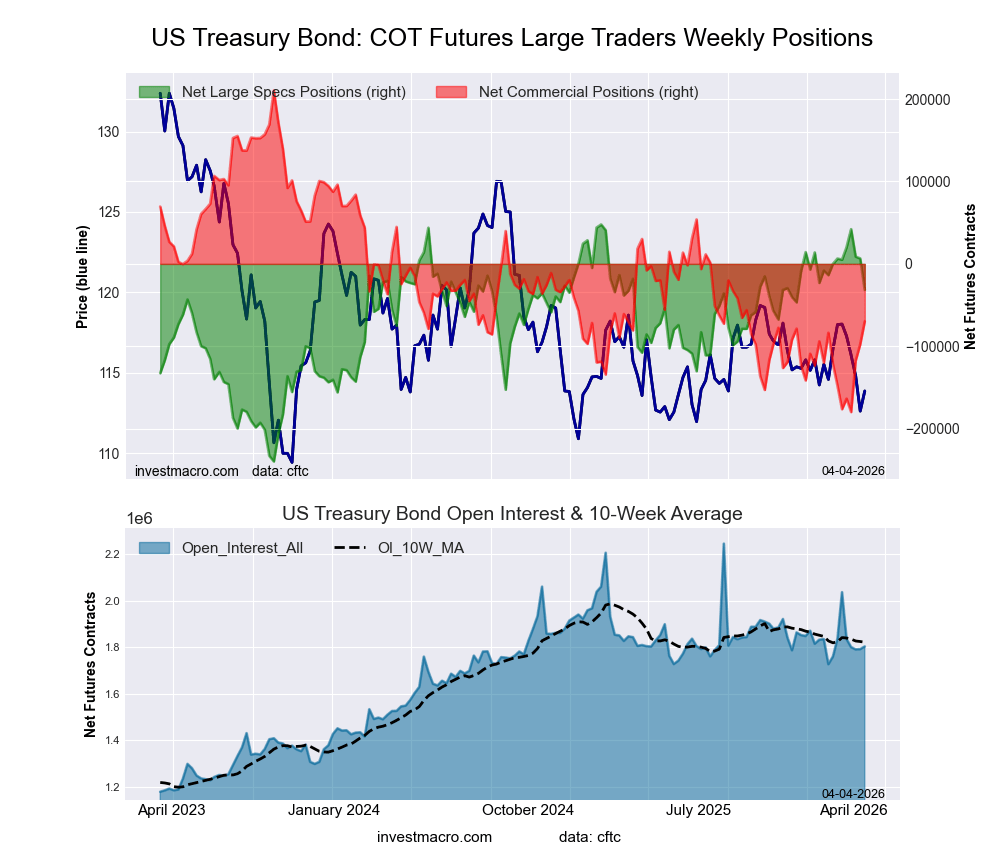 The US Treasury Bonds large speculator standing this week equaled a net position of -31,633 contracts in the data reported through Tuesday. This was a weekly decrease of -38,203 contracts from the previous week which had a total of 6,570 net contracts.
This week’s current strength score (the trader positioning range over the past three years, measured from 0 to 100) shows the speculators are currently Bullish with a score of 72.4 percent. The commercials are Bearish with a score of 28.2 percent and the small traders (not shown in chart) are Bullish with a score of 51.3 percent.
Price Trend-Following Model: Strong Downtrend
Our weekly trend-following model classifies the current market price position as: Strong Downtrend.
| US Treasury Bonds Statistics | SPECULATORS | COMMERCIALS | SMALL TRADERS |
| – Percent of Open Interest Longs: | 11.9 | 73.3 | 13.4 |
| – Percent of Open Interest Shorts: | 13.6 | 77.2 | 7.8 |
| – Net Position: | -31,633 | -69,728 | 101,361 |
| – Gross Longs: | 214,537 | 1,323,153 | 241,653 |
| – Gross Shorts: | 246,170 | 1,392,881 | 140,292 |
| – Long to Short Ratio: | 0.9 to 1 | 0.9 to 1 | 1.7 to 1 |
| NET POSITION TREND: | |||
| – Strength Index Score (3 Year Range Pct): | 72.4 | 28.2 | 51.3 |
| – Strength Index Reading (3 Year Range): | Bullish | Bearish | Bullish |
| NET POSITION MOVEMENT INDEX: | |||
| – 6-Week Change in Strength Index: | -13.2 | 20.0 | -27.9 |
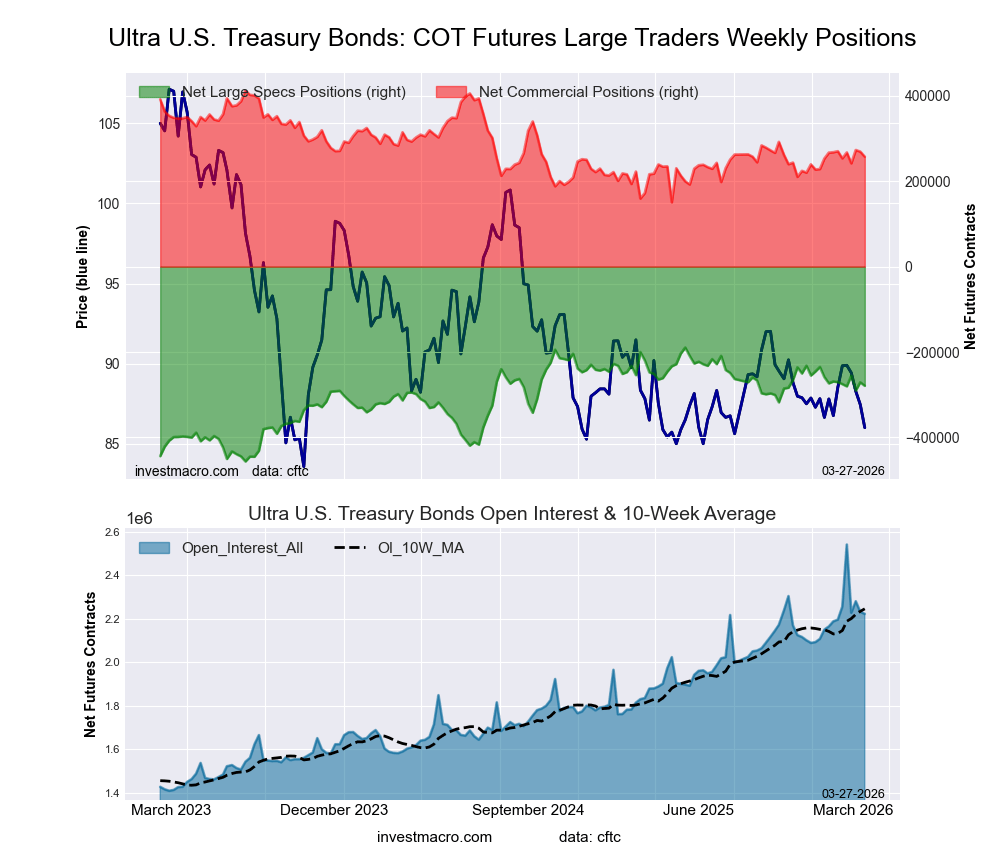
Ultra US Treasury Bonds Futures:
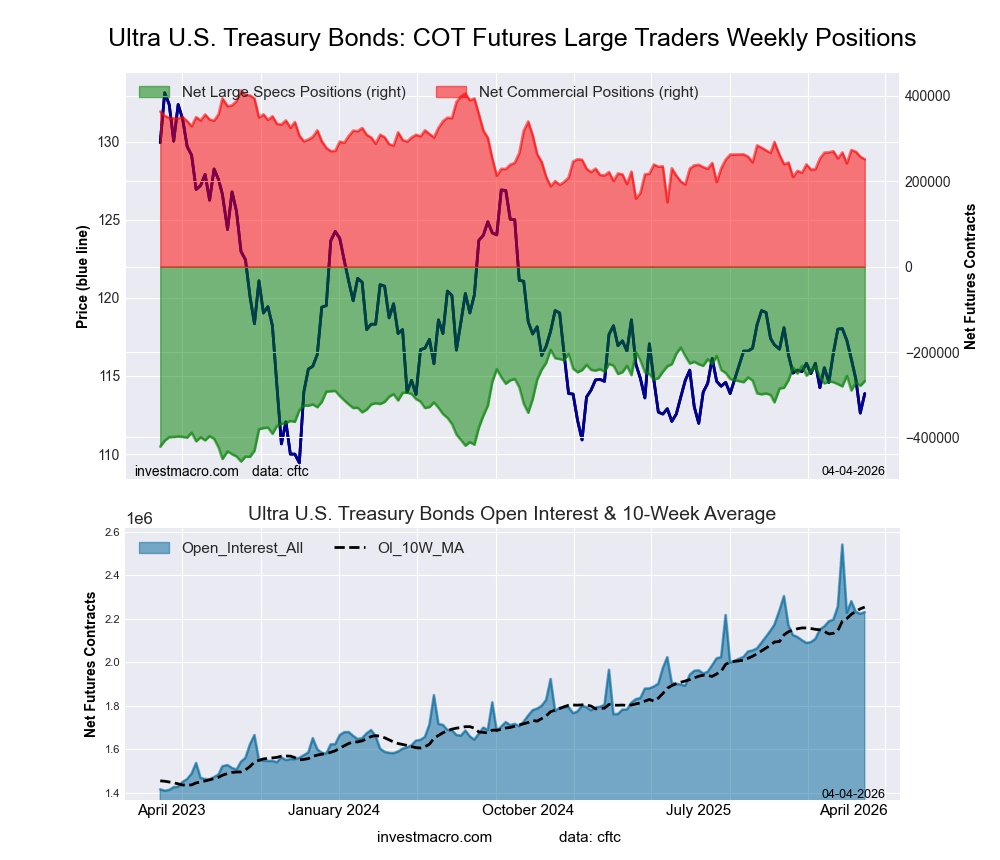 The Ultra US Treasury Bonds large speculator standing this week equaled a net position of -268,129 contracts in the data reported through Tuesday. This was a weekly increase of 11,058 contracts from the previous week which had a total of -279,187 net contracts.
This week’s current strength score (the trader positioning range over the past three years, measured from 0 to 100) shows the speculators are currently Bullish with a score of 70.6 percent. The commercials are Bearish with a score of 38.5 percent and the small traders (not shown in chart) are Bearish with a score of 32.0 percent.
Price Trend-Following Model: Strong Downtrend
Our weekly trend-following model classifies the current market price position as: Strong Downtrend.
| Ultra US Treasury Bonds Statistics | SPECULATORS | COMMERCIALS | SMALL TRADERS |
| – Percent of Open Interest Longs: | 5.7 | 85.1 | 8.7 |
| – Percent of Open Interest Shorts: | 17.7 | 73.8 | 8.0 |
| – Net Position: | -268,129 | 251,701 | 16,428 |
| – Gross Longs: | 126,528 | 1,897,318 | 194,931 |
| – Gross Shorts: | 394,657 | 1,645,617 | 178,503 |
| – Long to Short Ratio: | 0.3 to 1 | 1.2 to 1 | 1.1 to 1 |
| NET POSITION TREND: | |||
| – Strength Index Score (3 Year Range Pct): | 70.6 | 38.5 | 32.0 |
| – Strength Index Reading (3 Year Range): | Bullish | Bearish | Bearish |
| NET POSITION MOVEMENT INDEX: | |||
| – 6-Week Change in Strength Index: | 2.6 | -0.7 | -5.3 |
Article By InvestMacro – Receive our weekly COT Reports by Email
*COT Report: The COT data, released weekly to the public each Friday, is updated through the most recent Tuesday (data is 3 days old) and shows a quick view of how large speculators or non-commercials (for-profit traders) were positioned in the futures markets.
The CFTC categorizes trader positions according to commercial hedgers (traders who use futures contracts for hedging as part of the business), non-commercials (large traders who speculate to realize trading profits) and nonreportable traders (usually small traders/speculators) as well as their open interest (contracts open in the market at time of reporting).See CFTC criteria here.
All information and opinions on this website and contained in this article are for general informational purposes only and do not constitute investment advice.