
By InvestMacro
Here are the latest charts and statistics for the Commitment of Traders (COT) data published by the Commodities Futures Trading Commission (CFTC).
The latest COT data is updated through Tuesday March 28th and shows a quick view of how large traders (for-profit speculators and commercial entities) were positioned in the futures markets.
Weekly Speculator Changes led by VIX & Russell-Mini

The COT stock markets speculator bets were lower this week as three out of the seven stock markets we cover had higher positioning while the other five markets had lower speculator contracts.
Free Reports:
 Download Our Metatrader 4 Indicators – Put Our Free MetaTrader 4 Custom Indicators on your charts when you join our Weekly Newsletter
 Get our Weekly Commitment of Traders Reports - See where the biggest traders (Hedge Funds and Commercial Hedgers) are positioned in the futures markets on a weekly basis.
Leading the gains for the stock markets was the VIX (7,472 contracts) with Russell-Mini (2,238 contracts) and MSCI EAFE-Mini (1,388 contracts) also showing positive weeks.
The markets with the declines in speculator bets this week were the S&P500-Mini (-22,176 contracts) with the Nasdaq-Mini (-2,228 contracts), the DowJones-Mini (-1,421 contracts) and Nikkei 225 (-164 contracts) also registering lower bets on the week.
DowJones-Mini bets at lowest level since June
Highlighting the COT stocks data this week is the rise in bearish bets for the DowJones-Mini speculative positions. The large speculator position in the DowJones-Mini futures declined again this week and fell for the third straight week as well as for the fifth time out of the past seven weeks. The DowJones-Mini bets have now been in a continuous bearish position for the past 64 consecutive weeks, dating back to January 4th of 2022.
This week’s net position of -23,569 contracts marks the most bearish level since June of 2022 and the speculator strength scores shows a bearish-extreme strength score level at just 14 percent of its 3-year range. The speculator strength score trend (the past 6-weeks change of strength scores) also shows a strong downtrend of -44 percent which could perhaps be explained by speculators looking to hedge the recent market gains.
The DowJones-Mini stock futures price has continued to be on the uptrend after bottoming in October near the 28,650 level. This week saw the DowJone-Mini futures close above its 50-day moving average and rise by over 3 percent to the 33460 level.
| Mar-28-2023 | OI | OI-Index | Spec-Net | Spec-Index | Com-Net | COM-Index | Smalls-Net | Smalls-Index |
|---|---|---|---|---|---|---|---|---|
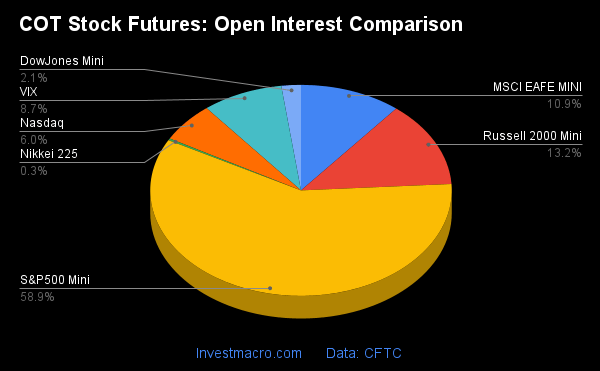
| S&P500-Mini | 2,142,232 | 12 | -224,656 | 15 | 270,978 | 85 | -46,322 | 17 |
| Nikkei 225 | 10,226 | 0 | -1,094 | 71 | 1,344 | 38 | -250 | 25 |
| Nasdaq-Mini | 220,074 | 25 | -7,348 | 71 | 14,846 | 36 | -7,498 | 39 |
| DowJones-Mini | 76,349 | 33 | -23,569 | 14 | 32,570 | 100 | -9,001 | 0 |
| VIX | 315,941 | 50 | -42,177 | 84 | 45,771 | 14 | -3,594 | 74 |
| Nikkei 225 Yen | 33,497 | 7 | 699 | 36 | 9,048 | 36 | -9,747 | 70 |
Strength Scores led by VIX & Nikkei 225

COT Strength Scores (a normalized measure of Speculator positions over a 3-Year range, from 0 to 100 where above 80 is Extreme-Bullish and below 20 is Extreme-Bearish) showed that the VIX (84 percent), Nasdaq-Mini (71 percent) and the Nikkei 225 (71 percent) lead the stock markets this week. The Russell-Mini (46 percent) came in as the next highest in the weekly strength scores.
On the downside, the S&P500-Mini (14.6 percent) and the DowJones-Mini (14 percent) came in at the lowest strength level currently and are in Extreme-Bearish territory (below 20 percent).
Strength Statistics:
VIX (83.9 percent) vs VIX previous week (78.7 percent)
S&P500-Mini (14.6 percent) vs S&P500-Mini previous week (18.7 percent)
DowJones-Mini (13.7 percent) vs DowJones-Mini previous week (17.4 percent)
Nasdaq-Mini (70.9 percent) vs Nasdaq-Mini previous week (72.2 percent)
Russell2000-Mini (46.3 percent) vs Russell2000-Mini previous week (45.0 percent)
Nikkei USD (70.9 percent) vs Nikkei USD previous week (71.8 percent)
EAFE-Mini (28.8 percent) vs EAFE-Mini previous week (27.1 percent)
Russell-Mini & VIX top the 6-Week Strength Trends
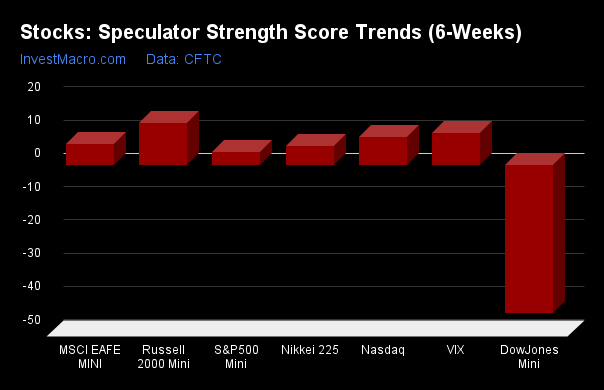
COT Strength Score Trends (or move index, calculates the 6-week changes in strength scores) showed that the Russell-Mini (13 percent) leads the past six weeks trends for the stock markets. The VIX (10 percent), the Nasdaq-Mini (9 percent) and the MSCI EAFE-Mini (7 percent) are the next highest positive movers in the latest trends data.
The DowJones-Mini (-44 percent) leads the downside trend scores currently.
Strength Trend Statistics:
VIX (9.7 percent) vs VIX previous week (10.5 percent)
S&P500-Mini (4.0 percent) vs S&P500-Mini previous week (2.8 percent)
DowJones-Mini (-44.3 percent) vs DowJones-Mini previous week (-41.8 percent)
Nasdaq-Mini (8.6 percent) vs Nasdaq-Mini previous week (5.5 percent)
Russell2000-Mini (12.7 percent) vs Russell2000-Mini previous week (18.1 percent)
Nikkei USD (5.9 percent) vs Nikkei USD previous week (10.9 percent)
EAFE-Mini (6.6 percent) vs EAFE-Mini previous week (14.4 percent)
Individual Stock Market Charts:
VIX Volatility Futures:
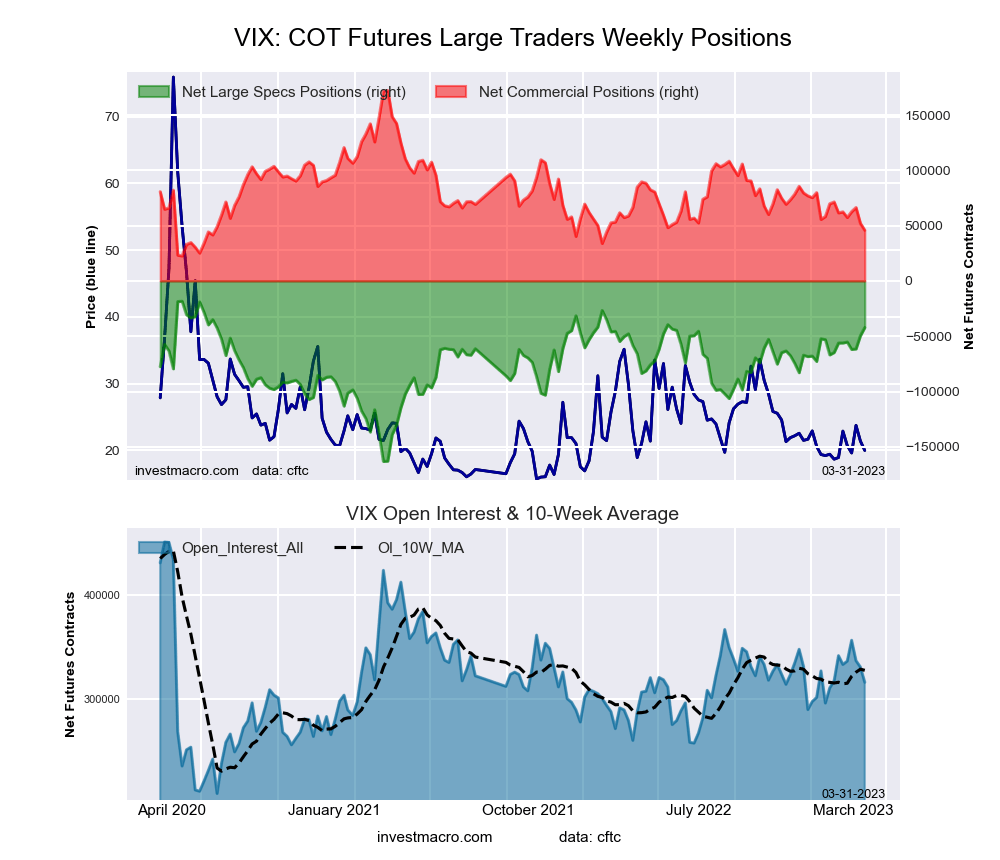 The VIX Volatility large speculator standing this week reached a net position of -42,177 contracts in the data reported through Tuesday. This was a weekly lift of 7,472 contracts from the previous week which had a total of -49,649 net contracts.
This week’s current strength score (the trader positioning range over the past three years, measured from 0 to 100) shows the speculators are currently Bullish-Extreme with a score of 83.9 percent. The commercials are Bearish-Extreme with a score of 14.0 percent and the small traders (not shown in chart) are Bullish with a score of 73.9 percent.
| VIX Volatility Futures Statistics | SPECULATORS | COMMERCIALS | SMALL TRADERS |
| – Percent of Open Interest Longs: | 19.9 | 51.9 | 8.6 |
| – Percent of Open Interest Shorts: | 33.3 | 37.4 | 9.8 |
| – Net Position: | -42,177 | 45,771 | -3,594 |
| – Gross Longs: | 62,963 | 163,837 | 27,312 |
| – Gross Shorts: | 105,140 | 118,066 | 30,906 |
| – Long to Short Ratio: | 0.6 to 1 | 1.4 to 1 | 0.9 to 1 |
| NET POSITION TREND: | |||
| – Strength Index Score (3 Year Range Pct): | 83.9 | 14.0 | 73.9 |
| – Strength Index Reading (3 Year Range): | Bullish-Extreme | Bearish-Extreme | Bullish |
| NET POSITION MOVEMENT INDEX: | |||
| – 6-Week Change in Strength Index: | 9.7 | -10.7 | 8.3 |
S&P500 Mini Futures:
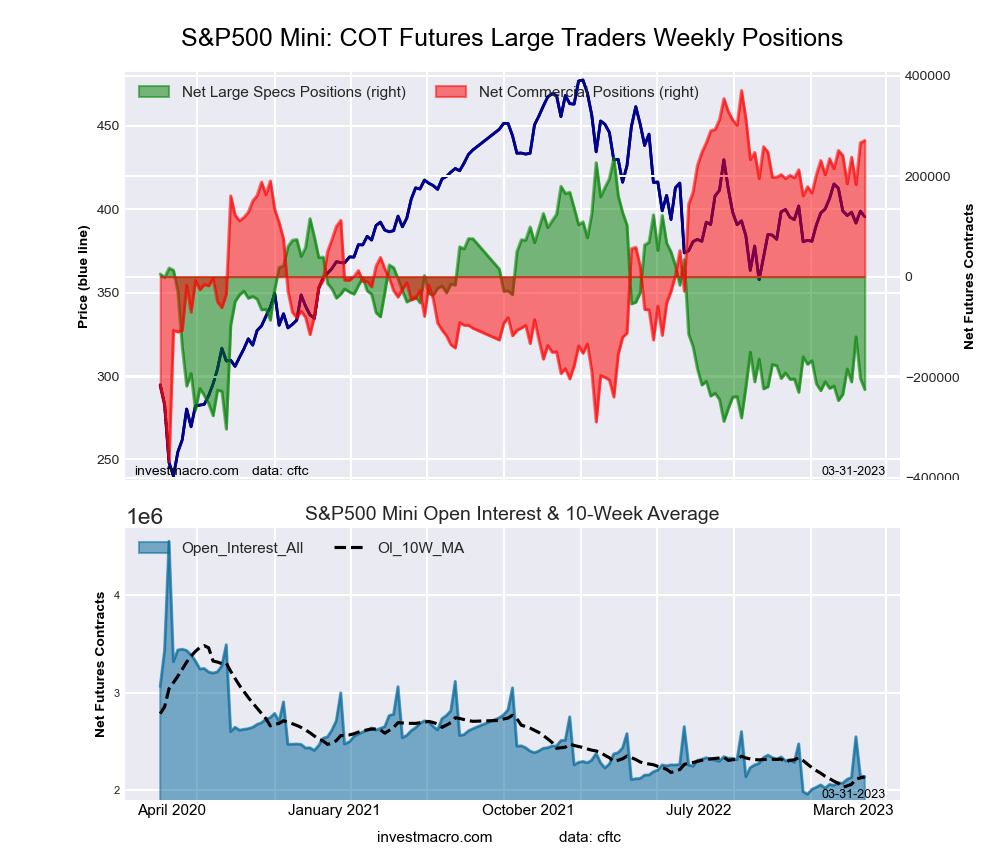 The S&P500 Mini large speculator standing this week reached a net position of -224,656 contracts in the data reported through Tuesday. This was a weekly lowering of -22,176 contracts from the previous week which had a total of -202,480 net contracts.
This week’s current strength score (the trader positioning range over the past three years, measured from 0 to 100) shows the speculators are currently Bearish-Extreme with a score of 14.6 percent. The commercials are Bullish-Extreme with a score of 84.9 percent and the small traders (not shown in chart) are Bearish-Extreme with a score of 17.1 percent.
| S&P500 Mini Futures Statistics | SPECULATORS | COMMERCIALS | SMALL TRADERS |
| – Percent of Open Interest Longs: | 9.3 | 78.1 | 9.7 |
| – Percent of Open Interest Shorts: | 19.8 | 65.5 | 11.9 |
| – Net Position: | -224,656 | 270,978 | -46,322 |
| – Gross Longs: | 199,472 | 1,673,807 | 208,519 |
| – Gross Shorts: | 424,128 | 1,402,829 | 254,841 |
| – Long to Short Ratio: | 0.5 to 1 | 1.2 to 1 | 0.8 to 1 |
| NET POSITION TREND: | |||
| – Strength Index Score (3 Year Range Pct): | 14.6 | 84.9 | 17.1 |
| – Strength Index Reading (3 Year Range): | Bearish-Extreme | Bullish-Extreme | Bearish-Extreme |
| NET POSITION MOVEMENT INDEX: | |||
| – 6-Week Change in Strength Index: | 4.0 | 3.0 | -9.0 |
Dow Jones Mini Futures:
 The Dow Jones Mini large speculator standing this week reached a net position of -23,569 contracts in the data reported through Tuesday. This was a weekly lowering of -1,421 contracts from the previous week which had a total of -22,148 net contracts.
This week’s current strength score (the trader positioning range over the past three years, measured from 0 to 100) shows the speculators are currently Bearish-Extreme with a score of 13.7 percent. The commercials are Bullish-Extreme with a score of 100.0 percent and the small traders (not shown in chart) are Bearish-Extreme with a score of 0.0 percent.
| Dow Jones Mini Futures Statistics | SPECULATORS | COMMERCIALS | SMALL TRADERS |
| – Percent of Open Interest Longs: | 16.0 | 70.1 | 12.9 |
| – Percent of Open Interest Shorts: | 46.8 | 27.4 | 24.7 |
| – Net Position: | -23,569 | 32,570 | -9,001 |
| – Gross Longs: | 12,190 | 53,504 | 9,852 |
| – Gross Shorts: | 35,759 | 20,934 | 18,853 |
| – Long to Short Ratio: | 0.3 to 1 | 2.6 to 1 | 0.5 to 1 |
| NET POSITION TREND: | |||
| – Strength Index Score (3 Year Range Pct): | 13.7 | 100.0 | 0.0 |
| – Strength Index Reading (3 Year Range): | Bearish-Extreme | Bullish-Extreme | Bearish-Extreme |
| NET POSITION MOVEMENT INDEX: | |||
| – 6-Week Change in Strength Index: | -44.3 | 45.6 | -27.4 |
Nasdaq Mini Futures:
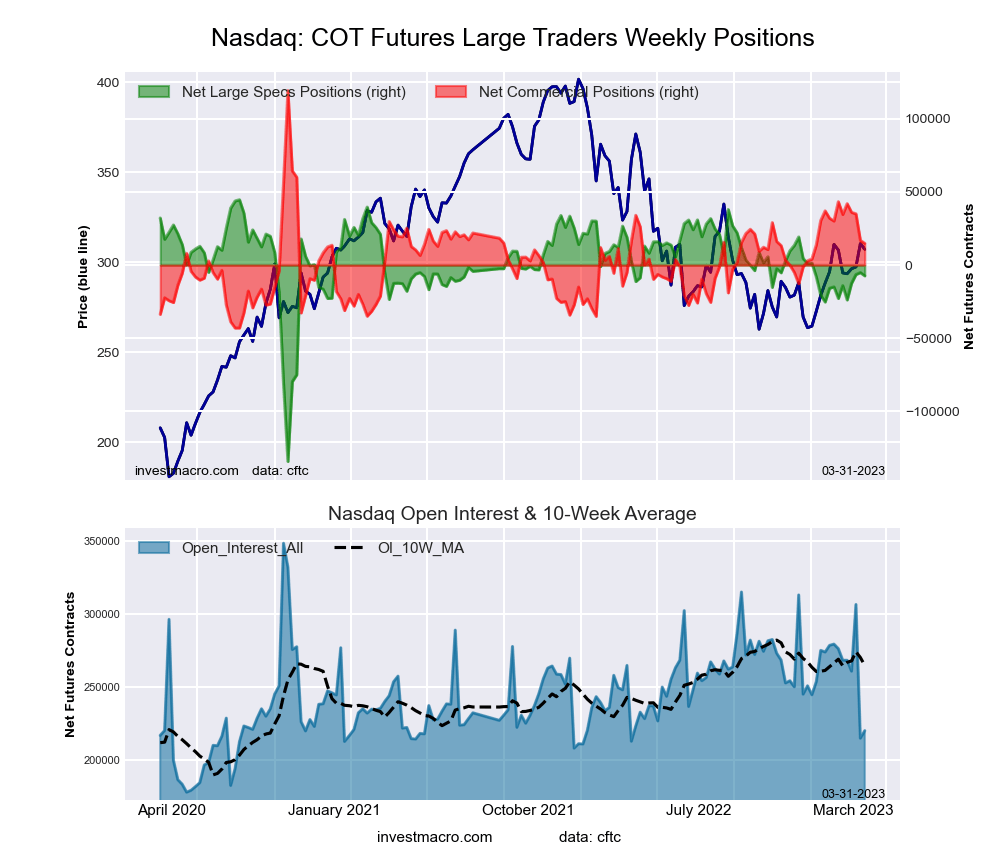 The Nasdaq Mini large speculator standing this week reached a net position of -7,348 contracts in the data reported through Tuesday. This was a weekly lowering of -2,228 contracts from the previous week which had a total of -5,120 net contracts.
This week’s current strength score (the trader positioning range over the past three years, measured from 0 to 100) shows the speculators are currently Bullish with a score of 70.9 percent. The commercials are Bearish with a score of 35.6 percent and the small traders (not shown in chart) are Bearish with a score of 39.4 percent.
| Nasdaq Mini Futures Statistics | SPECULATORS | COMMERCIALS | SMALL TRADERS |
| – Percent of Open Interest Longs: | 23.3 | 60.1 | 15.3 |
| – Percent of Open Interest Shorts: | 26.7 | 53.4 | 18.7 |
| – Net Position: | -7,348 | 14,846 | -7,498 |
| – Gross Longs: | 51,309 | 132,371 | 33,614 |
| – Gross Shorts: | 58,657 | 117,525 | 41,112 |
| – Long to Short Ratio: | 0.9 to 1 | 1.1 to 1 | 0.8 to 1 |
| NET POSITION TREND: | |||
| – Strength Index Score (3 Year Range Pct): | 70.9 | 35.6 | 39.4 |
| – Strength Index Reading (3 Year Range): | Bullish | Bearish | Bearish |
| NET POSITION MOVEMENT INDEX: | |||
| – 6-Week Change in Strength Index: | 8.6 | -17.5 | 24.3 |
Russell 2000 Mini Futures:
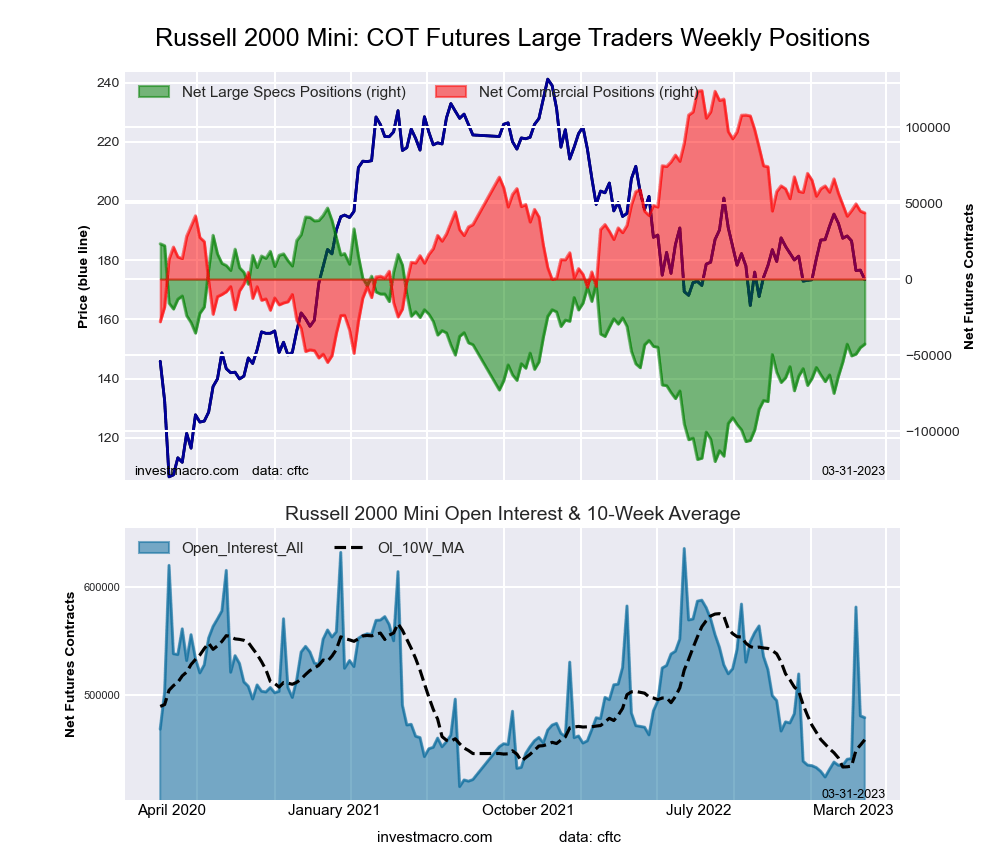 The Russell 2000 Mini large speculator standing this week reached a net position of -42,750 contracts in the data reported through Tuesday. This was a weekly rise of 2,238 contracts from the previous week which had a total of -44,988 net contracts.
This week’s current strength score (the trader positioning range over the past three years, measured from 0 to 100) shows the speculators are currently Bearish with a score of 46.3 percent. The commercials are Bullish with a score of 55.0 percent and the small traders (not shown in chart) are Bearish with a score of 24.3 percent.
| Russell 2000 Mini Futures Statistics | SPECULATORS | COMMERCIALS | SMALL TRADERS |
| – Percent of Open Interest Longs: | 8.8 | 85.2 | 5.0 |
| – Percent of Open Interest Shorts: | 17.7 | 76.1 | 5.1 |
| – Net Position: | -42,750 | 43,502 | -752 |
| – Gross Longs: | 42,013 | 407,849 | 23,878 |
| – Gross Shorts: | 84,763 | 364,347 | 24,630 |
| – Long to Short Ratio: | 0.5 to 1 | 1.1 to 1 | 1.0 to 1 |
| NET POSITION TREND: | |||
| – Strength Index Score (3 Year Range Pct): | 46.3 | 55.0 | 24.3 |
| – Strength Index Reading (3 Year Range): | Bearish | Bullish | Bearish |
| NET POSITION MOVEMENT INDEX: | |||
| – 6-Week Change in Strength Index: | 12.7 | -7.3 | -25.1 |
Nikkei Stock Average (USD) Futures:
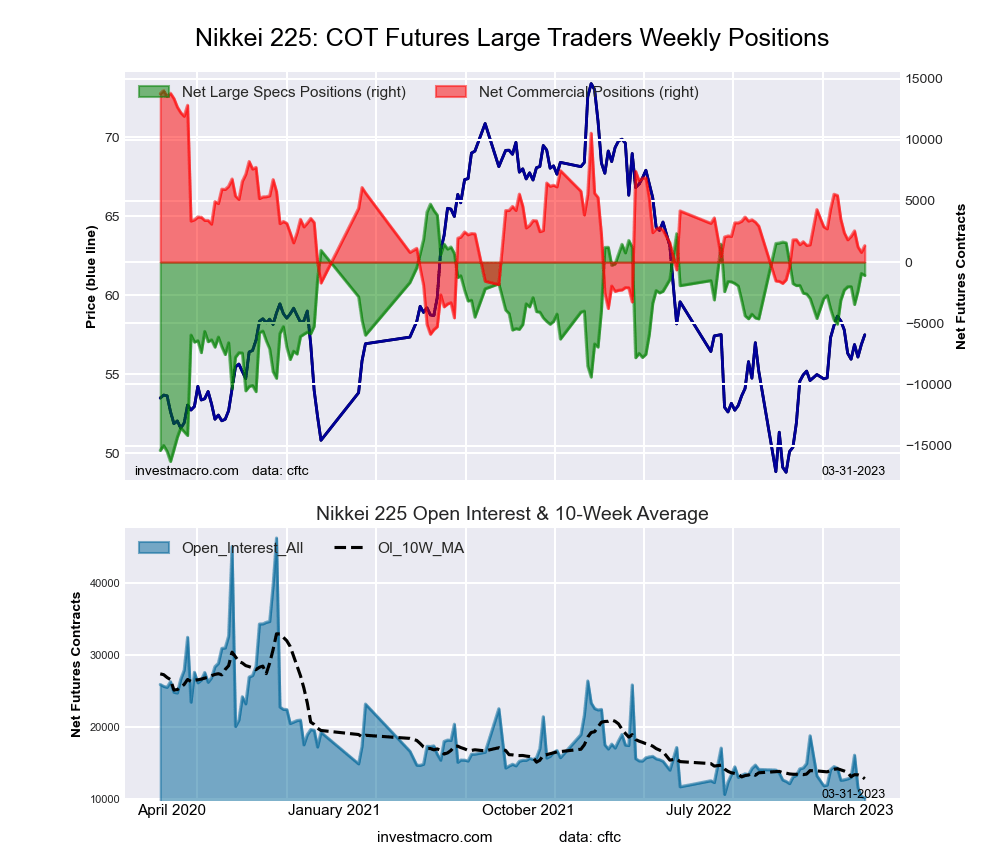 The Nikkei Stock Average (USD) large speculator standing this week reached a net position of -1,094 contracts in the data reported through Tuesday. This was a weekly lowering of -164 contracts from the previous week which had a total of -930 net contracts.
This week’s current strength score (the trader positioning range over the past three years, measured from 0 to 100) shows the speculators are currently Bullish with a score of 70.9 percent. The commercials are Bearish with a score of 37.6 percent and the small traders (not shown in chart) are Bearish with a score of 25.2 percent.
| Nikkei Stock Average Futures Statistics | SPECULATORS | COMMERCIALS | SMALL TRADERS |
| – Percent of Open Interest Longs: | 19.5 | 53.9 | 26.7 |
| – Percent of Open Interest Shorts: | 30.2 | 40.7 | 29.1 |
| – Net Position: | -1,094 | 1,344 | -250 |
| – Gross Longs: | 1,993 | 5,507 | 2,726 |
| – Gross Shorts: | 3,087 | 4,163 | 2,976 |
| – Long to Short Ratio: | 0.6 to 1 | 1.3 to 1 | 0.9 to 1 |
| NET POSITION TREND: | |||
| – Strength Index Score (3 Year Range Pct): | 70.9 | 37.6 | 25.2 |
| – Strength Index Reading (3 Year Range): | Bullish | Bearish | Bearish |
| NET POSITION MOVEMENT INDEX: | |||
| – 6-Week Change in Strength Index: | 5.9 | -5.5 | -1.6 |
MSCI EAFE Mini Futures:
 The MSCI EAFE Mini large speculator standing this week reached a net position of -12,689 contracts in the data reported through Tuesday. This was a weekly rise of 1,388 contracts from the previous week which had a total of -14,077 net contracts.
This week’s current strength score (the trader positioning range over the past three years, measured from 0 to 100) shows the speculators are currently Bearish with a score of 28.8 percent. The commercials are Bullish with a score of 66.9 percent and the small traders (not shown in chart) are Bearish with a score of 47.6 percent.
| MSCI EAFE Mini Futures Statistics | SPECULATORS | COMMERCIALS | SMALL TRADERS |
| – Percent of Open Interest Longs: | 7.5 | 89.7 | 2.3 |
| – Percent of Open Interest Shorts: | 10.7 | 88.1 | 0.7 |
| – Net Position: | -12,689 | 6,551 | 6,138 |
| – Gross Longs: | 29,761 | 355,253 | 9,028 |
| – Gross Shorts: | 42,450 | 348,702 | 2,890 |
| – Long to Short Ratio: | 0.7 to 1 | 1.0 to 1 | 3.1 to 1 |
| NET POSITION TREND: | |||
| – Strength Index Score (3 Year Range Pct): | 28.8 | 66.9 | 47.6 |
| – Strength Index Reading (3 Year Range): | Bearish | Bullish | Bearish |
| NET POSITION MOVEMENT INDEX: | |||
| – 6-Week Change in Strength Index: | 6.6 | -4.3 | -9.2 |
Article By InvestMacro – Receive our weekly COT Newsletter
*COT Report: The COT data, released weekly to the public each Friday, is updated through the most recent Tuesday (data is 3 days old) and shows a quick view of how large speculators or non-commercials (for-profit traders) were positioned in the futures markets.
The CFTC categorizes trader positions according to commercial hedgers (traders who use futures contracts for hedging as part of the business), non-commercials (large traders who speculate to realize trading profits) and nonreportable traders (usually small traders/speculators) as well as their open interest (contracts open in the market at time of reporting). See CFTC criteria here.

- Oil prices reached a 6‑week high. The AUD strengthened on the back of a strong labor‑market report Jul 23, 2026
- EUR/USD Recovers as Dollar Weakens Jul 23, 2026
- Bitcoin rose to $66,000. The New Zealand dollar continues to strengthen Jul 22, 2026
- Inflationary pressure is easing in Canada. In New Zealand, on the contrary, inflation is rising Jul 21, 2026
- GBP/USD Falls After Cabinet Changes Jul 21, 2026
- Geopolitical and macroeconomic conditions continue to pressure market sentiment Jul 20, 2026
- USD/JPY Poised to Continue Gains as Expensive Oil and Lack of Support Weigh on Yen Jul 20, 2026
- COT Metals Charts: Weekly Speculator Bets led by Copper & Steel Jul 18, 2026
- COT Bonds Charts: Weekly Speculator Bets led by 2-Year, SOFR 3M & 5-Year Bonds Jul 18, 2026
- COT Energy Charts: Weekly Speculator Bets led by Brent Oil & Heating Oil Jul 18, 2026