
By InvestMacro
Here are the latest charts and statistics for the Commitment of Traders (COT) reports data published by the Commodities Futures Trading Commission (CFTC).
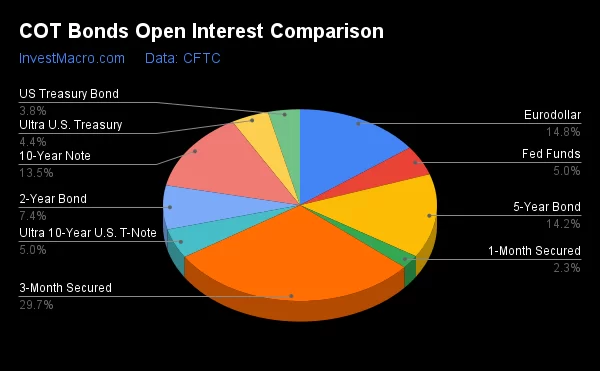
The latest COT data is updated through Tuesday April 4th and shows a quick view of how large traders (for-profit speculators and commercial hedgers) were positioned in the futures markets.
Weekly Speculator Changes led by 2-Year Bonds & Fed Funds
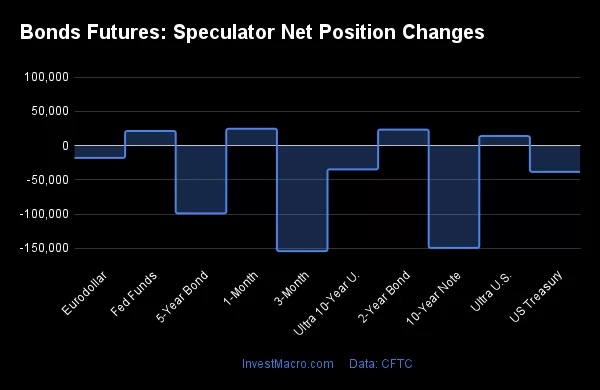
The COT bond market speculator bets were lower this week as three out of the nine bond markets we cover had higher positioning while the other six markets had lower speculator contracts.
Free Reports:
 Sign Up for Our Stock Market Newsletter – Get updated on News, Charts & Rankings of Public Companies when you join our Stocks Newsletter
 Get our Weekly Commitment of Traders Reports - See where the biggest traders (Hedge Funds and Commercial Hedgers) are positioned in the futures markets on a weekly basis.
Leading the gains for the bond markets was the 2-Year Bonds (23,422 contracts) with the Fed Funds (21,360 contracts) and the Ultra Treasury Bonds (14,018 contracts) also showing positive weeks.
The bond markets with declines in speculator bets for the week were the SOFR 3-Months (-154,078 contracts), the 10-Year Bonds (-149,453 contracts), the 5-Year Bonds (-98,884 contracts), the US Treasury Bonds (-38,247 contracts), the Eurodollar (-17,911 contracts) and the Ultra 10-Year Bonds (-34,673 contracts) also registering lower bets on the week.
Speculators boost their 5-Year Bond bearish bets to highest level since 2018
Highlighting the COT bond’s data this week is the renewed bearishness of the speculator positioning in the 5-Year Bonds contracts.
Large speculative positions for the 5-Year Bonds dropped sharply this week by the largest one-week amount of the past 17 weeks. Speculator bets have fallen for three straight weeks and in six out of the past seven weeks.
Prior to the past seven weeks, speculator bets had been improving and saw lessening bearish bets in seven out of the previous nine weeks that had brought the overall bearish level to a total of -589,391 contracts on February 14th. Since then a total of -191,848 contracts have been added back to the overall net bearish position – bringing this week’s total of -781,239 contracts to the most bearish standing since October 16th of 2018, a span dating back 233 weeks. The 5-Year Bond speculator positions have been in a continuous bearish position for the 84 consecutive weeks (since August 31st of 2021).
Despite the speculators bearishness this week, the 5-Year Bond futures price closed the week higher. The front month futures finished the week over the 110.20 level which marks the highest closing price since September and the 5-Year Bond futures have now risen for five out of the past six weeks.
| Apr-04-2023 | OI | OI-Index | Spec-Net | Spec-Index | Com-Net | COM-Index | Smalls-Net | Smalls-Index |
|---|---|---|---|---|---|---|---|---|
| Eurodollar | 4,684,564 | 0 | -647,319 | 57 | 820,938 | 41 | -173,619 | 66 |
| FedFunds | 1,577,225 | 53 | -147,240 | 21 | 156,927 | 79 | -9,687 | 72 |
| 2-Year | 2,351,682 | 52 | -502,055 | 25 | 483,170 | 75 | 18,885 | 65 |
| Long T-Bond | 1,193,583 | 56 | -129,646 | 42 | 82,281 | 40 | 47,365 | 84 |
| 10-Year | 4,263,195 | 83 | -621,031 | 1 | 618,359 | 88 | 2,672 | 84 |
| 5-Year | 4,493,575 | 100 | -781,239 | 0 | 754,970 | 98 | 26,269 | 88 |
Strength Scores led by SOFR 3-Months & Eurodollar
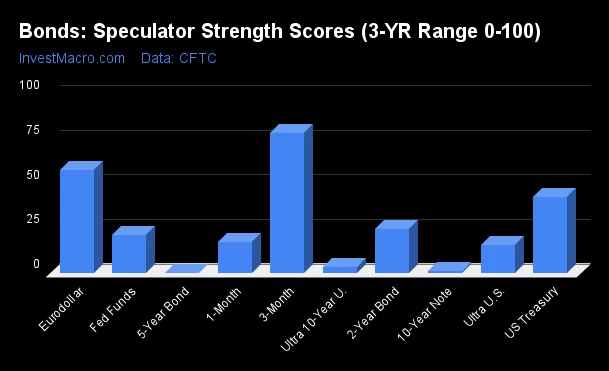
COT Strength Scores (a normalized measure of Speculator positions over a 3-Year range, from 0 to 100 where above 80 is Extreme-Bullish and below 20 is Extreme-Bearish) showed that the SOFR 3-Months (78 percent) and the Eurodollar (57 percent) lead the bond markets this week. The US Treasury Bonds (42 percent) comes in as the next highest in the weekly strength scores.
On the downside, the 5-Year Bonds (0 percent), the 10-Year Bonds (1 percent), the Ultra 10-Year Bonds (3 percent) and the Ultra Treasury Bonds (15 percent) came in at the lowest strength level currently and are in Extreme-Bearish territory (below 20 percent).
Strength Statistics:
Fed Funds (21.4 percent) vs Fed Funds previous week (18.8 percent)
2-Year Bond (24.8 percent) vs 2-Year Bond previous week (21.8 percent)
5-Year Bond (0.0 percent) vs 5-Year Bond previous week (11.3 percent)
10-Year Bond (0.9 percent) vs 10-Year Bond previous week (19.3 percent)
Ultra 10-Year Bond (3.4 percent) vs Ultra 10-Year Bond previous week (10.6 percent)
US Treasury Bond (42.4 percent) vs US Treasury Bond previous week (54.8 percent)
Ultra US Treasury Bond (15.4 percent) vs Ultra US Treasury Bond previous week (9.4 percent)
Eurodollar (57.4 percent) vs Eurodollar previous week (57.9 percent)
SOFR 3-Months (78.2 percent) vs SOFR 3-Months previous week (90.7 percent)
SOFR 3-Months & 2-Year Bonds top the 6-Week Strength Trends
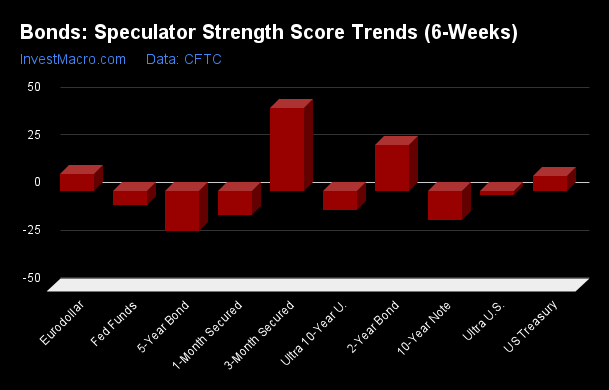
COT Strength Score Trends (or move index, calculates the 6-week changes in strength scores) showed that the SOFR 3-Months (44 percent) and the 2-Year Bonds (24 percent) lead the past six weeks trends for bonds.
The 10-Year Bonds (-15 percent) leads the downside trend scores currently with the Ultra 10-Year Bonds (-10 percent) and the Fed Funds (-7 percent) following next with lower trend scores.
Strength Trend Statistics:
Fed Funds (-7.1 percent) vs Fed Funds previous week (-6.9 percent)
2-Year Bond (24.4 percent) vs 2-Year Bond previous week (21.8 percent)
5-Year Bond (-20.8 percent) vs 5-Year Bond previous week (-10.6 percent)
10-Year Bond (-14.9 percent) vs 10-Year Bond previous week (11.3 percent)
Ultra 10-Year Bond (-9.8 percent) vs Ultra 10-Year Bond previous week (-6.4 percent)
US Treasury Bond (8.2 percent) vs US Treasury Bond previous week (30.5 percent)
Ultra US Treasury Bond (-1.9 percent) vs Ultra US Treasury Bond previous week (-1.9 percent)
Eurodollar (9.3 percent) vs Eurodollar previous week (10.3 percent)
SOFR 3-Months (43.9 percent) vs SOFR 3-Months previous week (40.2 percent)
Individual Bond Markets:
3-Month Eurodollars Futures:
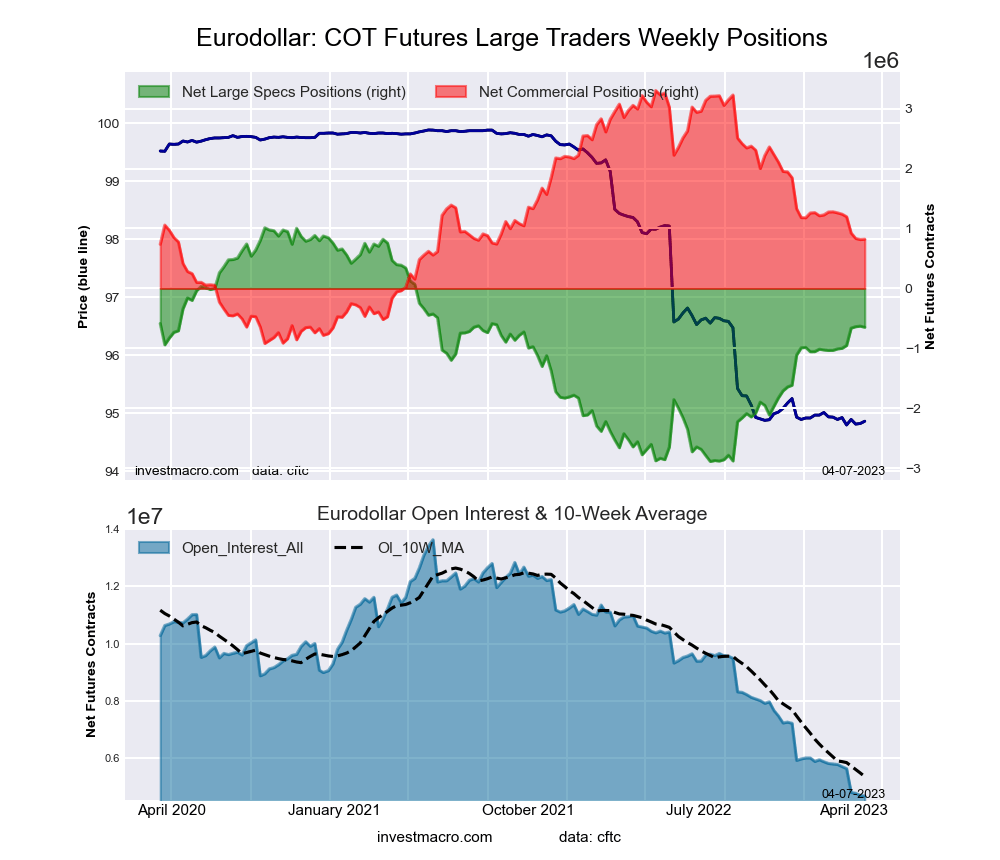 The 3-Month Eurodollars large speculator standing this week resulted in a net position of -647,319 contracts in the data reported through Tuesday. This was a weekly decrease of -17,911 contracts from the previous week which had a total of -629,408 net contracts.
This week’s current strength score (the trader positioning range over the past three years, measured from 0 to 100) shows the speculators are currently Bullish with a score of 57.4 percent. The commercials are Bearish with a score of 41.2 percent and the small traders (not shown in chart) are Bullish with a score of 66.3 percent.
| 3-Month Eurodollars Statistics | SPECULATORS | COMMERCIALS | SMALL TRADERS |
| – Percent of Open Interest Longs: | 5.9 | 67.6 | 5.1 |
| – Percent of Open Interest Shorts: | 19.7 | 50.1 | 8.8 |
| – Net Position: | -647,319 | 820,938 | -173,619 |
| – Gross Longs: | 275,724 | 3,168,706 | 237,406 |
| – Gross Shorts: | 923,043 | 2,347,768 | 411,025 |
| – Long to Short Ratio: | 0.3 to 1 | 1.3 to 1 | 0.6 to 1 |
| NET POSITION TREND: | |||
| – Strength Index Score (3 Year Range Pct): | 57.4 | 41.2 | 66.3 |
| – Strength Index Reading (3 Year Range): | Bullish | Bearish | Bullish |
| NET POSITION MOVEMENT INDEX: | |||
| – 6-Week Change in Strength Index: | 9.3 | -10.4 | 17.3 |
Secured Overnight Financing Rate (3-Month) Futures:
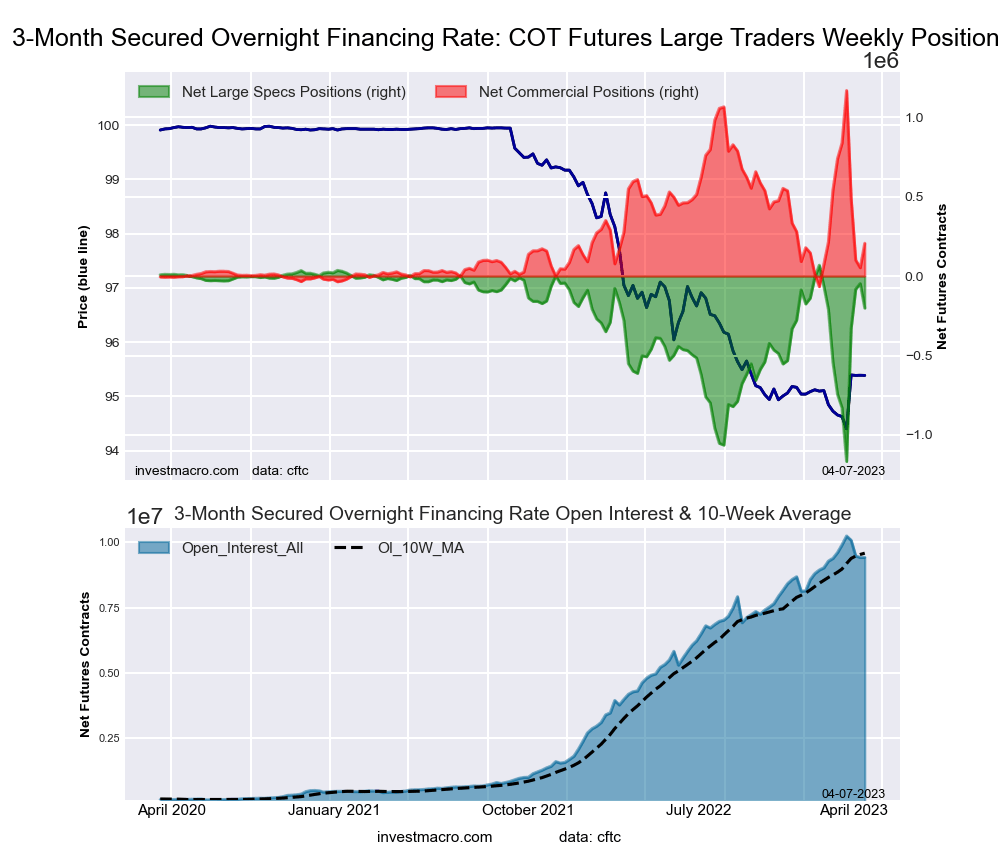 The Secured Overnight Financing Rate (3-Month) large speculator standing this week resulted in a net position of -201,277 contracts in the data reported through Tuesday. This was a weekly decline of -154,078 contracts from the previous week which had a total of -47,199 net contracts.
This week’s current strength score (the trader positioning range over the past three years, measured from 0 to 100) shows the speculators are currently Bullish with a score of 78.2 percent. The commercials are Bearish with a score of 22.1 percent and the small traders (not shown in chart) are Bullish-Extreme with a score of 85.2 percent.
| SOFR 3-Months Statistics | SPECULATORS | COMMERCIALS | SMALL TRADERS |
| – Percent of Open Interest Longs: | 20.1 | 57.9 | 0.9 |
| – Percent of Open Interest Shorts: | 22.2 | 55.7 | 0.9 |
| – Net Position: | -201,277 | 206,206 | -4,929 |
| – Gross Longs: | 1,887,973 | 5,451,417 | 80,647 |
| – Gross Shorts: | 2,089,250 | 5,245,211 | 85,576 |
| – Long to Short Ratio: | 0.9 to 1 | 1.0 to 1 | 0.9 to 1 |
| NET POSITION TREND: | |||
| – Strength Index Score (3 Year Range Pct): | 78.2 | 22.1 | 85.2 |
| – Strength Index Reading (3 Year Range): | Bullish | Bearish | Bullish-Extreme |
| NET POSITION MOVEMENT INDEX: | |||
| – 6-Week Change in Strength Index: | 43.9 | -43.1 | -5.6 |
30-Day Federal Funds Futures:
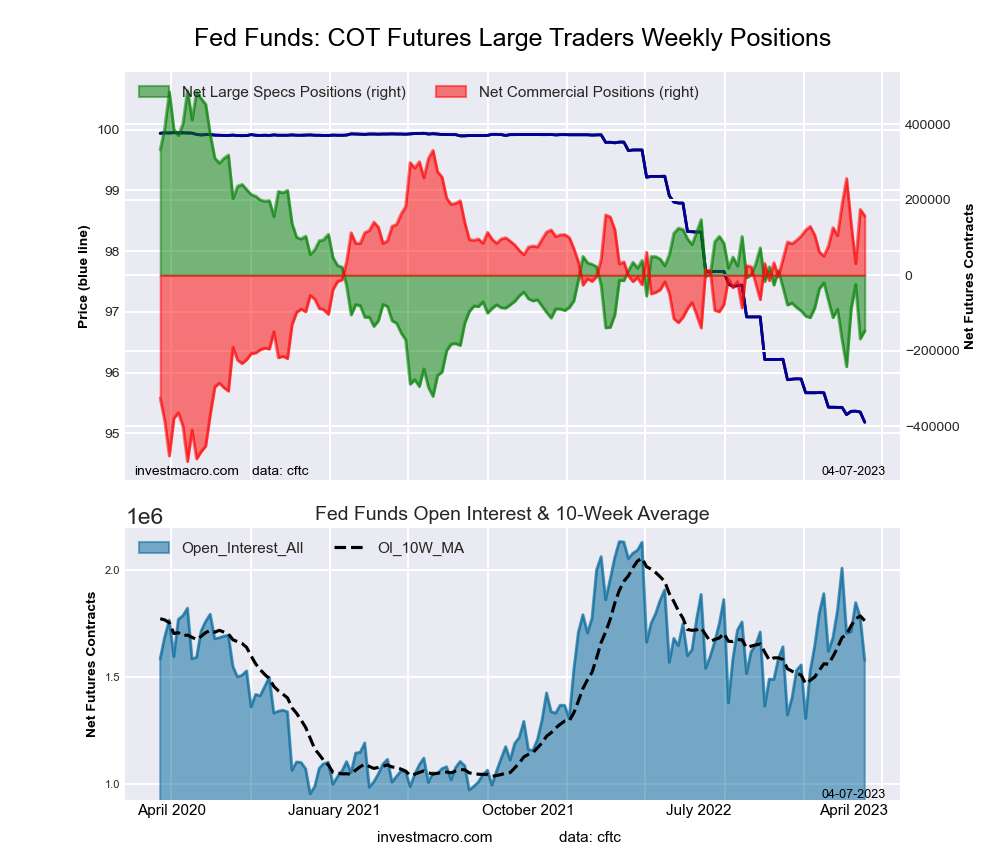 The 30-Day Federal Funds large speculator standing this week resulted in a net position of -147,240 contracts in the data reported through Tuesday. This was a weekly lift of 21,360 contracts from the previous week which had a total of -168,600 net contracts.
This week’s current strength score (the trader positioning range over the past three years, measured from 0 to 100) shows the speculators are currently Bearish with a score of 21.4 percent. The commercials are Bullish with a score of 78.9 percent and the small traders (not shown in chart) are Bullish with a score of 72.0 percent.
| 30-Day Federal Funds Statistics | SPECULATORS | COMMERCIALS | SMALL TRADERS |
| – Percent of Open Interest Longs: | 2.2 | 81.5 | 2.5 |
| – Percent of Open Interest Shorts: | 11.6 | 71.6 | 3.1 |
| – Net Position: | -147,240 | 156,927 | -9,687 |
| – Gross Longs: | 35,204 | 1,285,513 | 38,653 |
| – Gross Shorts: | 182,444 | 1,128,586 | 48,340 |
| – Long to Short Ratio: | 0.2 to 1 | 1.1 to 1 | 0.8 to 1 |
| NET POSITION TREND: | |||
| – Strength Index Score (3 Year Range Pct): | 21.4 | 78.9 | 72.0 |
| – Strength Index Reading (3 Year Range): | Bearish | Bullish | Bullish |
| NET POSITION MOVEMENT INDEX: | |||
| – 6-Week Change in Strength Index: | -7.1 | 6.3 | 10.3 |
2-Year Treasury Note Futures:
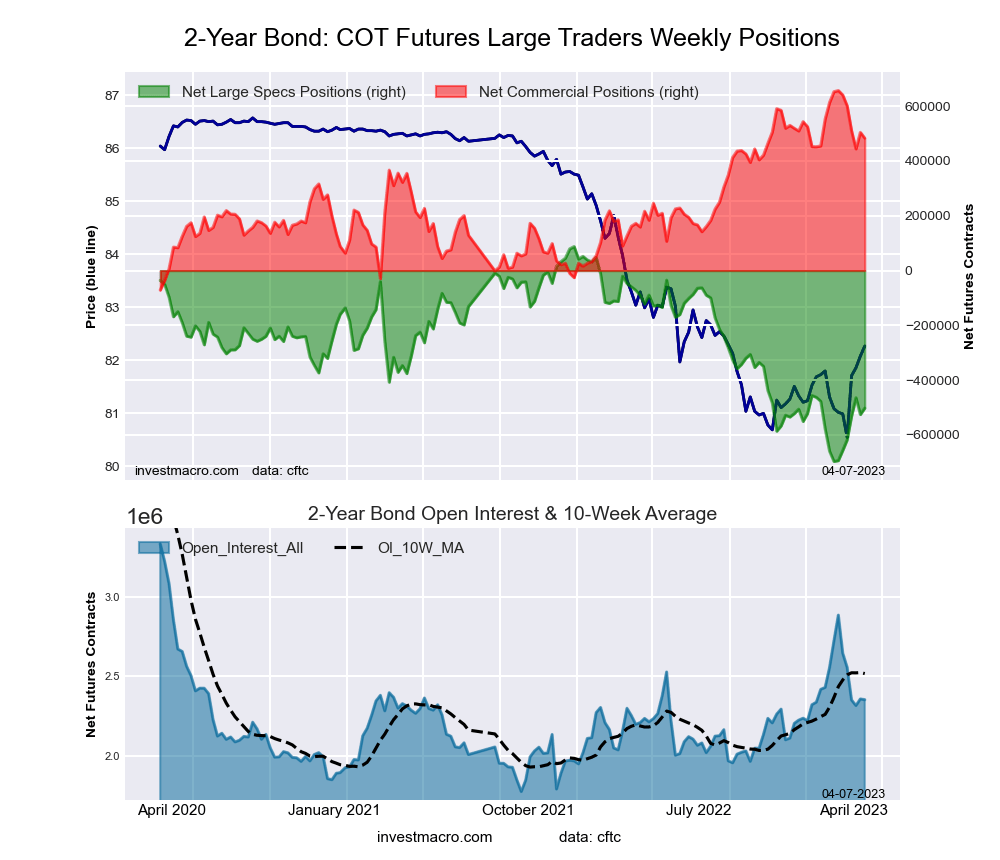 The 2-Year Treasury Note large speculator standing this week resulted in a net position of -502,055 contracts in the data reported through Tuesday. This was a weekly boost of 23,422 contracts from the previous week which had a total of -525,477 net contracts.
This week’s current strength score (the trader positioning range over the past three years, measured from 0 to 100) shows the speculators are currently Bearish with a score of 24.8 percent. The commercials are Bullish with a score of 75.3 percent and the small traders (not shown in chart) are Bullish with a score of 64.9 percent.
| 2-Year Treasury Note Statistics | SPECULATORS | COMMERCIALS | SMALL TRADERS |
| – Percent of Open Interest Longs: | 5.6 | 84.8 | 8.3 |
| – Percent of Open Interest Shorts: | 26.9 | 64.3 | 7.5 |
| – Net Position: | -502,055 | 483,170 | 18,885 |
| – Gross Longs: | 131,369 | 1,994,892 | 194,214 |
| – Gross Shorts: | 633,424 | 1,511,722 | 175,329 |
| – Long to Short Ratio: | 0.2 to 1 | 1.3 to 1 | 1.1 to 1 |
| NET POSITION TREND: | |||
| – Strength Index Score (3 Year Range Pct): | 24.8 | 75.3 | 64.9 |
| – Strength Index Reading (3 Year Range): | Bearish | Bullish | Bullish |
| NET POSITION MOVEMENT INDEX: | |||
| – 6-Week Change in Strength Index: | 24.4 | -24.7 | -8.4 |
5-Year Treasury Note Futures:
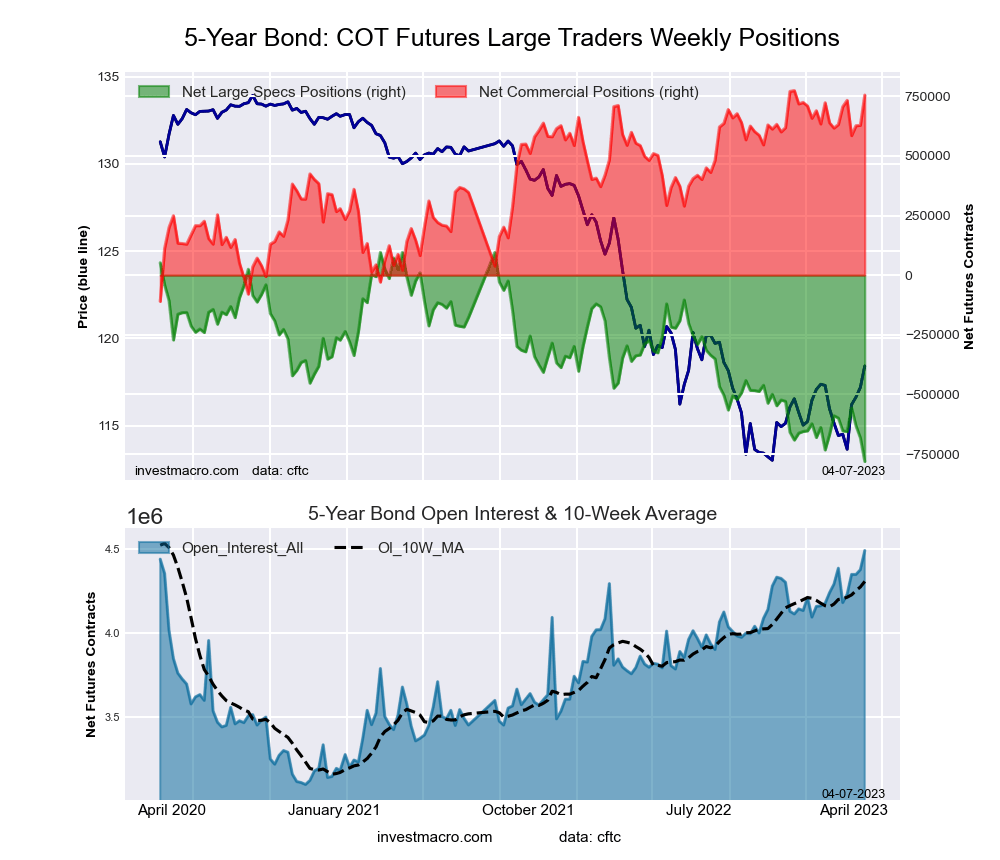 The 5-Year Treasury Note large speculator standing this week resulted in a net position of -781,239 contracts in the data reported through Tuesday. This was a weekly decrease of -98,884 contracts from the previous week which had a total of -682,355 net contracts.
This week’s current strength score (the trader positioning range over the past three years, measured from 0 to 100) shows the speculators are currently Bearish-Extreme with a score of 0.0 percent. The commercials are Bullish-Extreme with a score of 97.8 percent and the small traders (not shown in chart) are Bullish-Extreme with a score of 88.2 percent.
| 5-Year Treasury Note Statistics | SPECULATORS | COMMERCIALS | SMALL TRADERS |
| – Percent of Open Interest Longs: | 6.2 | 84.4 | 8.2 |
| – Percent of Open Interest Shorts: | 23.5 | 67.6 | 7.6 |
| – Net Position: | -781,239 | 754,970 | 26,269 |
| – Gross Longs: | 276,432 | 3,791,191 | 366,353 |
| – Gross Shorts: | 1,057,671 | 3,036,221 | 340,084 |
| – Long to Short Ratio: | 0.3 to 1 | 1.2 to 1 | 1.1 to 1 |
| NET POSITION TREND: | |||
| – Strength Index Score (3 Year Range Pct): | 0.0 | 97.8 | 88.2 |
| – Strength Index Reading (3 Year Range): | Bearish-Extreme | Bullish-Extreme | Bullish-Extreme |
| NET POSITION MOVEMENT INDEX: | |||
| – 6-Week Change in Strength Index: | -20.8 | 14.5 | 16.0 |
10-Year Treasury Note Futures:
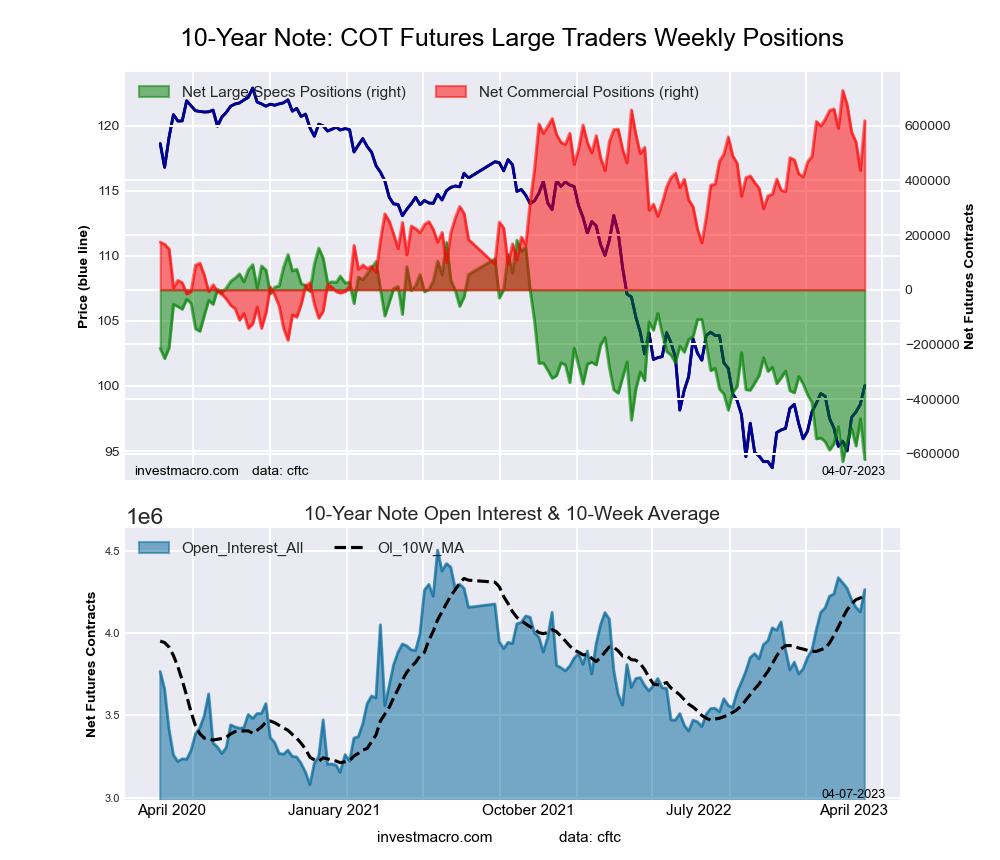 The 10-Year Treasury Note large speculator standing this week resulted in a net position of -621,031 contracts in the data reported through Tuesday. This was a weekly decline of -149,453 contracts from the previous week which had a total of -471,578 net contracts.
This week’s current strength score (the trader positioning range over the past three years, measured from 0 to 100) shows the speculators are currently Bearish-Extreme with a score of 0.9 percent. The commercials are Bullish-Extreme with a score of 87.9 percent and the small traders (not shown in chart) are Bullish-Extreme with a score of 84.0 percent.
| 10-Year Treasury Note Statistics | SPECULATORS | COMMERCIALS | SMALL TRADERS |
| – Percent of Open Interest Longs: | 8.6 | 80.7 | 8.8 |
| – Percent of Open Interest Shorts: | 23.2 | 66.2 | 8.7 |
| – Net Position: | -621,031 | 618,359 | 2,672 |
| – Gross Longs: | 366,793 | 3,440,398 | 374,033 |
| – Gross Shorts: | 987,824 | 2,822,039 | 371,361 |
| – Long to Short Ratio: | 0.4 to 1 | 1.2 to 1 | 1.0 to 1 |
| NET POSITION TREND: | |||
| – Strength Index Score (3 Year Range Pct): | 0.9 | 87.9 | 84.0 |
| – Strength Index Reading (3 Year Range): | Bearish-Extreme | Bullish-Extreme | Bullish-Extreme |
| NET POSITION MOVEMENT INDEX: | |||
| – 6-Week Change in Strength Index: | -14.9 | 3.1 | 22.8 |
Ultra 10-Year Notes Futures:
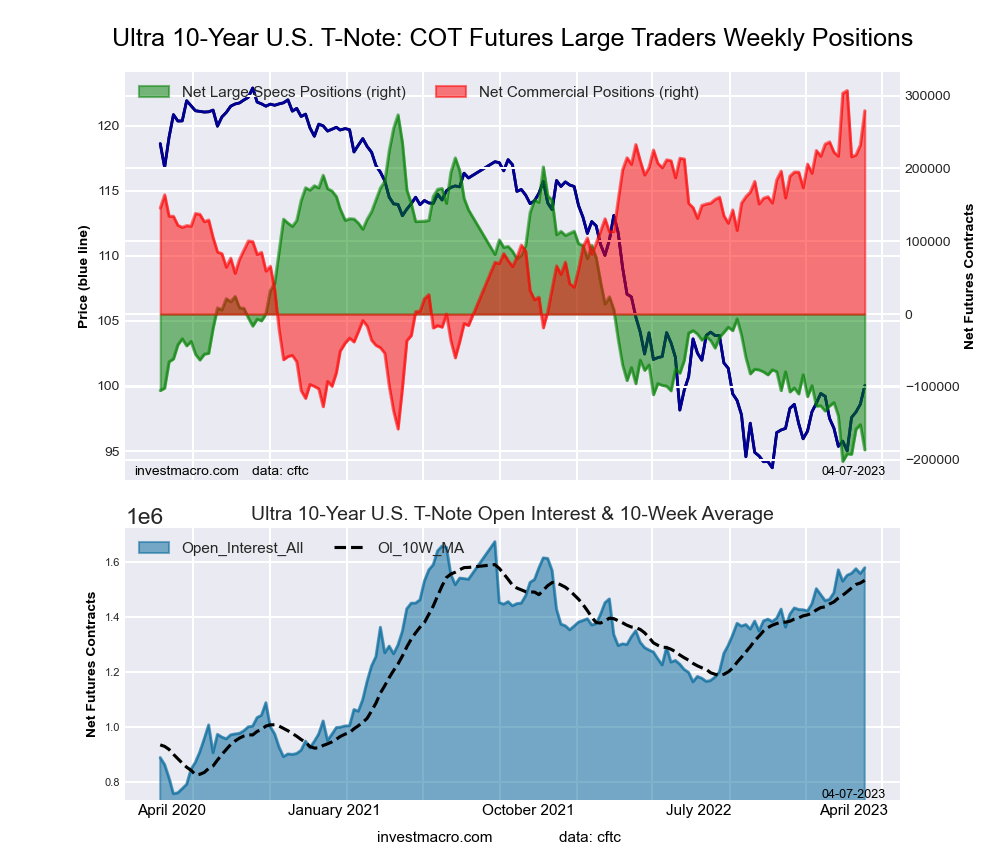 The Ultra 10-Year Notes large speculator standing this week resulted in a net position of -186,477 contracts in the data reported through Tuesday. This was a weekly decline of -34,673 contracts from the previous week which had a total of -151,804 net contracts.
This week’s current strength score (the trader positioning range over the past three years, measured from 0 to 100) shows the speculators are currently Bearish-Extreme with a score of 3.4 percent. The commercials are Bullish-Extreme with a score of 94.0 percent and the small traders (not shown in chart) are Bullish with a score of 58.9 percent.
| Ultra 10-Year Notes Statistics | SPECULATORS | COMMERCIALS | SMALL TRADERS |
| – Percent of Open Interest Longs: | 7.8 | 80.3 | 10.8 |
| – Percent of Open Interest Shorts: | 19.6 | 62.6 | 16.7 |
| – Net Position: | -186,477 | 279,297 | -92,820 |
| – Gross Longs: | 122,771 | 1,268,053 | 171,348 |
| – Gross Shorts: | 309,248 | 988,756 | 264,168 |
| – Long to Short Ratio: | 0.4 to 1 | 1.3 to 1 | 0.6 to 1 |
| NET POSITION TREND: | |||
| – Strength Index Score (3 Year Range Pct): | 3.4 | 94.0 | 58.9 |
| – Strength Index Reading (3 Year Range): | Bearish-Extreme | Bullish-Extreme | Bullish |
| NET POSITION MOVEMENT INDEX: | |||
| – 6-Week Change in Strength Index: | -9.8 | 13.4 | -9.3 |
US Treasury Bonds Futures:
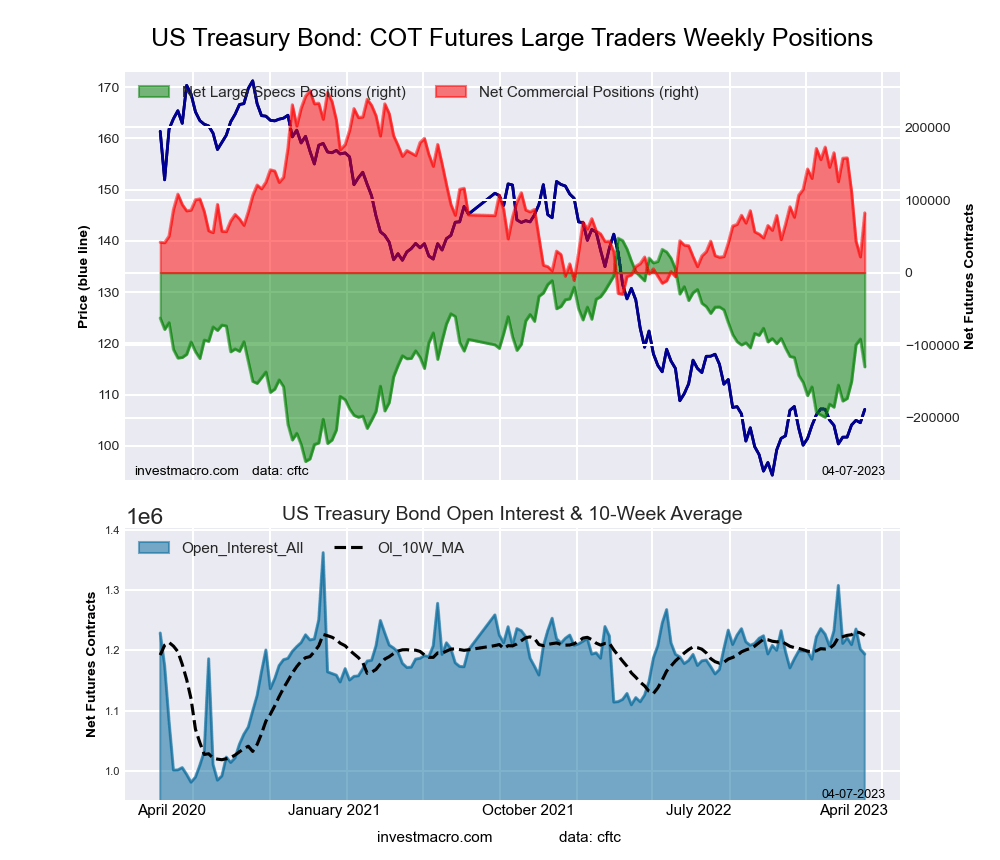 The US Treasury Bonds large speculator standing this week resulted in a net position of -129,646 contracts in the data reported through Tuesday. This was a weekly reduction of -38,247 contracts from the previous week which had a total of -91,399 net contracts.
This week’s current strength score (the trader positioning range over the past three years, measured from 0 to 100) shows the speculators are currently Bearish with a score of 42.4 percent. The commercials are Bearish with a score of 39.9 percent and the small traders (not shown in chart) are Bullish-Extreme with a score of 83.6 percent.
| US Treasury Bonds Statistics | SPECULATORS | COMMERCIALS | SMALL TRADERS |
| – Percent of Open Interest Longs: | 6.6 | 79.1 | 13.9 |
| – Percent of Open Interest Shorts: | 17.4 | 72.3 | 9.9 |
| – Net Position: | -129,646 | 82,281 | 47,365 |
| – Gross Longs: | 78,208 | 944,657 | 165,747 |
| – Gross Shorts: | 207,854 | 862,376 | 118,382 |
| – Long to Short Ratio: | 0.4 to 1 | 1.1 to 1 | 1.4 to 1 |
| NET POSITION TREND: | |||
| – Strength Index Score (3 Year Range Pct): | 42.4 | 39.9 | 83.6 |
| – Strength Index Reading (3 Year Range): | Bearish | Bearish | Bullish-Extreme |
| NET POSITION MOVEMENT INDEX: | |||
| – 6-Week Change in Strength Index: | 8.2 | -15.3 | 13.1 |
Ultra US Treasury Bonds Futures:
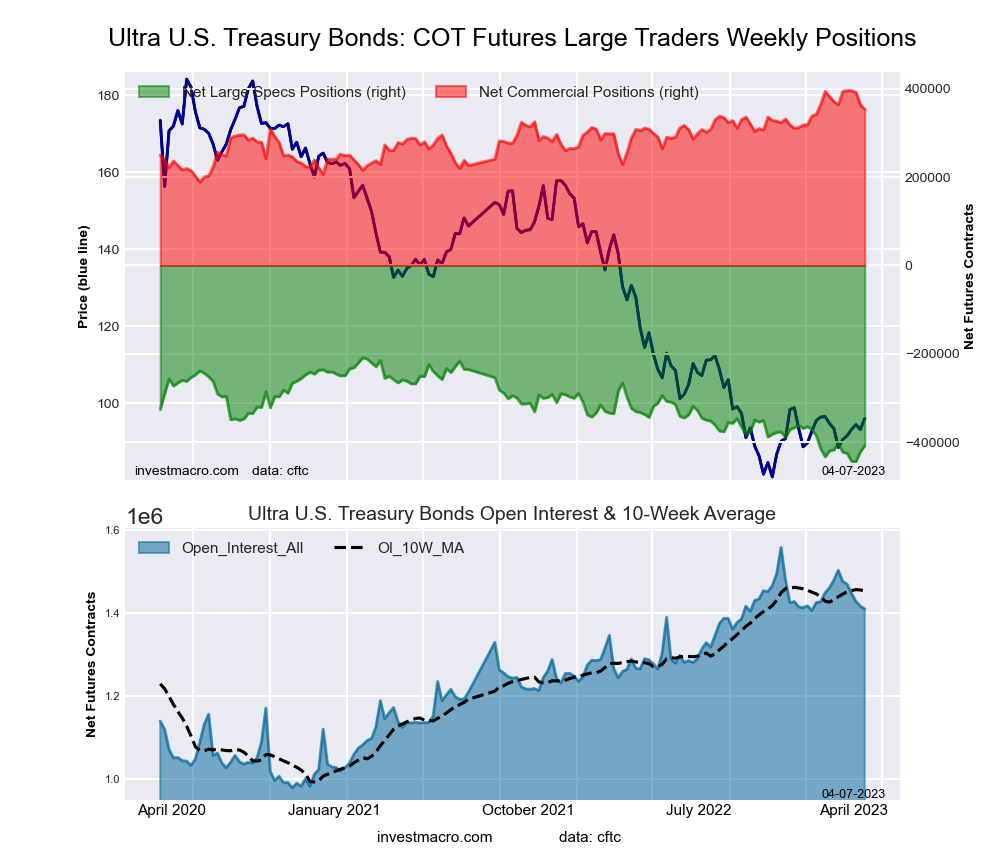 The Ultra US Treasury Bonds large speculator standing this week resulted in a net position of -407,758 contracts in the data reported through Tuesday. This was a weekly increase of 14,018 contracts from the previous week which had a total of -421,776 net contracts.
This week’s current strength score (the trader positioning range over the past three years, measured from 0 to 100) shows the speculators are currently Bearish-Extreme with a score of 15.4 percent. The commercials are Bullish with a score of 79.4 percent and the small traders (not shown in chart) are Bullish-Extreme with a score of 94.2 percent.
| Ultra US Treasury Bonds Statistics | SPECULATORS | COMMERCIALS | SMALL TRADERS |
| – Percent of Open Interest Longs: | 5.1 | 83.1 | 11.7 |
| – Percent of Open Interest Shorts: | 34.0 | 58.1 | 7.8 |
| – Net Position: | -407,758 | 353,313 | 54,445 |
| – Gross Longs: | 71,916 | 1,171,667 | 164,167 |
| – Gross Shorts: | 479,674 | 818,354 | 109,722 |
| – Long to Short Ratio: | 0.1 to 1 | 1.4 to 1 | 1.5 to 1 |
| NET POSITION TREND: | |||
| – Strength Index Score (3 Year Range Pct): | 15.4 | 79.4 | 94.2 |
| – Strength Index Reading (3 Year Range): | Bearish-Extreme | Bullish | Bullish-Extreme |
| NET POSITION MOVEMENT INDEX: | |||
| – 6-Week Change in Strength Index: | -1.9 | -5.1 | 15.1 |
Article By InvestMacro – Receive our weekly COT Newsletter
*COT Report: The COT data, released weekly to the public each Friday, is updated through the most recent Tuesday (data is 3 days old) and shows a quick view of how large speculators or non-commercials (for-profit traders) were positioned in the futures markets.
The CFTC categorizes trader positions according to commercial hedgers (traders who use futures contracts for hedging as part of the business), non-commercials (large traders who speculate to realize trading profits) and nonreportable traders (usually small traders/speculators) as well as their open interest (contracts open in the market at time of reporting). See CFTC criteria here.

- COT Metals Charts: Weekly Speculator Bets led by Copper & Steel Jul 18, 2026
- COT Bonds Charts: Weekly Speculator Bets led by 2-Year, SOFR 3M & 5-Year Bonds Jul 18, 2026
- COT Energy Charts: Weekly Speculator Bets led by Brent Oil & Heating Oil Jul 18, 2026
- COT Soft Commodities Charts: Weekly Speculator Bets led by Wheat, Corn & Soybean Meal Jul 18, 2026
- The Bank of Canada kept its interest rate unchanged. Platinum prices reached a three‑week high Jul 16, 2026
- Stock indices rose after the release of US inflation data. China’s GDP slowed sharply Jul 15, 2026
- GBP/USD Awaits Political News: What Will Happen Next Jul 15, 2026
- USD/JPY Holds at Highs: Pressure Lingers on Yen Jul 14, 2026
- Oil prices jumped 4% amid a new wave of escalation between the US and Iran Jul 13, 2026
- EUR/USD: US Inflation Will Determine Everything Jul 13, 2026