
By InvestMacro 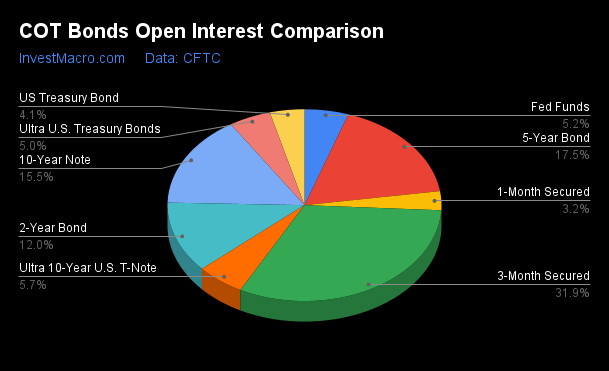
Here are the latest charts and statistics for the Commitment of Traders (COT) reports data published by the Commodities Futures Trading Commission (CFTC).
The latest COT data is updated through Tuesday July 18th and shows a quick view of how large traders (for-profit speculators and commercial hedgers) were positioned in the futures markets.
Weekly Speculator Changes led by 10-Year Bonds & Fed Funds
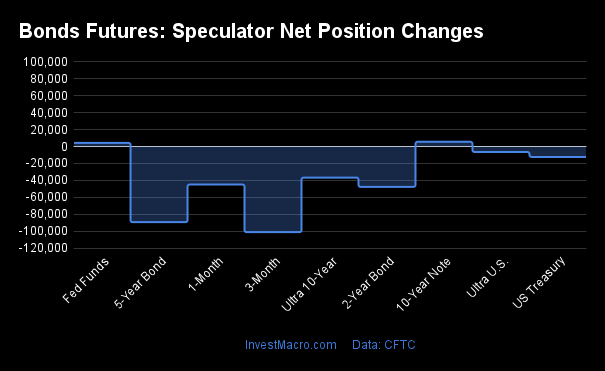
The COT bond market speculator bets were lower this week as two out of the eight bond markets we cover had higher positioning while the other six markets had lower speculator contracts.
Leading the gains for the bond markets was the 10-Year Bonds (5,576 contracts) with the Fed Funds (4,285 contracts) also having a positive week.
Free Reports:
 Sign Up for Our Stock Market Newsletter – Get updated on News, Charts & Rankings of Public Companies when you join our Stocks Newsletter
 Get our Weekly Commitment of Traders Reports - See where the biggest traders (Hedge Funds and Commercial Hedgers) are positioned in the futures markets on a weekly basis.
The bond markets with declines in speculator bets for the week were the SOFR 3-Months (-101,216 contracts), the 2-Year Bonds (-47,680 contracts), 5-Year Bonds (-89,405 contracts), the US Treasury Bonds (-12,310 contracts), the Ultra 10-Year Bonds (-36,694 contracts) and the Ultra Treasury Bonds (-6,485 contracts) also registering lower bets on the week.
| Jul-18-2023 | OI | OI-Index | Spec-Net | Spec-Index | Com-Net | COM-Index | Smalls-Net | Smalls-Index |
|---|---|---|---|---|---|---|---|---|
| SOFR-3-Months | 9,743,755 | 93 | -64,814 | 76 | 71,653 | 23 | -6,839 | 84 |
| FedFunds | 1,587,838 | 54 | -160,574 | 25 | 171,109 | 75 | -10,535 | 70 |
| 2-Year | 3,654,986 | 99 | -1,119,380 | 0 | 1,019,100 | 100 | 100,280 | 100 |
| Long T-Bond | 1,248,006 | 61 | -143,294 | 38 | 102,899 | 47 | 40,395 | 78 |
| 10-Year | 4,746,657 | 91 | -629,561 | 21 | 627,008 | 86 | 2,553 | 74 |
| 5-Year | 5,333,980 | 100 | -1,145,489 | 0 | 1,099,014 | 100 | 46,475 | 94 |
Strength Scores led by SOFR 3-Months & US Treasury Bonds
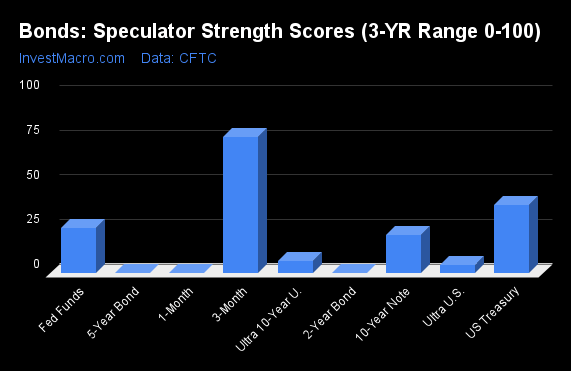
COT Strength Scores (a normalized measure of Speculator positions over a 3-Year range, from 0 to 100 where above 80 is Extreme-Bullish and below 20 is Extreme-Bearish) showed that the SOFR 3-Months (76 percent) and the US Treasury Bonds (38 percent) lead the bond markets this week. The Fed Funds (25 percent) comes in as the next highest in the weekly strength scores.
On the downside, the 5-Year Bonds (0 percent), the 2-Year Bonds (0 percent), the Ultra Treasury Bonds (5 percent) and the Ultra 10-Year Bonds (7 percent) come in at the lowest strength level currently and are in Extreme-Bearish territory (below 20 percent).
Strength Statistics:
Fed Funds (25.1 percent) vs Fed Funds previous week (24.4 percent)
2-Year Bond (0.0 percent) vs 2-Year Bond previous week (3.9 percent)
5-Year Bond (0.0 percent) vs 5-Year Bond previous week (7.2 percent)
10-Year Bond (21.4 percent) vs 10-Year Bond previous week (20.9 percent)
Ultra 10-Year Bond (6.7 percent) vs Ultra 10-Year Bond previous week (14.2 percent)
US Treasury Bond (38.0 percent) vs US Treasury Bond previous week (42.0 percent)
Ultra US Treasury Bond (4.6 percent) vs Ultra US Treasury Bond previous week (7.3 percent)
SOFR 3-Months (76.0 percent) vs SOFR 3-Months previous week (82.9 percent)
Fed Funds & 10-Year Bonds top the 6-Week Strength Trends
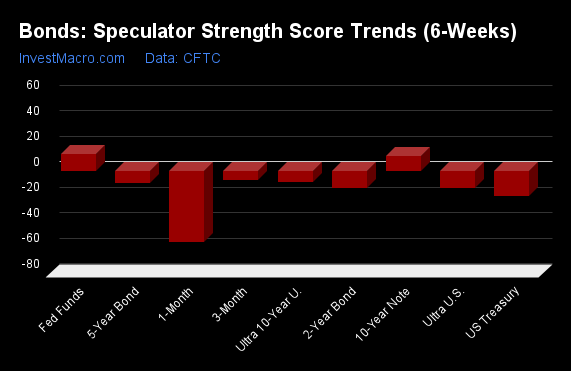
COT Strength Score Trends (or move index, calculates the 6-week changes in strength scores) showed that the Fed Funds (14 percent) and the 10-Year Bonds (12 percent) lead the past six weeks trends for bonds. The SOFR 3-Months (-7 percent) and the are the next highest positive movers in the latest trends data.
The US Treasury Bonds (-20 percent) and the Ultra Treasury Bonds (-13 percent) leads the downside trend scores currently with the 2-Year Bonds (-13 percent) and the 5-Year Bonds (-10 percent) following next with lower trend scores.
Strength Trend Statistics:
Fed Funds (13.5 percent) vs Fed Funds previous week (2.4 percent)
2-Year Bond (-13.2 percent) vs 2-Year Bond previous week (-8.4 percent)
5-Year Bond (-9.5 percent) vs 5-Year Bond previous week (-5.8 percent)
10-Year Bond (12.0 percent) vs 10-Year Bond previous week (20.9 percent)
Ultra 10-Year Bond (-8.7 percent) vs Ultra 10-Year Bond previous week (-7.7 percent)
US Treasury Bond (-19.6 percent) vs US Treasury Bond previous week (-23.1 percent)
Ultra US Treasury Bond (-13.4 percent) vs Ultra US Treasury Bond previous week (-13.7 percent)
SOFR 3-Months (-7.2 percent) vs SOFR 3-Months previous week (-0.5 percent)
Secured Overnight Financing Rate (3-Month) Futures:
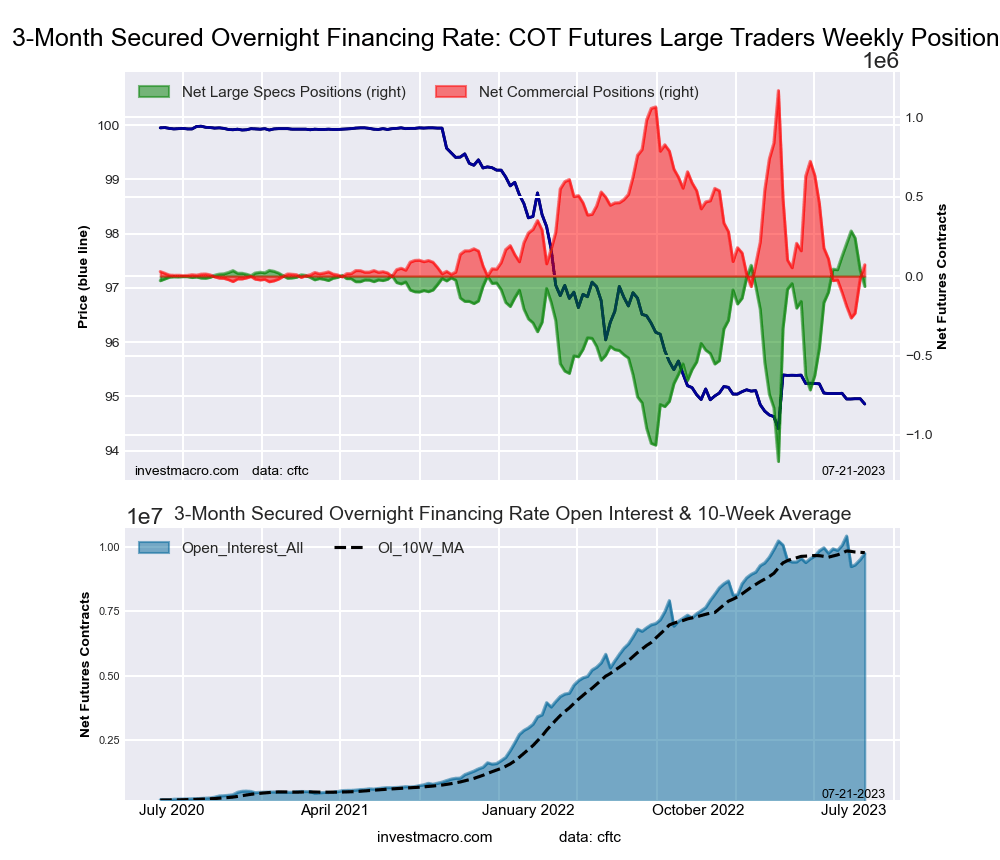 The Secured Overnight Financing Rate (3-Month) large speculator standing this week came in at a net position of -64,814 contracts in the data reported through Tuesday. This was a weekly lowering of -101,216 contracts from the previous week which had a total of 36,402 net contracts.
This week’s current strength score (the trader positioning range over the past three years, measured from 0 to 100) shows the speculators are currently Bullish with a score of 76.0 percent. The commercials are Bearish with a score of 23.4 percent and the small traders (not shown in chart) are Bullish-Extreme with a score of 84.1 percent.
Price Trend-Following Model: Weak Uptrend
Our weekly trend-following model classifies the current market price position as: Weak Uptrend. The current action for the model is considered to be: Hold – Maintain Long Position.
| SOFR 3-Months Statistics | SPECULATORS | COMMERCIALS | SMALL TRADERS |
| – Percent of Open Interest Longs: | 17.4 | 60.4 | 0.3 |
| – Percent of Open Interest Shorts: | 18.1 | 59.7 | 0.3 |
| – Net Position: | -64,814 | 71,653 | -6,839 |
| – Gross Longs: | 1,698,709 | 5,884,636 | 26,636 |
| – Gross Shorts: | 1,763,523 | 5,812,983 | 33,475 |
| – Long to Short Ratio: | 1.0 to 1 | 1.0 to 1 | 0.8 to 1 |
| NET POSITION TREND: | |||
| – Strength Index Score (3 Year Range Pct): | 76.0 | 23.4 | 84.1 |
| – Strength Index Reading (3 Year Range): | Bullish | Bearish | Bullish-Extreme |
| NET POSITION MOVEMENT INDEX: | |||
| – 6-Week Change in Strength Index: | -7.2 | 6.7 | 4.9 |
30-Day Federal Funds Futures:
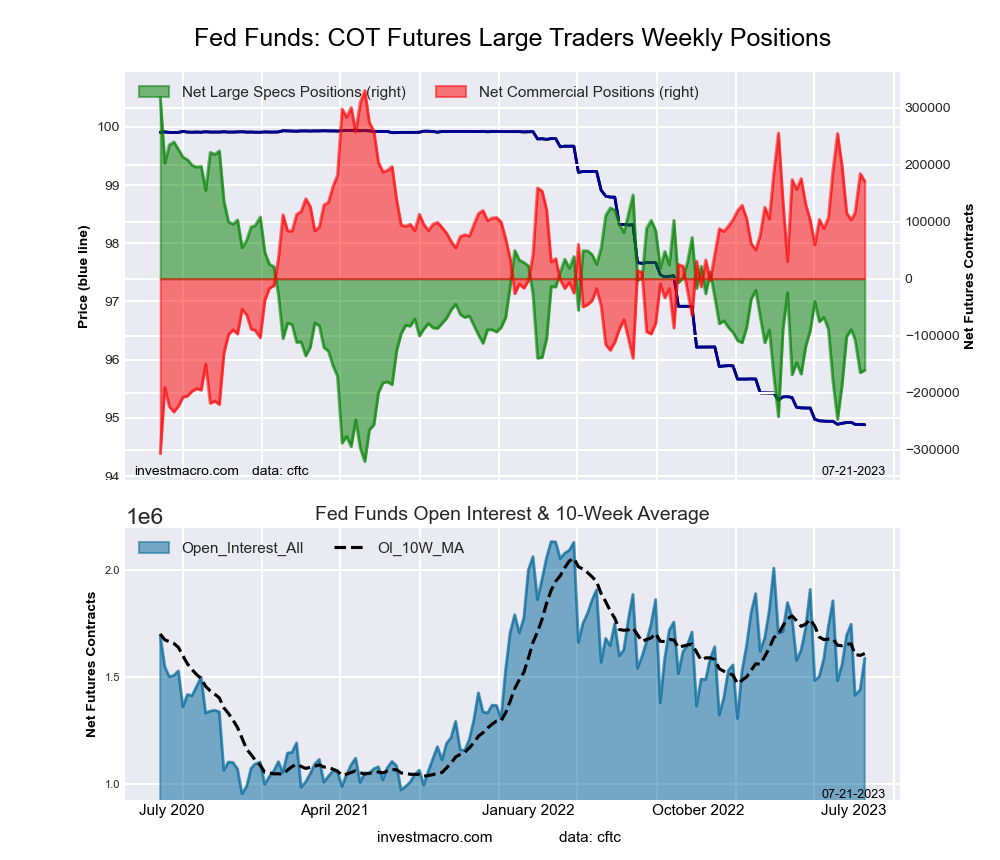 The 30-Day Federal Funds large speculator standing this week came in at a net position of -160,574 contracts in the data reported through Tuesday. This was a weekly gain of 4,285 contracts from the previous week which had a total of -164,859 net contracts.
This week’s current strength score (the trader positioning range over the past three years, measured from 0 to 100) shows the speculators are currently Bearish with a score of 25.1 percent. The commercials are Bullish with a score of 75.0 percent and the small traders (not shown in chart) are Bullish with a score of 70.3 percent.
Price Trend-Following Model: Downtrend
Our weekly trend-following model classifies the current market price position as: Downtrend. The current action for the model is considered to be: Hold – Maintain Short Position.
| 30-Day Federal Funds Statistics | SPECULATORS | COMMERCIALS | SMALL TRADERS |
| – Percent of Open Interest Longs: | 4.0 | 73.3 | 2.2 |
| – Percent of Open Interest Shorts: | 14.1 | 62.5 | 2.8 |
| – Net Position: | -160,574 | 171,109 | -10,535 |
| – Gross Longs: | 63,814 | 1,163,314 | 34,331 |
| – Gross Shorts: | 224,388 | 992,205 | 44,866 |
| – Long to Short Ratio: | 0.3 to 1 | 1.2 to 1 | 0.8 to 1 |
| NET POSITION TREND: | |||
| – Strength Index Score (3 Year Range Pct): | 25.1 | 75.0 | 70.3 |
| – Strength Index Reading (3 Year Range): | Bearish | Bullish | Bullish |
| NET POSITION MOVEMENT INDEX: | |||
| – 6-Week Change in Strength Index: | 13.5 | -13.2 | -4.6 |
2-Year Treasury Note Futures:
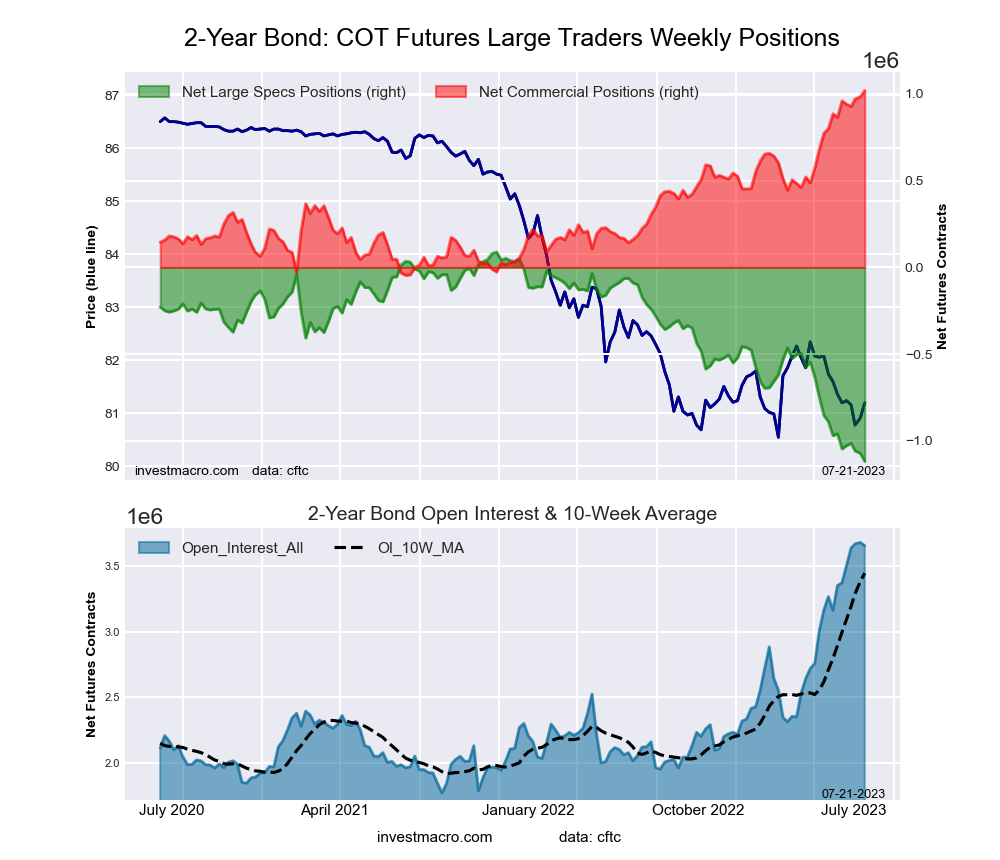 The 2-Year Treasury Note large speculator standing this week came in at a net position of -1,119,380 contracts in the data reported through Tuesday. This was a weekly decrease of -47,680 contracts from the previous week which had a total of -1,071,700 net contracts.
This week’s current strength score (the trader positioning range over the past three years, measured from 0 to 100) shows the speculators are currently Bearish-Extreme with a score of 0.0 percent. The commercials are Bullish-Extreme with a score of 100.0 percent and the small traders (not shown in chart) are Bullish-Extreme with a score of 100.0 percent.
Price Trend-Following Model: Strong Downtrend
Our weekly trend-following model classifies the current market price position as: Strong Downtrend. The current action for the model is considered to be: Hold – Maintain Short Position.
| 2-Year Treasury Note Statistics | SPECULATORS | COMMERCIALS | SMALL TRADERS |
| – Percent of Open Interest Longs: | 9.2 | 82.3 | 6.9 |
| – Percent of Open Interest Shorts: | 39.9 | 54.4 | 4.2 |
| – Net Position: | -1,119,380 | 1,019,100 | 100,280 |
| – Gross Longs: | 337,331 | 3,008,318 | 252,359 |
| – Gross Shorts: | 1,456,711 | 1,989,218 | 152,079 |
| – Long to Short Ratio: | 0.2 to 1 | 1.5 to 1 | 1.7 to 1 |
| NET POSITION TREND: | |||
| – Strength Index Score (3 Year Range Pct): | 0.0 | 100.0 | 100.0 |
| – Strength Index Reading (3 Year Range): | Bearish-Extreme | Bullish-Extreme | Bullish-Extreme |
| NET POSITION MOVEMENT INDEX: | |||
| – 6-Week Change in Strength Index: | -13.2 | 14.5 | 2.4 |
5-Year Treasury Note Futures:
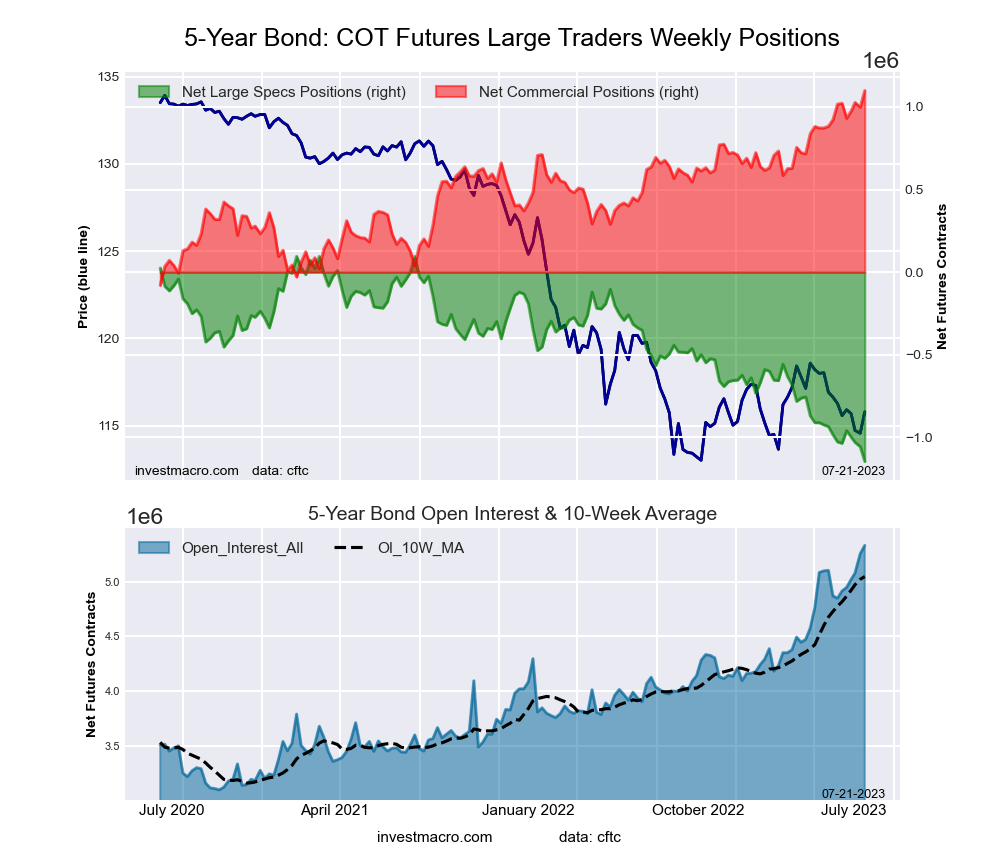 The 5-Year Treasury Note large speculator standing this week came in at a net position of -1,145,489 contracts in the data reported through Tuesday. This was a weekly decline of -89,405 contracts from the previous week which had a total of -1,056,084 net contracts.
This week’s current strength score (the trader positioning range over the past three years, measured from 0 to 100) shows the speculators are currently Bearish-Extreme with a score of 0.0 percent. The commercials are Bullish-Extreme with a score of 100.0 percent and the small traders (not shown in chart) are Bullish-Extreme with a score of 93.8 percent.
Price Trend-Following Model: Strong Downtrend
Our weekly trend-following model classifies the current market price position as: Strong Downtrend. The current action for the model is considered to be: Hold – Maintain Short Position.
| 5-Year Treasury Note Statistics | SPECULATORS | COMMERCIALS | SMALL TRADERS |
| – Percent of Open Interest Longs: | 6.7 | 85.1 | 7.1 |
| – Percent of Open Interest Shorts: | 28.1 | 64.5 | 6.2 |
| – Net Position: | -1,145,489 | 1,099,014 | 46,475 |
| – Gross Longs: | 355,966 | 4,540,528 | 376,738 |
| – Gross Shorts: | 1,501,455 | 3,441,514 | 330,263 |
| – Long to Short Ratio: | 0.2 to 1 | 1.3 to 1 | 1.1 to 1 |
| NET POSITION TREND: | |||
| – Strength Index Score (3 Year Range Pct): | 0.0 | 100.0 | 93.8 |
| – Strength Index Reading (3 Year Range): | Bearish-Extreme | Bullish-Extreme | Bullish-Extreme |
| NET POSITION MOVEMENT INDEX: | |||
| – 6-Week Change in Strength Index: | -9.5 | 7.0 | 9.9 |
10-Year Treasury Note Futures:
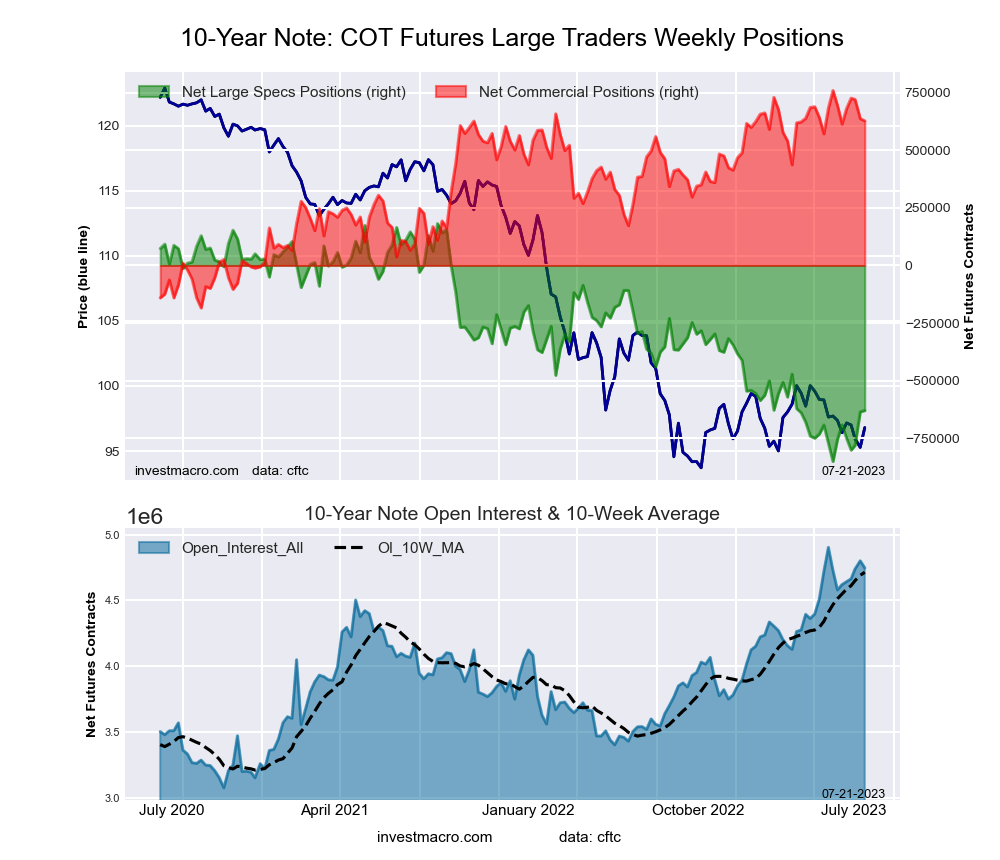 The 10-Year Treasury Note large speculator standing this week came in at a net position of -629,561 contracts in the data reported through Tuesday. This was a weekly lift of 5,576 contracts from the previous week which had a total of -635,137 net contracts.
This week’s current strength score (the trader positioning range over the past three years, measured from 0 to 100) shows the speculators are currently Bearish with a score of 21.4 percent. The commercials are Bullish-Extreme with a score of 86.0 percent and the small traders (not shown in chart) are Bullish with a score of 74.1 percent.
Price Trend-Following Model: Strong Downtrend
Our weekly trend-following model classifies the current market price position as: Strong Downtrend. The current action for the model is considered to be: Hold – Maintain Short Position.
| 10-Year Treasury Note Statistics | SPECULATORS | COMMERCIALS | SMALL TRADERS |
| – Percent of Open Interest Longs: | 9.2 | 80.7 | 8.0 |
| – Percent of Open Interest Shorts: | 22.5 | 67.5 | 8.0 |
| – Net Position: | -629,561 | 627,008 | 2,553 |
| – Gross Longs: | 438,567 | 3,828,697 | 382,073 |
| – Gross Shorts: | 1,068,128 | 3,201,689 | 379,520 |
| – Long to Short Ratio: | 0.4 to 1 | 1.2 to 1 | 1.0 to 1 |
| NET POSITION TREND: | |||
| – Strength Index Score (3 Year Range Pct): | 21.4 | 86.0 | 74.1 |
| – Strength Index Reading (3 Year Range): | Bearish | Bullish-Extreme | Bullish |
| NET POSITION MOVEMENT INDEX: | |||
| – 6-Week Change in Strength Index: | 12.0 | -7.0 | -12.6 |
Ultra 10-Year Notes Futures:
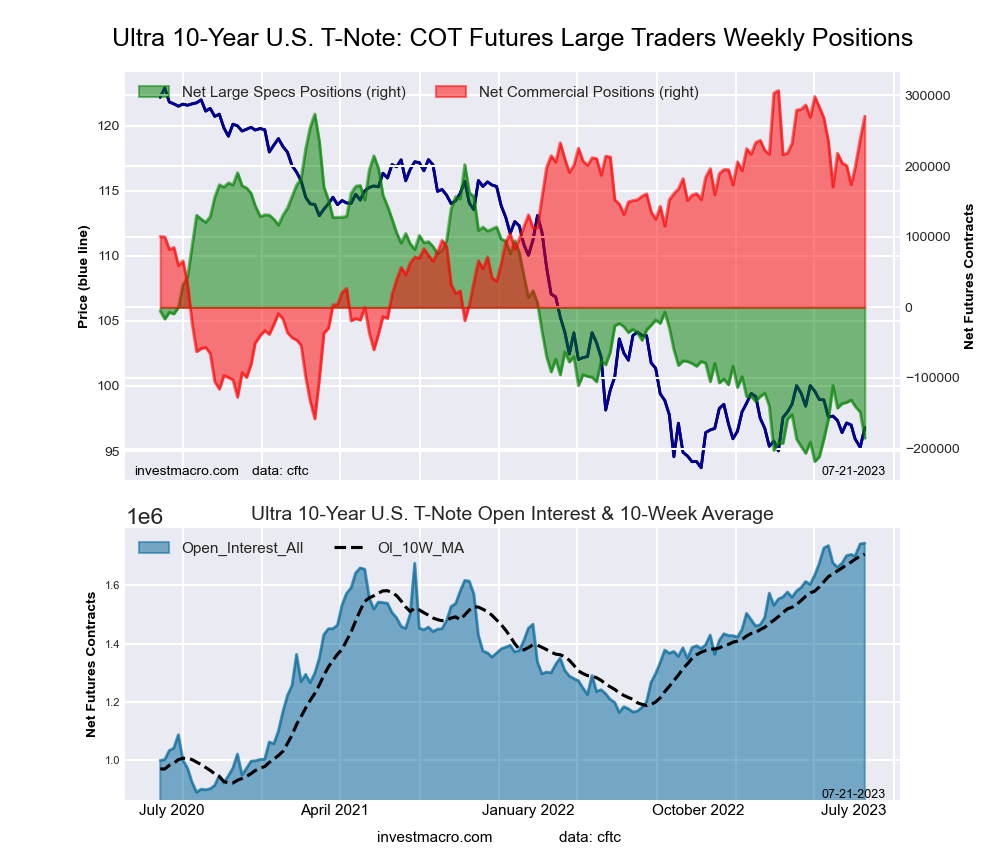 The Ultra 10-Year Notes large speculator standing this week came in at a net position of -185,167 contracts in the data reported through Tuesday. This was a weekly reduction of -36,694 contracts from the previous week which had a total of -148,473 net contracts.
This week’s current strength score (the trader positioning range over the past three years, measured from 0 to 100) shows the speculators are currently Bearish-Extreme with a score of 6.7 percent. The commercials are Bullish-Extreme with a score of 92.2 percent and the small traders (not shown in chart) are Bullish with a score of 63.3 percent.
Price Trend-Following Model: Weak Uptrend
Our weekly trend-following model classifies the current market price position as: Weak Uptrend. The current action for the model is considered to be: Hold – Maintain Long Position.
| Ultra 10-Year Notes Statistics | SPECULATORS | COMMERCIALS | SMALL TRADERS |
| – Percent of Open Interest Longs: | 10.4 | 78.1 | 9.8 |
| – Percent of Open Interest Shorts: | 21.0 | 62.6 | 14.6 |
| – Net Position: | -185,167 | 270,572 | -85,405 |
| – Gross Longs: | 180,705 | 1,361,599 | 170,041 |
| – Gross Shorts: | 365,872 | 1,091,027 | 255,446 |
| – Long to Short Ratio: | 0.5 to 1 | 1.2 to 1 | 0.7 to 1 |
| NET POSITION TREND: | |||
| – Strength Index Score (3 Year Range Pct): | 6.7 | 92.2 | 63.3 |
| – Strength Index Reading (3 Year Range): | Bearish-Extreme | Bullish-Extreme | Bullish |
| NET POSITION MOVEMENT INDEX: | |||
| – 6-Week Change in Strength Index: | -8.7 | 11.3 | -5.9 |
US Treasury Bonds Futures:
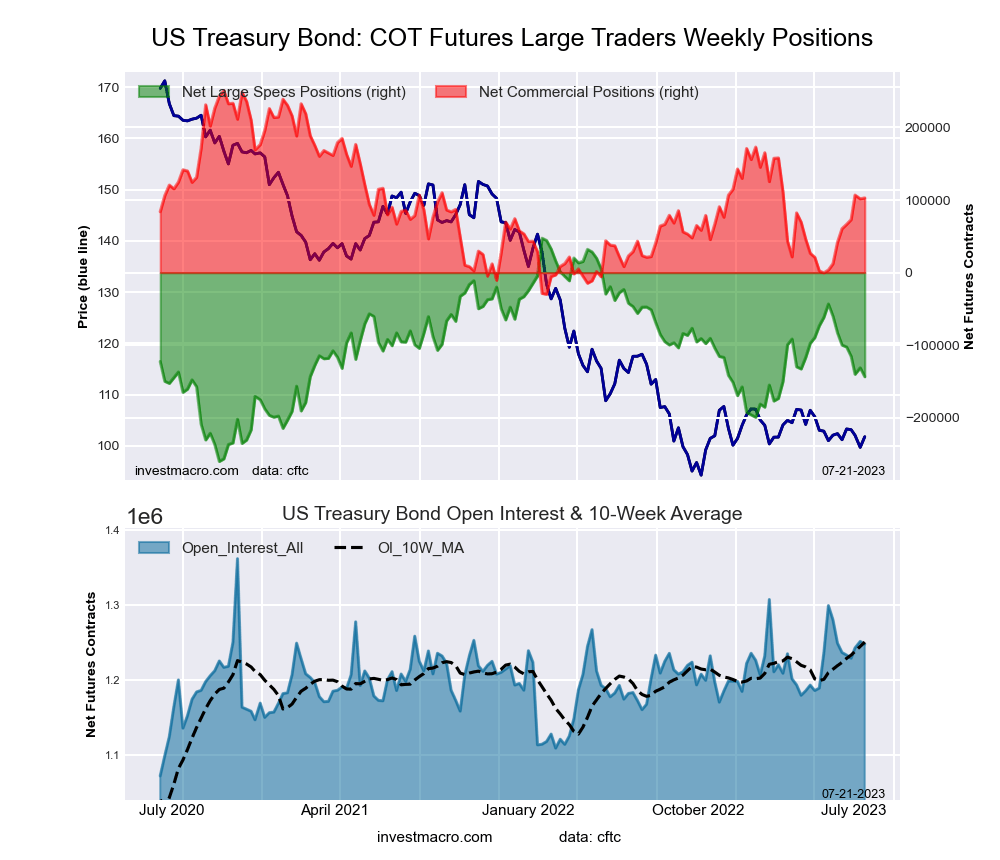 The US Treasury Bonds large speculator standing this week came in at a net position of -143,294 contracts in the data reported through Tuesday. This was a weekly reduction of -12,310 contracts from the previous week which had a total of -130,984 net contracts.
This week’s current strength score (the trader positioning range over the past three years, measured from 0 to 100) shows the speculators are currently Bearish with a score of 38.0 percent. The commercials are Bearish with a score of 47.3 percent and the small traders (not shown in chart) are Bullish with a score of 77.8 percent.
Price Trend-Following Model: Downtrend
Our weekly trend-following model classifies the current market price position as: Downtrend. The current action for the model is considered to be: Hold – Maintain Short Position.
| US Treasury Bonds Statistics | SPECULATORS | COMMERCIALS | SMALL TRADERS |
| – Percent of Open Interest Longs: | 6.3 | 78.4 | 14.5 |
| – Percent of Open Interest Shorts: | 17.8 | 70.2 | 11.3 |
| – Net Position: | -143,294 | 102,899 | 40,395 |
| – Gross Longs: | 79,100 | 978,891 | 181,270 |
| – Gross Shorts: | 222,394 | 875,992 | 140,875 |
| – Long to Short Ratio: | 0.4 to 1 | 1.1 to 1 | 1.3 to 1 |
| NET POSITION TREND: | |||
| – Strength Index Score (3 Year Range Pct): | 38.0 | 47.3 | 77.8 |
| – Strength Index Reading (3 Year Range): | Bearish | Bearish | Bullish |
| NET POSITION MOVEMENT INDEX: | |||
| – 6-Week Change in Strength Index: | -19.6 | 21.8 | -0.5 |
Ultra US Treasury Bonds Futures:
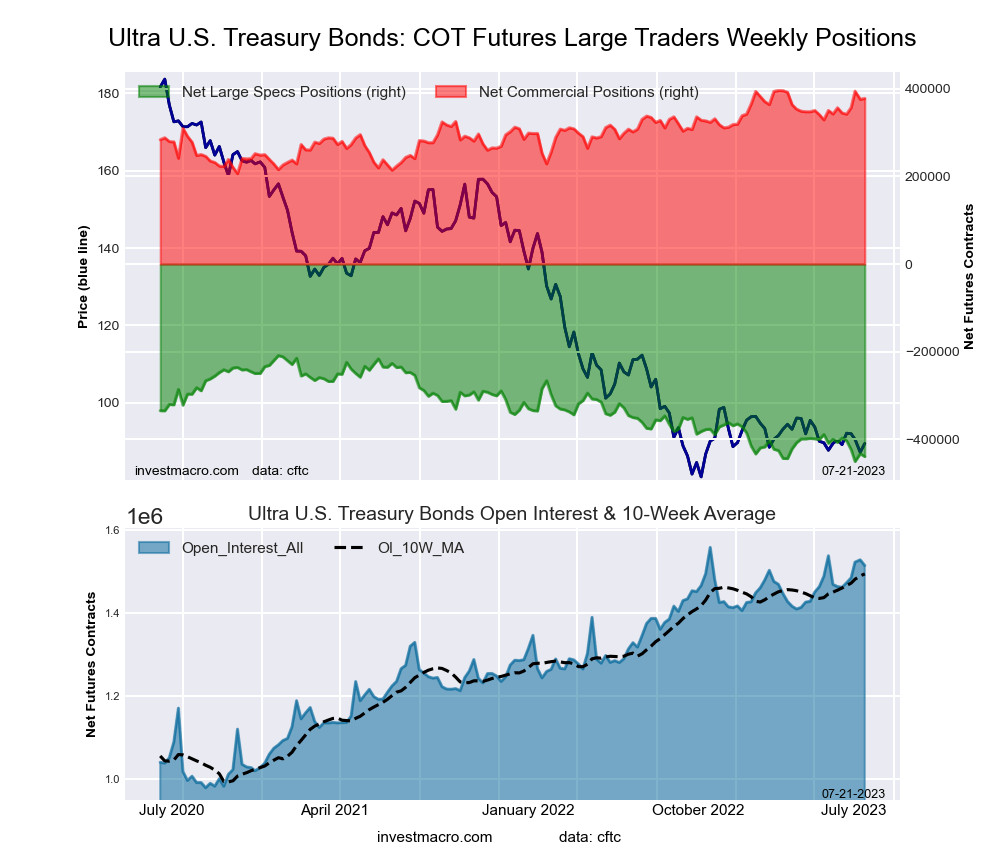 The Ultra US Treasury Bonds large speculator standing this week came in at a net position of -439,397 contracts in the data reported through Tuesday. This was a weekly lowering of -6,485 contracts from the previous week which had a total of -432,912 net contracts.
This week’s current strength score (the trader positioning range over the past three years, measured from 0 to 100) shows the speculators are currently Bearish-Extreme with a score of 4.6 percent. The commercials are Bullish-Extreme with a score of 90.5 percent and the small traders (not shown in chart) are Bullish-Extreme with a score of 95.3 percent.
Price Trend-Following Model: Downtrend
Our weekly trend-following model classifies the current market price position as: Downtrend. The current action for the model is considered to be: Hold – Maintain Short Position.
| Ultra US Treasury Bonds Statistics | SPECULATORS | COMMERCIALS | SMALL TRADERS |
| – Percent of Open Interest Longs: | 5.4 | 82.6 | 11.7 |
| – Percent of Open Interest Shorts: | 34.4 | 57.6 | 7.6 |
| – Net Position: | -439,397 | 377,894 | 61,503 |
| – Gross Longs: | 81,265 | 1,250,311 | 176,653 |
| – Gross Shorts: | 520,662 | 872,417 | 115,150 |
| – Long to Short Ratio: | 0.2 to 1 | 1.4 to 1 | 1.5 to 1 |
| NET POSITION TREND: | |||
| – Strength Index Score (3 Year Range Pct): | 4.6 | 90.5 | 95.3 |
| – Strength Index Reading (3 Year Range): | Bearish-Extreme | Bullish-Extreme | Bullish-Extreme |
| NET POSITION MOVEMENT INDEX: | |||
| – 6-Week Change in Strength Index: | -13.4 | 11.3 | 10.3 |
Article By InvestMacro – Receive our weekly COT Newsletter
*COT Report: The COT data, released weekly to the public each Friday, is updated through the most recent Tuesday (data is 3 days old) and shows a quick view of how large speculators or non-commercials (for-profit traders) were positioned in the futures markets.
The CFTC categorizes trader positions according to commercial hedgers (traders who use futures contracts for hedging as part of the business), non-commercials (large traders who speculate to realize trading profits) and nonreportable traders (usually small traders/speculators) as well as their open interest (contracts open in the market at time of reporting). See CFTC criteria here.

- Oil prices jumped 4% amid a new wave of escalation between the US and Iran Jul 13, 2026
- EUR/USD: US Inflation Will Determine Everything Jul 13, 2026
- COT Metals Charts: Weekly Speculator Bets see small gains for Silver & Gold Jul 12, 2026
- COT Bonds Charts: Speculator Bets led by SOFR 3-Months & 2-Year Bonds Jul 12, 2026
- COT Energy Charts: Weekly Speculator Changes led by Brent Oil Jul 12, 2026
- COT Soft Commodities Charts: Weekly Speculator Changes led by Sugar, Corn & Soybeans Jul 12, 2026
- The US and European stock indices are rising again amid renewed investor interest in the AI industry. Jul 10, 2026
- USD/JPY Falls as Yen Recovers Weekly Losses Jul 10, 2026
- Crude oil prices surged sharply by 7% in reaction to the rapid escalation of the conflict in the Middle East Jul 9, 2026
- Middle East Tensions Weigh on Gold Jul 9, 2026