
By InvestMacro
Here are the latest charts and statistics for the Commitment of Traders (COT) reports data published by the Commodities Futures Trading Commission (CFTC).
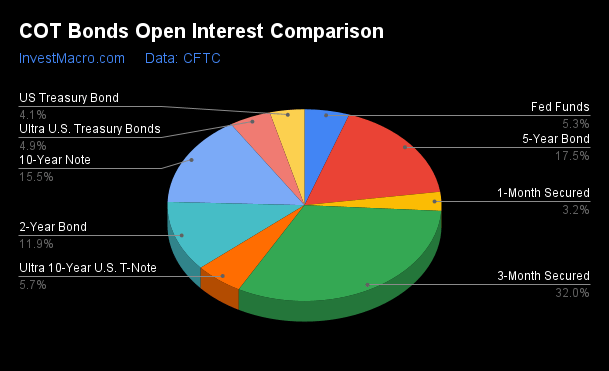
The latest COT data is updated through Tuesday July 25th and shows a quick view of how large traders (for-profit speculators and commercial hedgers) were positioned in the futures markets.
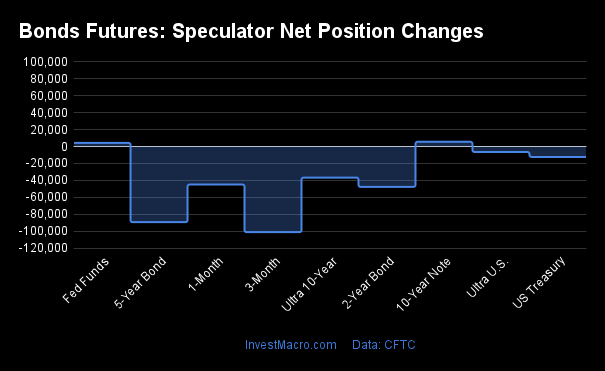
Weekly Speculator Changes led by SOFR 3-Months
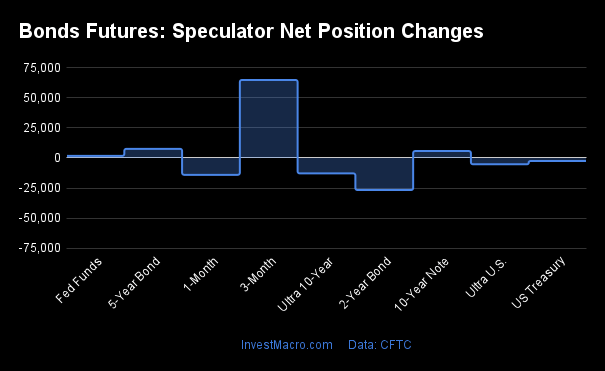
The COT bond market speculator bets were mixed this week as four out of the eight bond markets we cover had higher positioning while the other four markets had lower speculator contracts.
Leading the gains for the bond markets was the SOFR 3-Months (64,957 contracts) with the 5-Year Bonds (7,638 contracts), 10-Year Bonds (5,790 contracts) and the Fed Funds (1,780 contracts) also showing positive weeks.
The bond markets with declines in speculator bets for the week were the 2-Year Bonds (-26,666 contracts), the Ultra 10-Year Bonds (-12,817 contracts), the Ultra Treasury Bonds (-5,228 contracts) and the US Treasury Bonds (-2,550 contracts) also registering lower bets on the week.
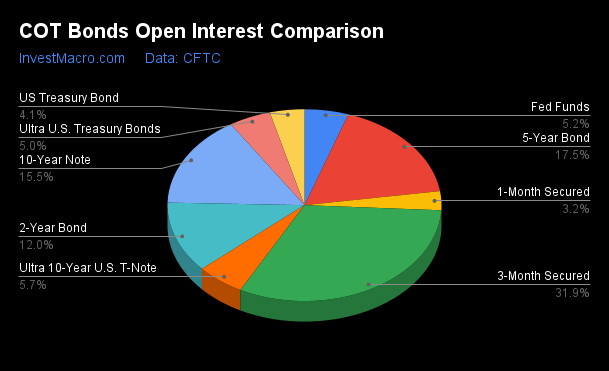
| Jul-25-2023 | OI | OI-Index | Spec-Net | Spec-Index | Com-Net | COM-Index | Smalls-Net | Smalls-Index |
|---|---|---|---|---|---|---|---|---|
| SOFR-3-Months | 9,804,148 | 94 | 143 | 80 | 16,229 | 20 | -16,372 | 79 |
| FedFunds | 1,623,884 | 57 | -158,794 | 29 | 169,354 | 71 | -10,560 | 70 |
| 2-Year | 3,631,663 | 98 | -1,146,046 | 0 | 1,050,948 | 100 | 95,098 | 98 |
| Long T-Bond | 1,254,582 | 59 | -145,844 | 37 | 95,239 | 45 | 50,605 | 85 |
| 10-Year | 4,733,680 | 91 | -623,771 | 22 | 599,836 | 83 | 23,935 | 79 |
| 5-Year | 5,348,725 | 100 | -1,137,851 | 1 | 1,093,090 | 99 | 44,761 | 93 |
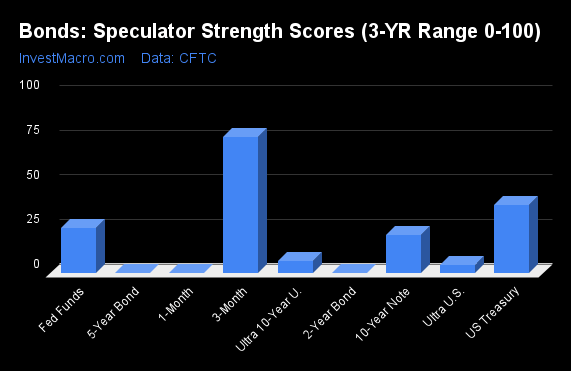
Strength Scores led by SOFR 3-Months & US Treasury Bonds
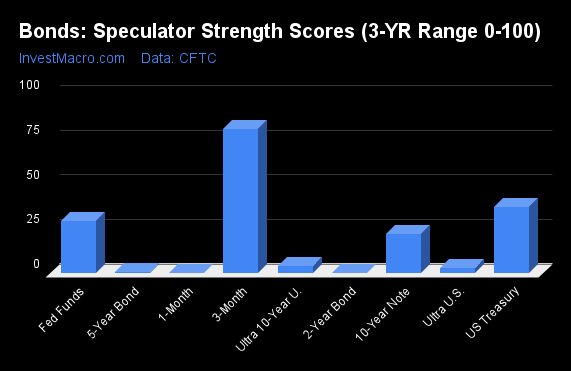
COT Strength Scores (a normalized measure of Speculator positions over a 3-Year range, from 0 to 100 where above 80 is Extreme-Bullish and below 20 is Extreme-Bearish) showed that the SOFR 3-Months (80 percent) and the US Treasury Bonds (37 percent) lead the bond markets this week. The Fed Funds (29 percent) comes in as the next highest in the weekly strength scores.
On the downside, the 2-Year Bonds (0 percent), the 5-Year Bonds (1 percent), the Ultra Treasury Bonds (2 percent) and the Ultra 10-Year Bonds (4 percent) come in at the lowest strength levels currently and are in Extreme-Bearish territory (below 20 percent).
Strength Statistics:
Fed Funds (28.9 percent) vs Fed Funds previous week (28.6 percent)
2-Year Bond (0.0 percent) vs 2-Year Bond previous week (2.2 percent)
5-Year Bond (0.6 percent) vs 5-Year Bond previous week (0.0 percent)
10-Year Bond (22.0 percent) vs 10-Year Bond previous week (21.4 percent)
Ultra 10-Year Bond (4.1 percent) vs Ultra 10-Year Bond previous week (6.7 percent)
US Treasury Bond (37.1 percent) vs US Treasury Bond previous week (38.0 percent)
Ultra US Treasury Bond (2.5 percent) vs Ultra US Treasury Bond previous week (4.6 percent)
SOFR 3-Months (80.4 percent) vs SOFR 3-Months previous week (76.0 percent)
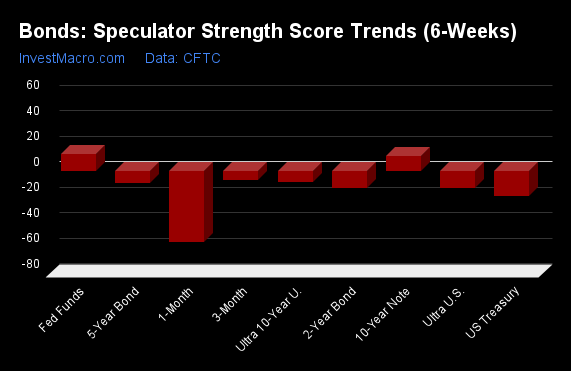
10-Year Bonds & Fed Funds top the 6-Week Strength Trends
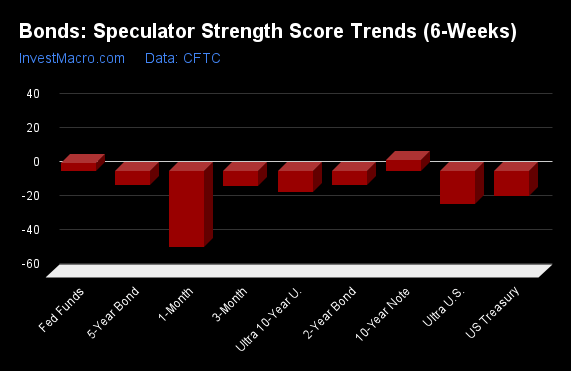
COT Strength Score Trends (or move index, calculates the 6-week changes in strength scores) showed that the 10-Year Bonds (7 percent) and the Fed Funds (5 percent) lead the past six weeks trends for bonds.
The Ultra Treasury Bonds (-20 percent), US Treasury Bonds (-15 percent) and the Ultra 10-Year Bonds (-13 percent) lead the downside trend scores currently with and the SOFR 3-Months (-9 percent) following next with lower trend scores.
Strength Trend Statistics:
Fed Funds (4.9 percent) vs Fed Funds previous week (15.4 percent)
2-Year Bond (-8.1 percent) vs 2-Year Bond previous week (-12.9 percent)
5-Year Bond (-8.3 percent) vs 5-Year Bond previous week (-9.5 percent)
10-Year Bond (6.6 percent) vs 10-Year Bond previous week (12.0 percent)
Ultra 10-Year Bond (-12.5 percent) vs Ultra 10-Year Bond previous week (-8.7 percent)
US Treasury Bond (-15.0 percent) vs US Treasury Bond previous week (-19.6 percent)
Ultra US Treasury Bond (-19.7 percent) vs Ultra US Treasury Bond previous week (-13.4 percent)
SOFR 3-Months (-8.7 percent) vs SOFR 3-Months previous week (-7.2 percent)
Secured Overnight Financing Rate (3-Month) Futures:
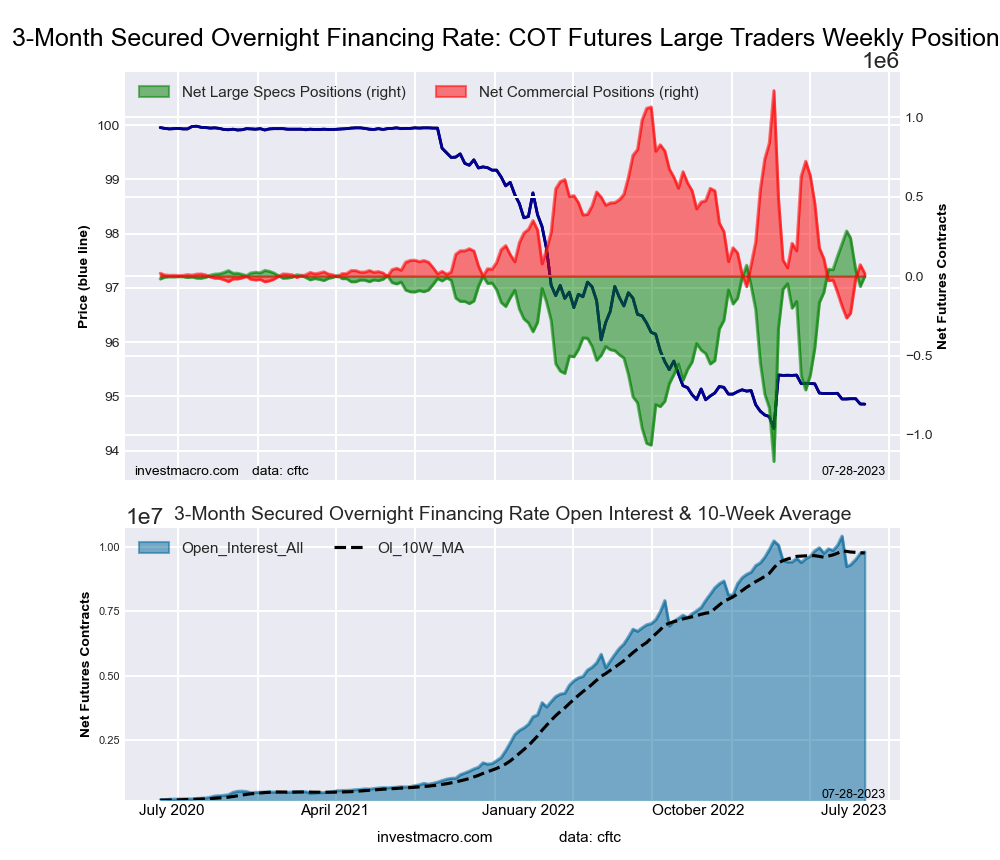 The Secured Overnight Financing Rate (3-Month) large speculator standing this week resulted in a net position of 143 contracts in the data reported through Tuesday. This was a weekly gain of 64,957 contracts from the previous week which had a total of -64,814 net contracts.
This week’s current strength score (the trader positioning range over the past three years, measured from 0 to 100) shows the speculators are currently Bullish-Extreme with a score of 80.4 percent. The commercials are Bearish-Extreme with a score of 19.5 percent and the small traders (not shown in chart) are Bullish with a score of 78.9 percent.
Price Trend-Following Model: Weak Uptrend
Our weekly trend-following model classifies the current market price position as: Weak Uptrend. The current action for the model is considered to be: Hold – Maintain Long Position.
| SOFR 3-Months Statistics | SPECULATORS | COMMERCIALS | SMALL TRADERS |
| – Percent of Open Interest Longs: | 17.8 | 60.0 | 0.3 |
| – Percent of Open Interest Shorts: | 17.8 | 59.9 | 0.5 |
| – Net Position: | 143 | 16,229 | -16,372 |
| – Gross Longs: | 1,745,239 | 5,886,149 | 28,054 |
| – Gross Shorts: | 1,745,096 | 5,869,920 | 44,426 |
| – Long to Short Ratio: | 1.0 to 1 | 1.0 to 1 | 0.6 to 1 |
| NET POSITION TREND: | |||
| – Strength Index Score (3 Year Range Pct): | 80.4 | 19.5 | 78.9 |
| – Strength Index Reading (3 Year Range): | Bullish-Extreme | Bearish-Extreme | Bullish |
| NET POSITION MOVEMENT INDEX: | |||
| – 6-Week Change in Strength Index: | -8.7 | 8.3 | 3.5 |
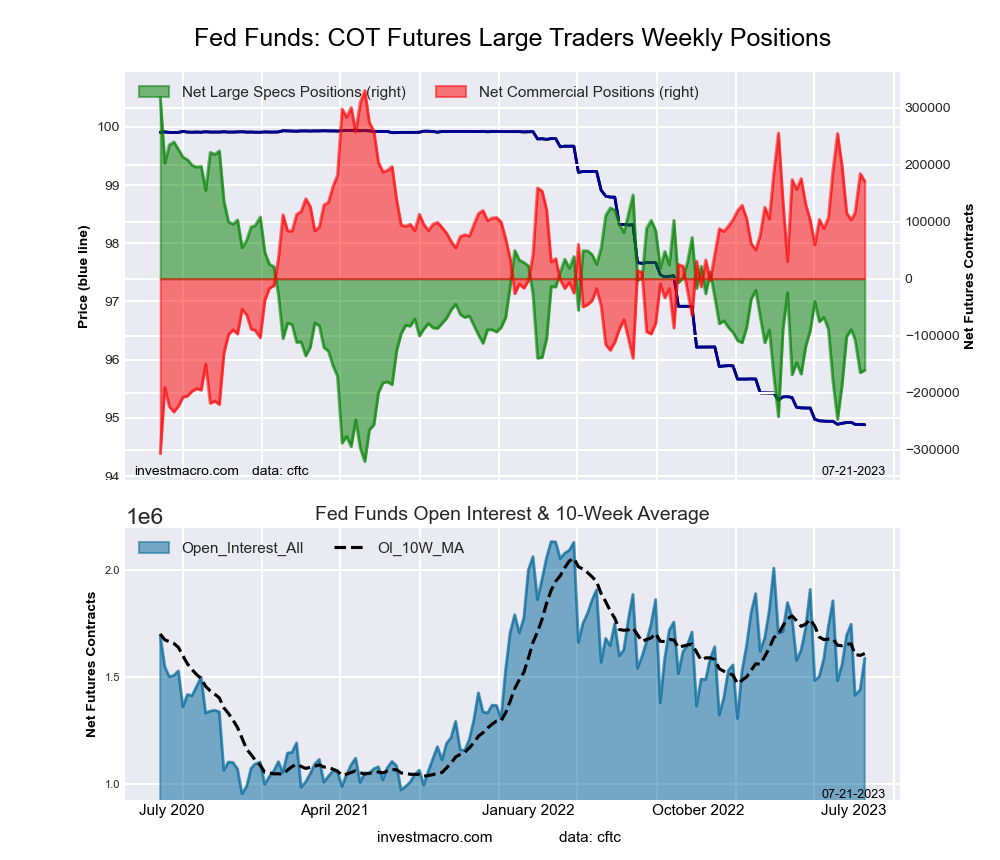
30-Day Federal Funds Futures:
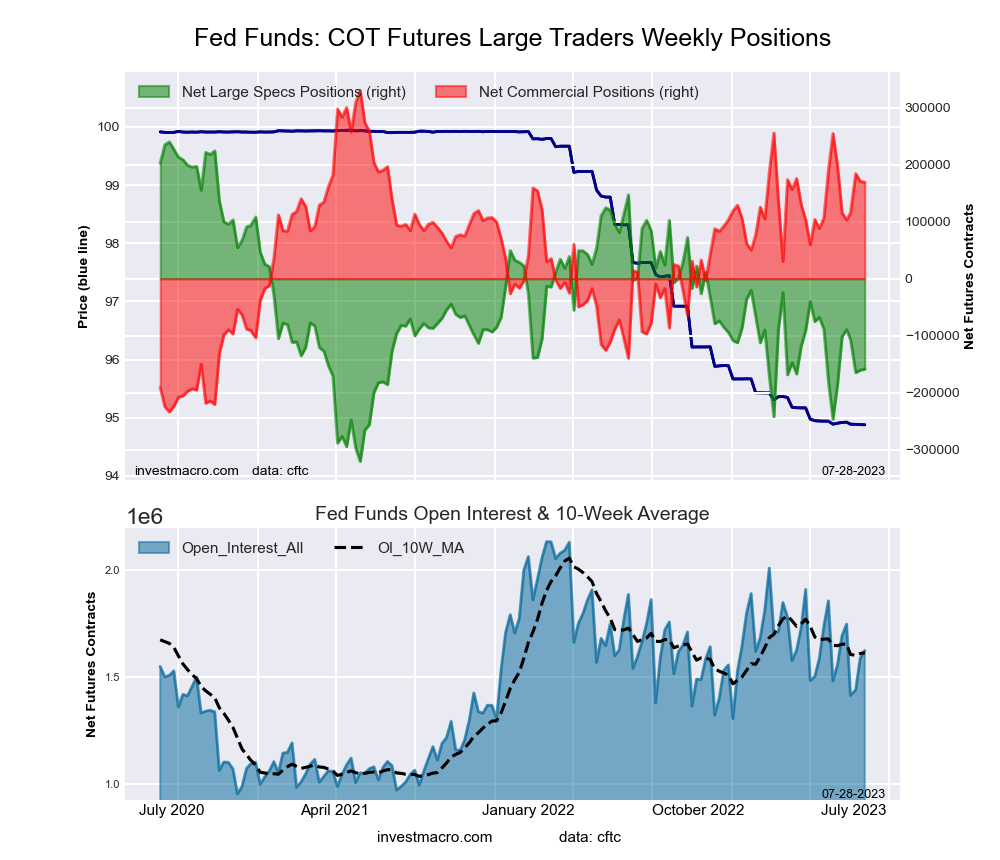 The 30-Day Federal Funds large speculator standing this week resulted in a net position of -158,794 contracts in the data reported through Tuesday. This was a weekly advance of 1,780 contracts from the previous week which had a total of -160,574 net contracts.
This week’s current strength score (the trader positioning range over the past three years, measured from 0 to 100) shows the speculators are currently Bearish with a score of 28.9 percent. The commercials are Bullish with a score of 71.4 percent and the small traders (not shown in chart) are Bullish with a score of 70.3 percent.
Price Trend-Following Model: Downtrend
Our weekly trend-following model classifies the current market price position as: Downtrend. The current action for the model is considered to be: Hold – Maintain Short Position.
| 30-Day Federal Funds Statistics | SPECULATORS | COMMERCIALS | SMALL TRADERS |
| – Percent of Open Interest Longs: | 3.4 | 73.7 | 2.3 |
| – Percent of Open Interest Shorts: | 13.2 | 63.3 | 3.0 |
| – Net Position: | -158,794 | 169,354 | -10,560 |
| – Gross Longs: | 55,995 | 1,197,275 | 37,597 |
| – Gross Shorts: | 214,789 | 1,027,921 | 48,157 |
| – Long to Short Ratio: | 0.3 to 1 | 1.2 to 1 | 0.8 to 1 |
| NET POSITION TREND: | |||
| – Strength Index Score (3 Year Range Pct): | 28.9 | 71.4 | 70.3 |
| – Strength Index Reading (3 Year Range): | Bearish | Bullish | Bullish |
| NET POSITION MOVEMENT INDEX: | |||
| – 6-Week Change in Strength Index: | 4.9 | -5.0 | 1.6 |
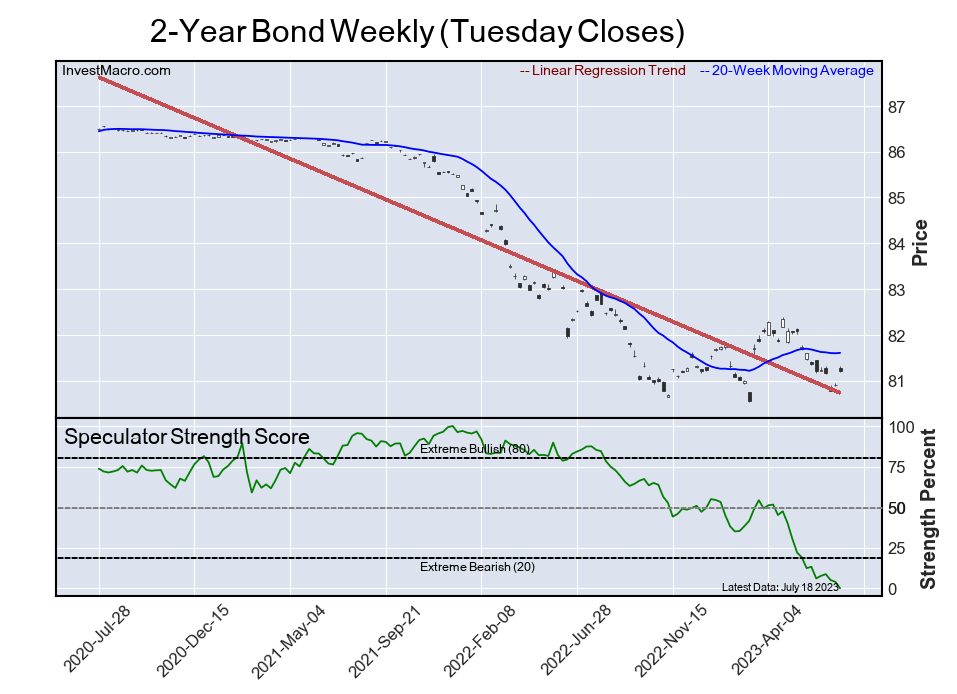
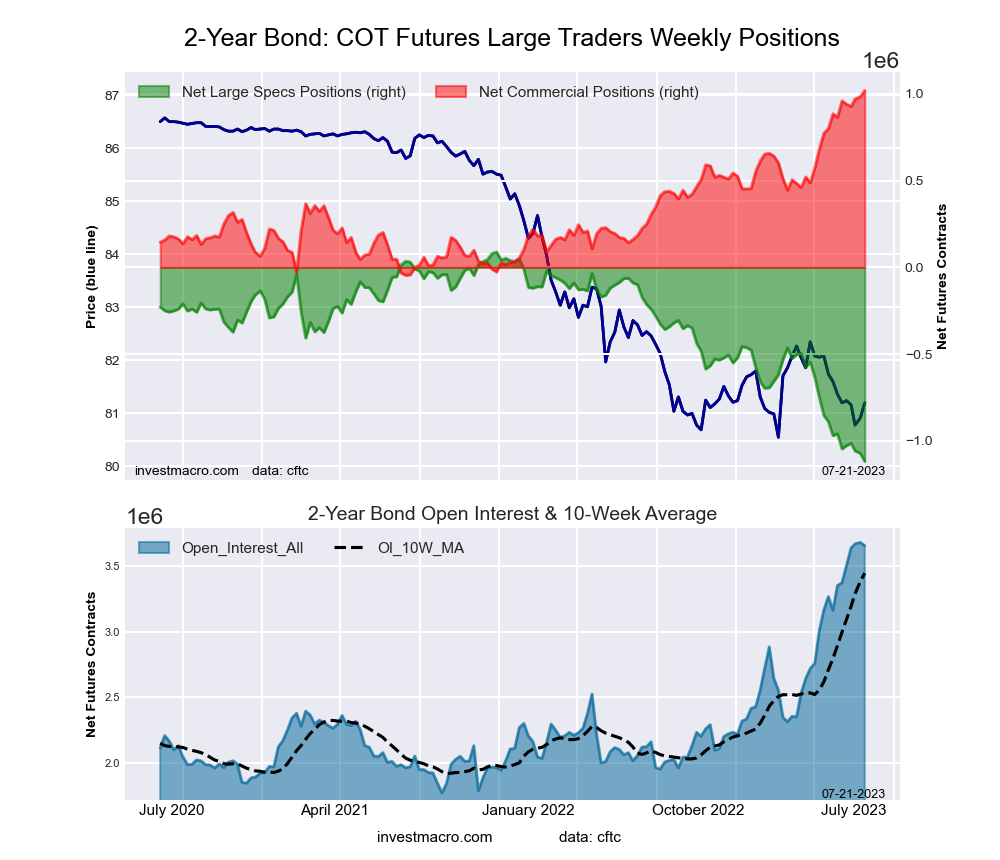
2-Year Treasury Note Futures:
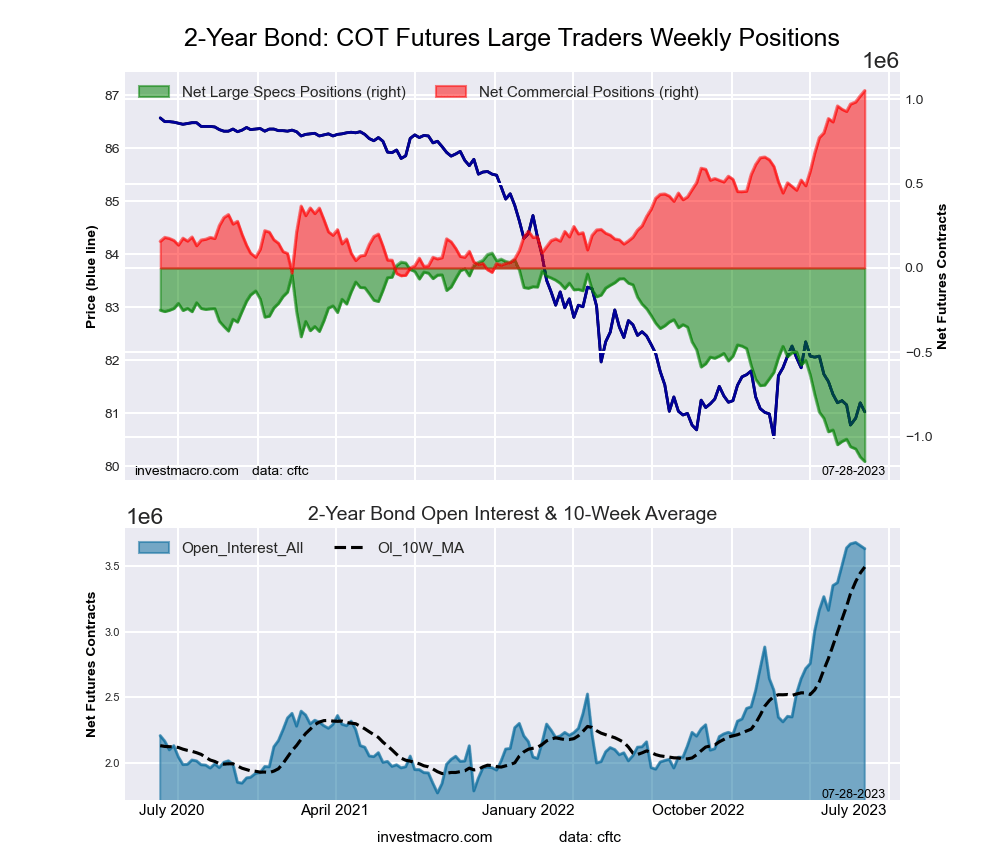 The 2-Year Treasury Note large speculator standing this week resulted in a net position of -1,146,046 contracts in the data reported through Tuesday. This was a weekly fall of -26,666 contracts from the previous week which had a total of -1,119,380 net contracts.
This week’s current strength score (the trader positioning range over the past three years, measured from 0 to 100) shows the speculators are currently Bearish-Extreme with a score of 0.0 percent. The commercials are Bullish-Extreme with a score of 100.0 percent and the small traders (not shown in chart) are Bullish-Extreme with a score of 97.6 percent.
Price Trend-Following Model: Downtrend
Our weekly trend-following model classifies the current market price position as: Downtrend. The current action for the model is considered to be: Hold – Maintain Short Position.
| 2-Year Treasury Note Statistics | SPECULATORS | COMMERCIALS | SMALL TRADERS |
| – Percent of Open Interest Longs: | 9.1 | 82.9 | 6.9 |
| – Percent of Open Interest Shorts: | 40.6 | 53.9 | 4.3 |
| – Net Position: | -1,146,046 | 1,050,948 | 95,098 |
| – Gross Longs: | 329,386 | 3,010,134 | 250,656 |
| – Gross Shorts: | 1,475,432 | 1,959,186 | 155,558 |
| – Long to Short Ratio: | 0.2 to 1 | 1.5 to 1 | 1.6 to 1 |
| NET POSITION TREND: | |||
| – Strength Index Score (3 Year Range Pct): | 0.0 | 100.0 | 97.6 |
| – Strength Index Reading (3 Year Range): | Bearish-Extreme | Bullish-Extreme | Bullish-Extreme |
| NET POSITION MOVEMENT INDEX: | |||
| – 6-Week Change in Strength Index: | -8.1 | 8.3 | 3.8 |
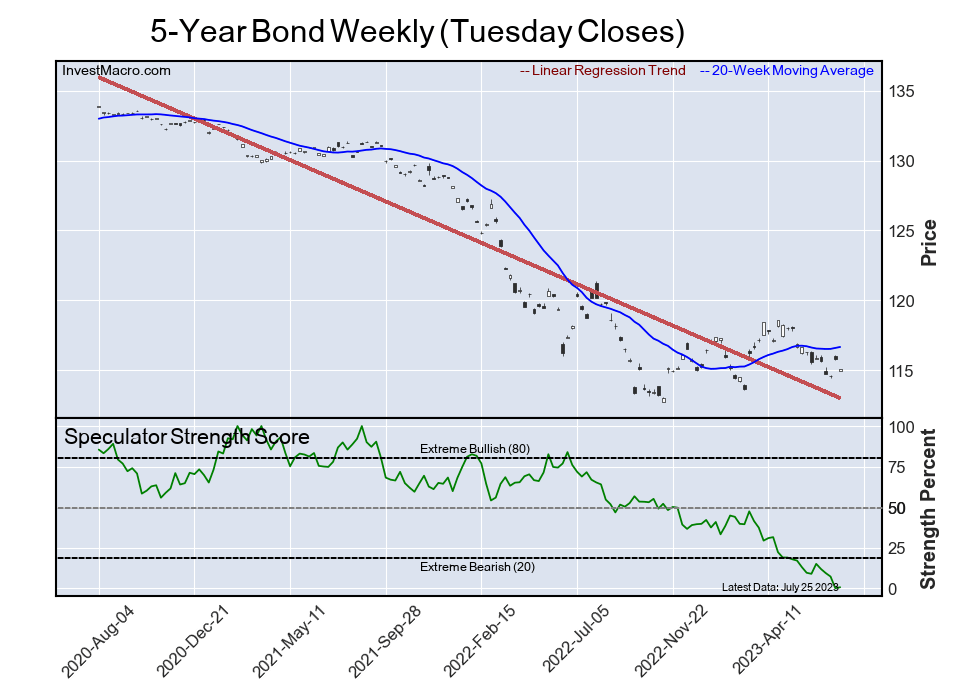
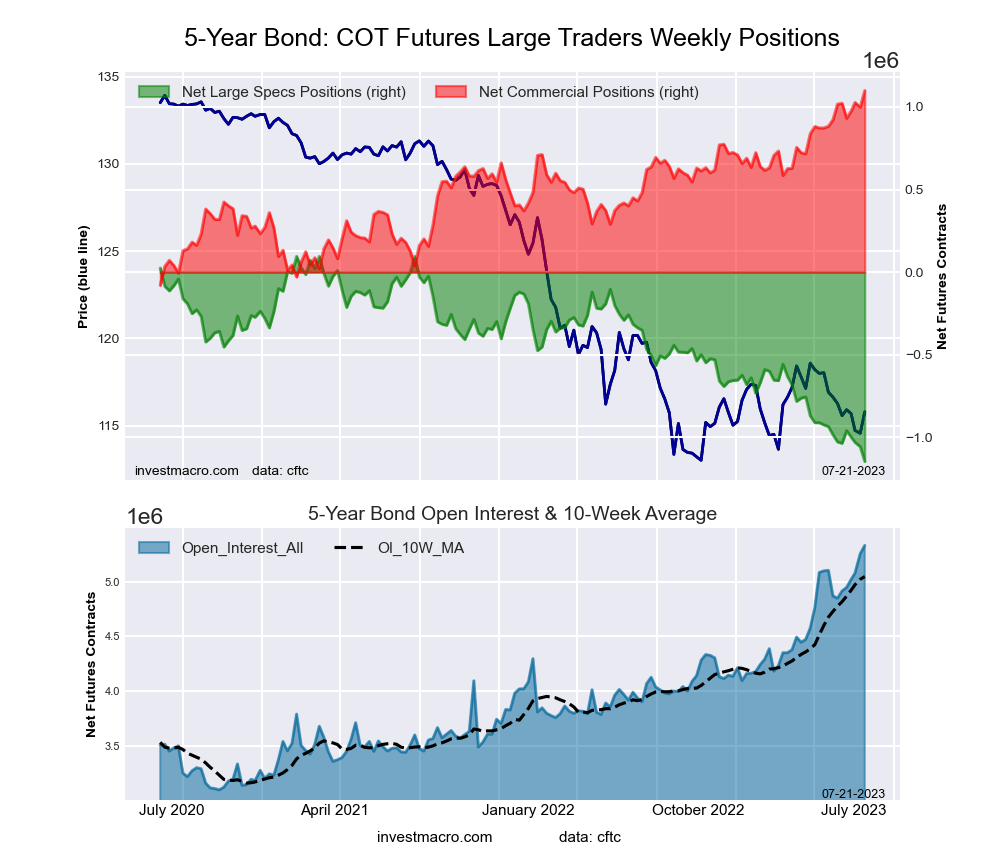
5-Year Treasury Note Futures:
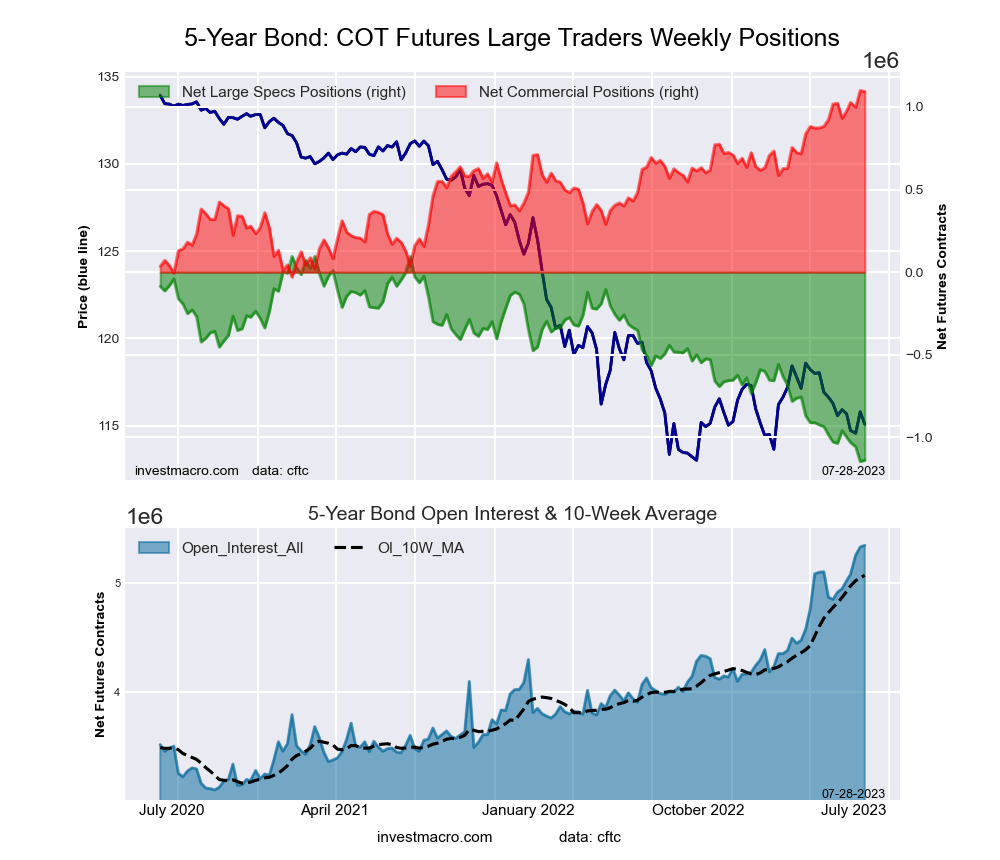 The 5-Year Treasury Note large speculator standing this week resulted in a net position of -1,137,851 contracts in the data reported through Tuesday. This was a weekly lift of 7,638 contracts from the previous week which had a total of -1,145,489 net contracts.
This week’s current strength score (the trader positioning range over the past three years, measured from 0 to 100) shows the speculators are currently Bearish-Extreme with a score of 0.6 percent. The commercials are Bullish-Extreme with a score of 99.5 percent and the small traders (not shown in chart) are Bullish-Extreme with a score of 93.3 percent.
Price Trend-Following Model: Downtrend
Our weekly trend-following model classifies the current market price position as: Downtrend. The current action for the model is considered to be: Hold – Maintain Short Position.
| 5-Year Treasury Note Statistics | SPECULATORS | COMMERCIALS | SMALL TRADERS |
| – Percent of Open Interest Longs: | 6.6 | 85.4 | 7.2 |
| – Percent of Open Interest Shorts: | 27.9 | 65.0 | 6.3 |
| – Net Position: | -1,137,851 | 1,093,090 | 44,761 |
| – Gross Longs: | 352,562 | 4,568,106 | 383,631 |
| – Gross Shorts: | 1,490,413 | 3,475,016 | 338,870 |
| – Long to Short Ratio: | 0.2 to 1 | 1.3 to 1 | 1.1 to 1 |
| NET POSITION TREND: | |||
| – Strength Index Score (3 Year Range Pct): | 0.6 | 99.5 | 93.3 |
| – Strength Index Reading (3 Year Range): | Bearish-Extreme | Bullish-Extreme | Bullish-Extreme |
| NET POSITION MOVEMENT INDEX: | |||
| – 6-Week Change in Strength Index: | -8.3 | 6.3 | 8.6 |
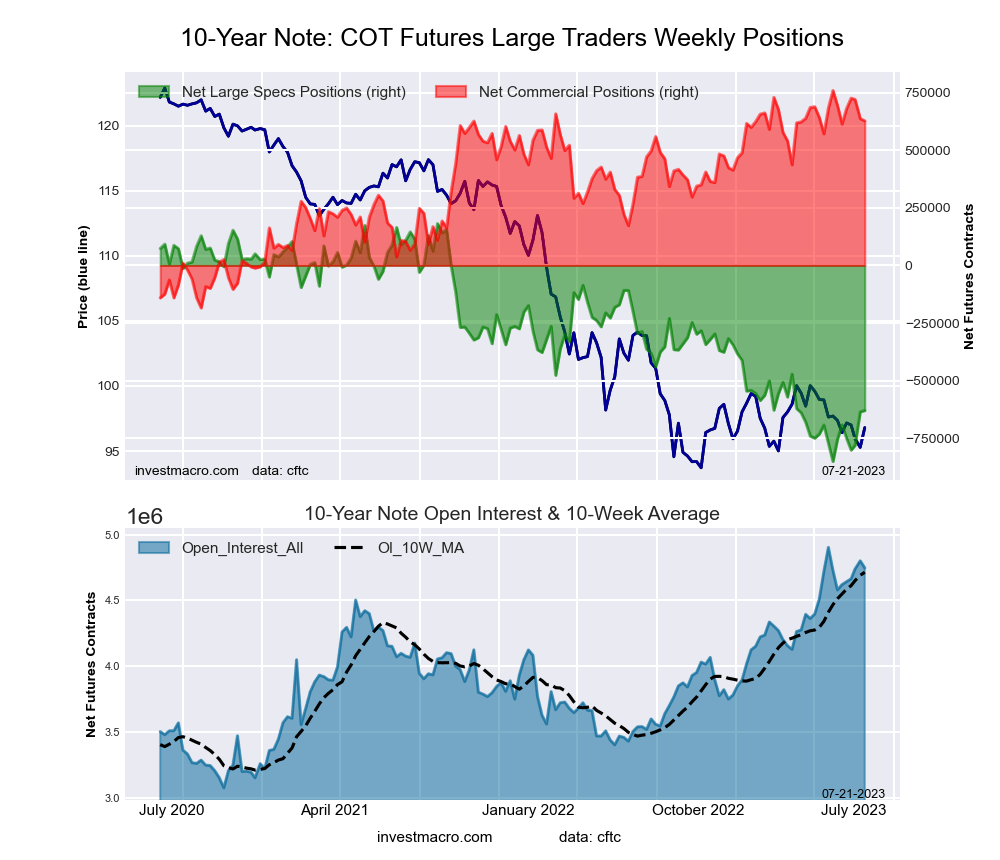
10-Year Treasury Note Futures:
 The 10-Year Treasury Note large speculator standing this week resulted in a net position of -623,771 contracts in the data reported through Tuesday. This was a weekly gain of 5,790 contracts from the previous week which had a total of -629,561 net contracts.
This week’s current strength score (the trader positioning range over the past three years, measured from 0 to 100) shows the speculators are currently Bearish with a score of 22.0 percent. The commercials are Bullish-Extreme with a score of 83.2 percent and the small traders (not shown in chart) are Bullish with a score of 78.7 percent.
Price Trend-Following Model: Downtrend
Our weekly trend-following model classifies the current market price position as: Downtrend. The current action for the model is considered to be: Hold – Maintain Short Position.
| 10-Year Treasury Note Statistics | SPECULATORS | COMMERCIALS | SMALL TRADERS |
| – Percent of Open Interest Longs: | 9.4 | 80.1 | 8.5 |
| – Percent of Open Interest Shorts: | 22.6 | 67.5 | 8.0 |
| – Net Position: | -623,771 | 599,836 | 23,935 |
| – Gross Longs: | 443,907 | 3,792,947 | 402,493 |
| – Gross Shorts: | 1,067,678 | 3,193,111 | 378,558 |
| – Long to Short Ratio: | 0.4 to 1 | 1.2 to 1 | 1.1 to 1 |
| NET POSITION TREND: | |||
| – Strength Index Score (3 Year Range Pct): | 22.0 | 83.2 | 78.7 |
| – Strength Index Reading (3 Year Range): | Bearish | Bullish-Extreme | Bullish |
| NET POSITION MOVEMENT INDEX: | |||
| – 6-Week Change in Strength Index: | 6.6 | -1.5 | -11.8 |
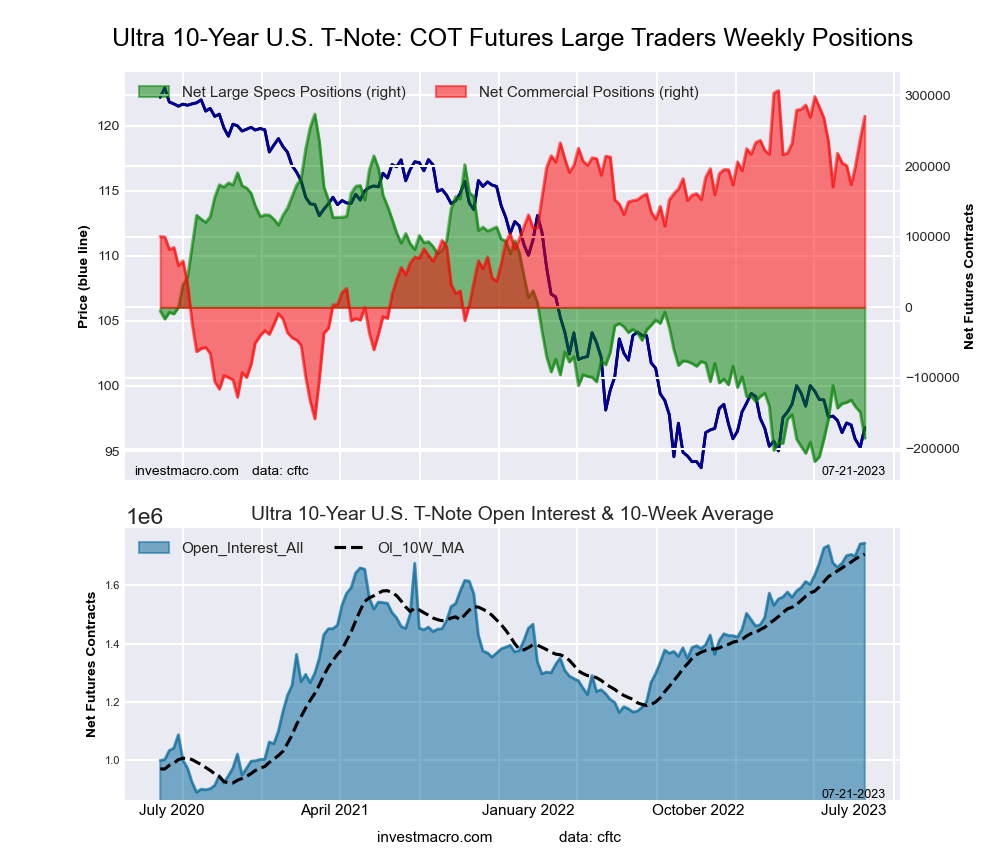
Ultra 10-Year Notes Futures:
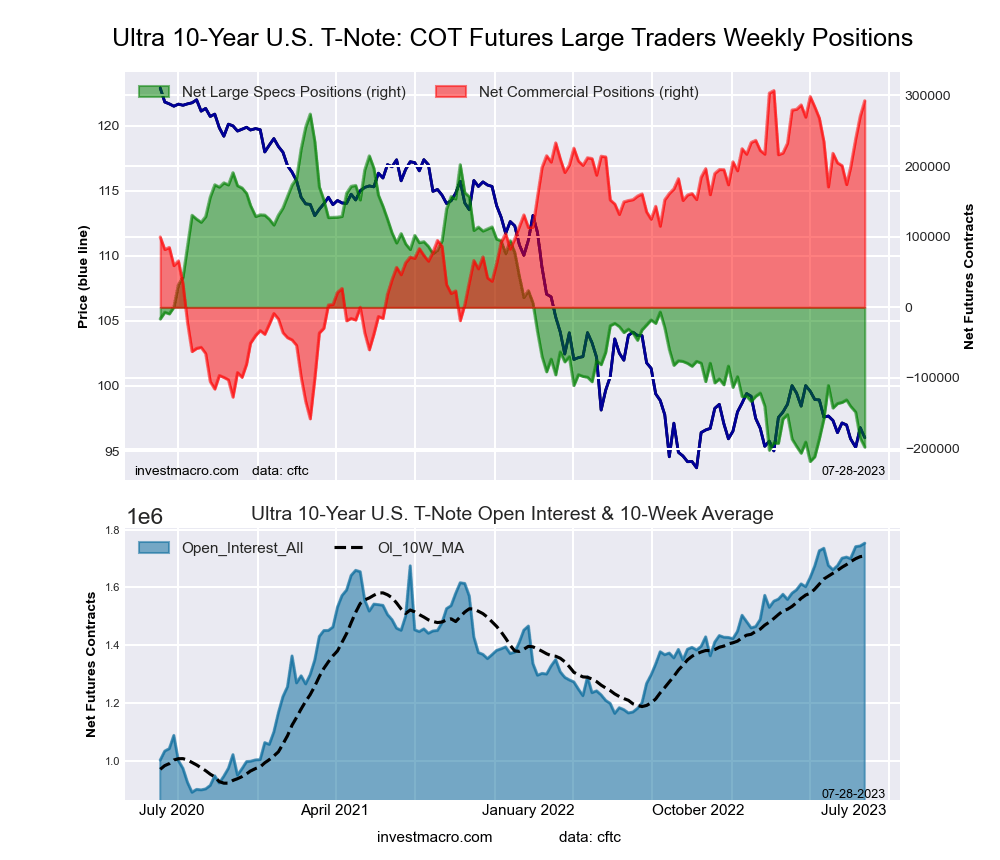 The Ultra 10-Year Notes large speculator standing this week resulted in a net position of -197,984 contracts in the data reported through Tuesday. This was a weekly fall of -12,817 contracts from the previous week which had a total of -185,167 net contracts.
This week’s current strength score (the trader positioning range over the past three years, measured from 0 to 100) shows the speculators are currently Bearish-Extreme with a score of 4.1 percent. The commercials are Bullish-Extreme with a score of 96.9 percent and the small traders (not shown in chart) are Bullish with a score of 57.8 percent.
Price Trend-Following Model: Weak Uptrend
Our weekly trend-following model classifies the current market price position as: Weak Uptrend. The current action for the model is considered to be: Hold – Maintain Long Position.
| Ultra 10-Year Notes Statistics | SPECULATORS | COMMERCIALS | SMALL TRADERS |
| – Percent of Open Interest Longs: | 9.7 | 78.6 | 9.7 |
| – Percent of Open Interest Shorts: | 21.0 | 61.9 | 15.1 |
| – Net Position: | -197,984 | 292,592 | -94,608 |
| – Gross Longs: | 170,280 | 1,378,559 | 169,328 |
| – Gross Shorts: | 368,264 | 1,085,967 | 263,936 |
| – Long to Short Ratio: | 0.5 to 1 | 1.3 to 1 | 0.6 to 1 |
| NET POSITION TREND: | |||
| – Strength Index Score (3 Year Range Pct): | 4.1 | 96.9 | 57.8 |
| – Strength Index Reading (3 Year Range): | Bearish-Extreme | Bullish-Extreme | Bullish |
| NET POSITION MOVEMENT INDEX: | |||
| – 6-Week Change in Strength Index: | -12.5 | 18.9 | -15.6 |
US Treasury Bonds Futures:
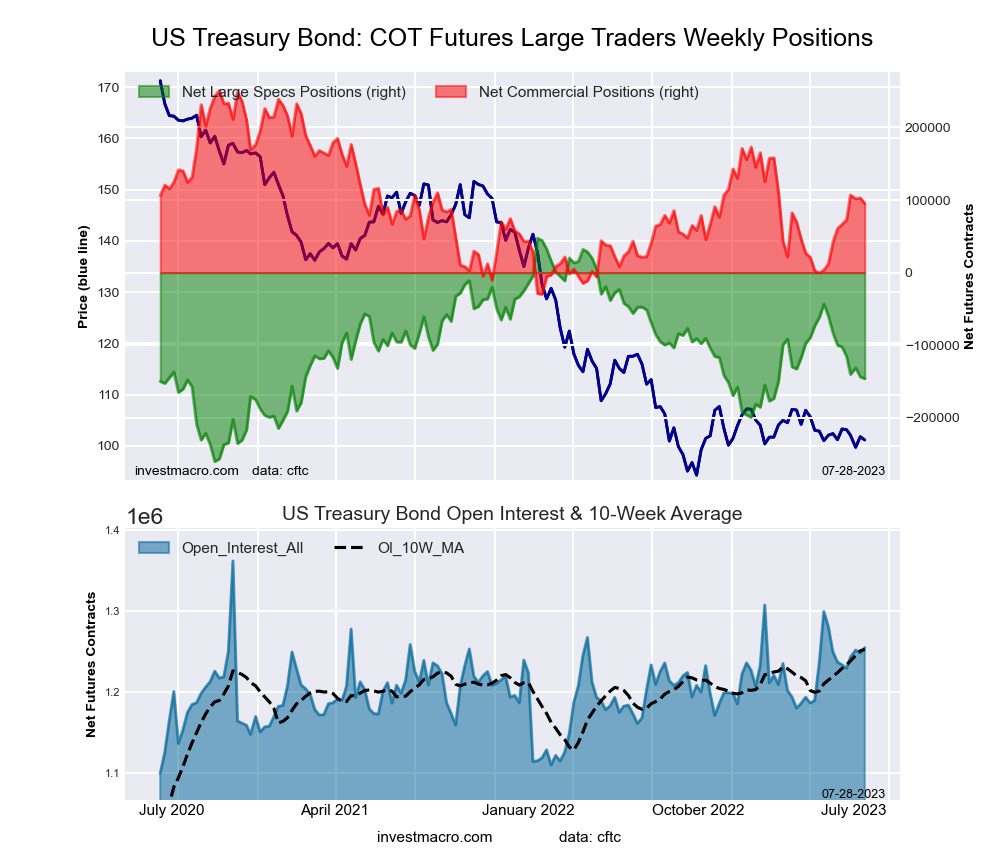 The US Treasury Bonds large speculator standing this week resulted in a net position of -145,844 contracts in the data reported through Tuesday. This was a weekly lowering of -2,550 contracts from the previous week which had a total of -143,294 net contracts.
This week’s current strength score (the trader positioning range over the past three years, measured from 0 to 100) shows the speculators are currently Bearish with a score of 37.1 percent. The commercials are Bearish with a score of 44.6 percent and the small traders (not shown in chart) are Bullish-Extreme with a score of 85.3 percent.
Price Trend-Following Model: Downtrend
Our weekly trend-following model classifies the current market price position as: Downtrend. The current action for the model is considered to be: Hold – Maintain Short Position.
| US Treasury Bonds Statistics | SPECULATORS | COMMERCIALS | SMALL TRADERS |
| – Percent of Open Interest Longs: | 6.4 | 77.9 | 15.0 |
| – Percent of Open Interest Shorts: | 18.0 | 70.3 | 11.0 |
| – Net Position: | -145,844 | 95,239 | 50,605 |
| – Gross Longs: | 80,250 | 976,934 | 188,398 |
| – Gross Shorts: | 226,094 | 881,695 | 137,793 |
| – Long to Short Ratio: | 0.4 to 1 | 1.1 to 1 | 1.4 to 1 |
| NET POSITION TREND: | |||
| – Strength Index Score (3 Year Range Pct): | 37.1 | 44.6 | 85.3 |
| – Strength Index Reading (3 Year Range): | Bearish | Bearish | Bullish-Extreme |
| NET POSITION MOVEMENT INDEX: | |||
| – 6-Week Change in Strength Index: | -15.0 | 12.4 | 8.3 |
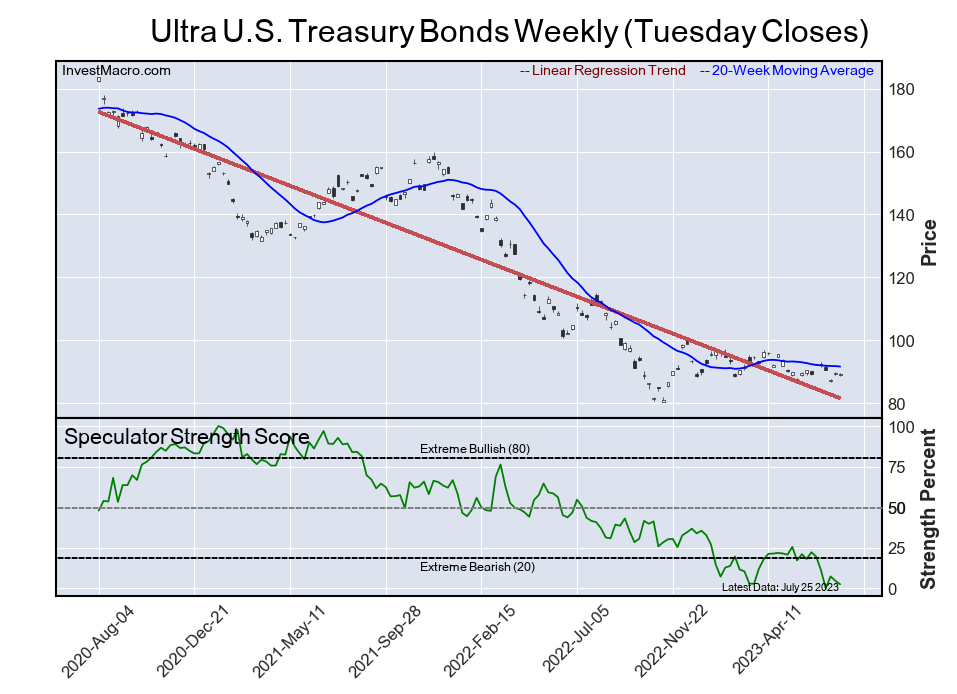
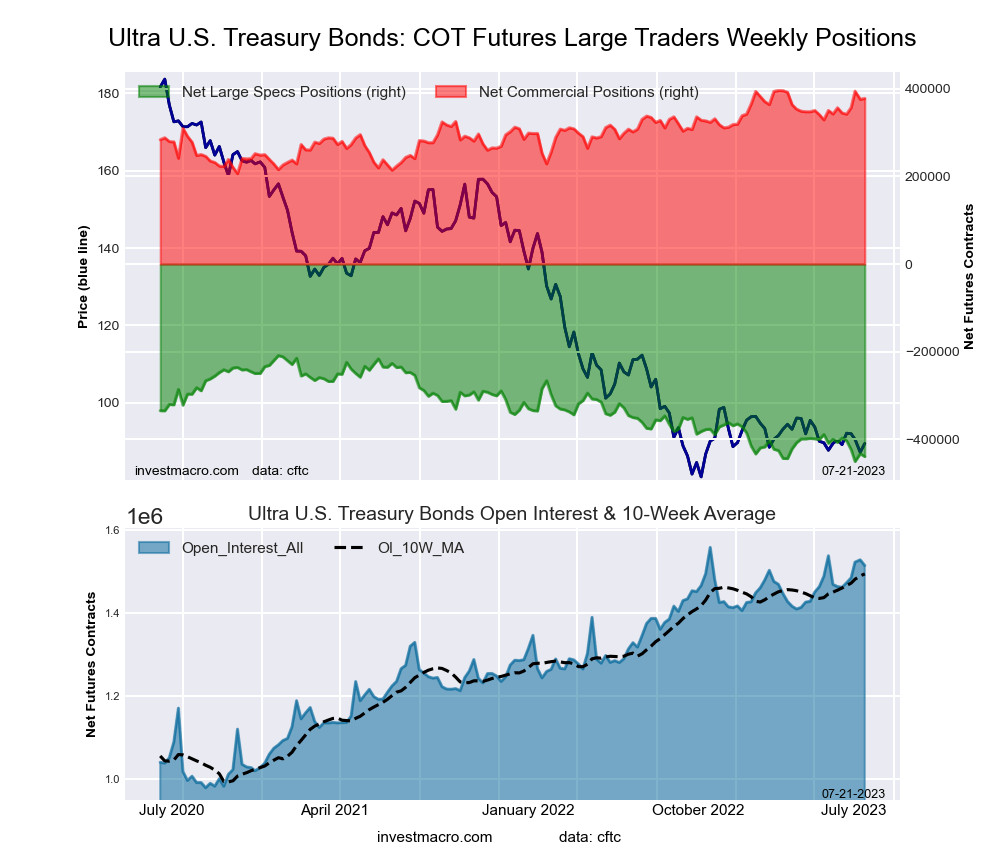
Ultra US Treasury Bonds Futures:
 The Ultra US Treasury Bonds large speculator standing this week resulted in a net position of -444,625 contracts in the data reported through Tuesday. This was a weekly lowering of -5,228 contracts from the previous week which had a total of -439,397 net contracts.
This week’s current strength score (the trader positioning range over the past three years, measured from 0 to 100) shows the speculators are currently Bearish-Extreme with a score of 2.5 percent. The commercials are Bullish-Extreme with a score of 95.6 percent and the small traders (not shown in chart) are Bullish-Extreme with a score of 91.0 percent.
Price Trend-Following Model: Downtrend
Our weekly trend-following model classifies the current market price position as: Downtrend. The current action for the model is considered to be: Hold – Maintain Short Position.
| Ultra US Treasury Bonds Statistics | SPECULATORS | COMMERCIALS | SMALL TRADERS |
| – Percent of Open Interest Longs: | 5.2 | 82.8 | 11.6 |
| – Percent of Open Interest Shorts: | 34.7 | 57.1 | 7.8 |
| – Net Position: | -444,625 | 387,606 | 57,019 |
| – Gross Longs: | 77,764 | 1,247,283 | 175,105 |
| – Gross Shorts: | 522,389 | 859,677 | 118,086 |
| – Long to Short Ratio: | 0.1 to 1 | 1.5 to 1 | 1.5 to 1 |
| NET POSITION TREND: | |||
| – Strength Index Score (3 Year Range Pct): | 2.5 | 95.6 | 91.0 |
| – Strength Index Reading (3 Year Range): | Bearish-Extreme | Bullish-Extreme | Bullish-Extreme |
| NET POSITION MOVEMENT INDEX: | |||
| – 6-Week Change in Strength Index: | -19.7 | 22.6 | 4.5 |
Article By InvestMacro – Receive our weekly COT Newsletter
*COT Report: The COT data, released weekly to the public each Friday, is updated through the most recent Tuesday (data is 3 days old) and shows a quick view of how large speculators or non-commercials (for-profit traders) were positioned in the futures markets.
The CFTC categorizes trader positions according to commercial hedgers (traders who use futures contracts for hedging as part of the business), non-commercials (large traders who speculate to realize trading profits) and nonreportable traders (usually small traders/speculators) as well as their open interest (contracts open in the market at time of reporting). See CFTC criteria here.


