By InvestMacro

Here are the latest charts and statistics for the Commitment of Traders (COT) data published by the Commodities Futures Trading Commission (CFTC).
The latest COT data is updated through Tuesday September 9th and shows a quick view of how large market participants (for-profit speculators and commercial traders) were positioned in the futures markets. All currency positions are in direct relation to the US dollar where, for example, a bet for the euro is a bet that the euro will rise versus the dollar while a bet against the euro will be a bet that the euro will decline versus the dollar.
Weekly Speculator Changes led by Brazilian Real & Japanese Yen

The COT currency market speculator bets were overall higher this week as seven out of the eleven currency markets we cover had higher positioning while the other four markets had lower speculator contracts.
Leading the gains for the currency markets was the Brazilian Real (22,918 contracts) with the Japanese Yen (18,385 contracts), the EuroFX (6,085 contracts), the Australian Dollar (3,452 contracts), the Mexican Peso (719 contracts), Bitcoin (434 contracts) and the Canadian Dollar (59 contracts) also showing positive weeks.
The currencies seeing declines in speculator bets on the week were the Swiss Franc (-2,951 contracts), the New Zealand Dollar (-2,269 contracts), the US Dollar Index (-537 contracts) and with the British Pound (-465 contracts) also registering lower bets on the week.
Large Speculators push Mexican Peso Bets to a 65-week high
Highlighting the currency speculator positions this week is the increasingly bullish Mexican Peso sentiment. Speculators boosted their bullish bets for the Mexican Peso this week for a fourth consecutive week and for the seventh time out of the past eight weeks. The Peso position has now added +23,610 net contracts over these past eight weeks and this bullish momentum has brought the current net standing to a total of +73,732 net bullish contracts.
This marks the highest level for the Mexican Peso contracts in the past 65 weeks, dating back to June 11th of 2024 when the net position was last over +100,000 contracts. The Peso positioning was strong throughout the first half of 2024 with 15 consecutive weeks of contracts over the +100,000 contract level. Peso bets then started to cool off mid-2024 and steadily decreased to an overall negative net position on January 21st of 2025. Since then, contracts have rebounded, improved and increased to this week’s 65-week high.
Despite the increased bullishness for the Peso, the strength score is still just modestly high at 66% of its three-year range. This shows that if bullish momentum continues, there is plenty of room to go before a bullish extreme is reached.
The Mexican Peso position in the exchange markets versus the US dollar has been on an uptrend since the beginning of the year. The Peso has risen through its 200-week moving average and is currently up 13.10% against the US Dollar so far.
Bitcoin leads Price Performance for the Week
The currency market price performance this week was led by Bitcoin, which rose by 4.41% for the past 5 days. Bitcoin is now up by 13% over the last 90 days.
Next was the Australian Dollar, which increased by 1.50% this week. The Australian Dollar is up by 3% over the last 30 days and is higher by 3.74% over the last 90 days. The Mexican Peso came in next with a 1.47% gain and the Peso has risen by 5.57% over the past 90 days.
The New Zealand Dollar advanced by 1.16% over the last five days. The Brazilian Real saw a gain of 0.86% while the Real is now up by approximately 6% in the last 90 days.
The British Pound Sterling came in next with a 0.45% rise, followed by the Swiss Franc, which was higher by 0.26%. The Euro saw prices edge up by just 0.16% and the Canadian Dollar was virtually unchanged with a 0.05% advance.
On the downside, the US Dollar Index was virtually unchanged, down by -0.07%, while the Japanese Yen was just a tick lower with a -0.09% decline.
Currencies Data:

Legend: Open Interest | Speculators Current Net Position | Weekly Specs Change | Specs Strength Score compared to last 3-Years (0-100 range)
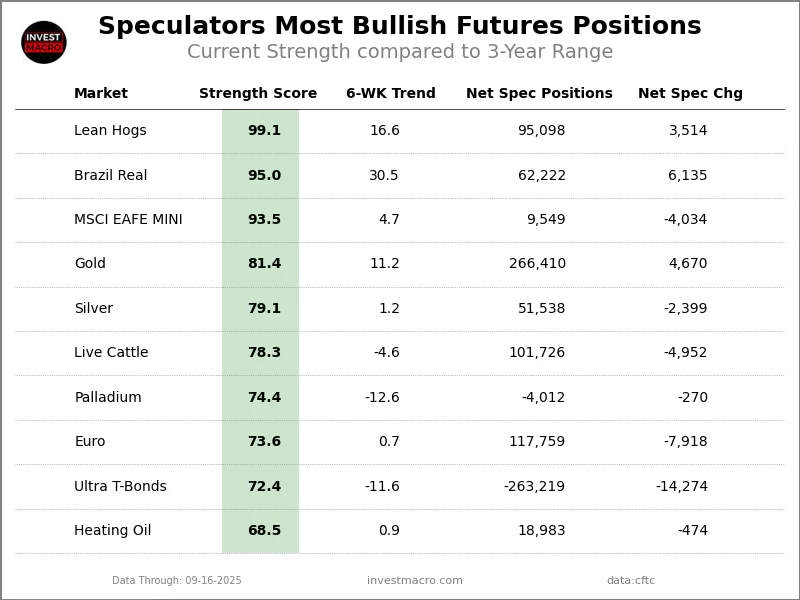
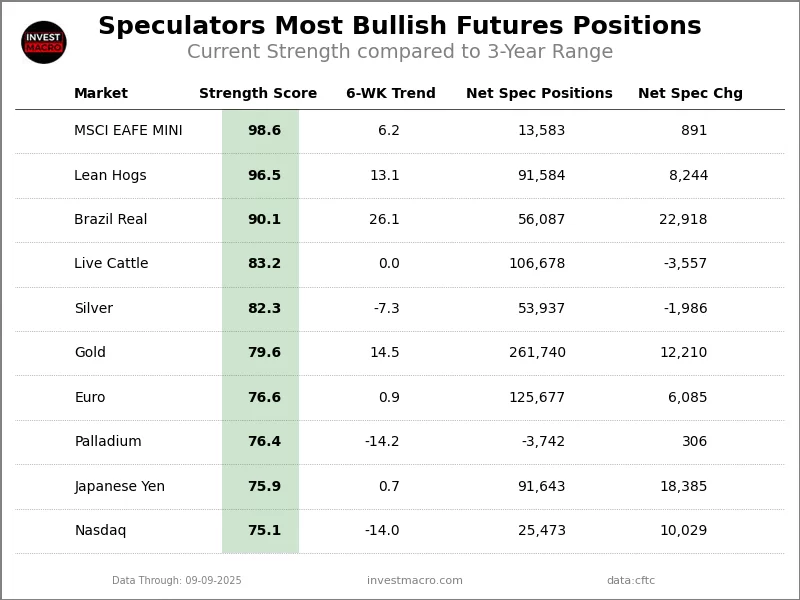
Strength Scores led by Brazilian Real & EuroFX

COT Strength Scores (a normalized measure of Speculator positions over a 3-Year range, from 0 to 100 where above 80 is Extreme-Bullish and below 20 is Extreme-Bearish) showed that the Brazilian Real (90 percent) and the EuroFX (77 percent) lead the currency markets this week. The Japanese Yen (76 percent), Mexican Peso (66 percent) and the New Zealand Dollar (54 percent) come in as the next highest in the weekly strength scores.
On the downside, the US Dollar Index (4 percent) and the British Pound (11 percent) come in at the lowest strength levels currently and are in Extreme-Bearish territory (below 20 percent). The next lowest strength scores are the Australian Dollar (20 percent).
3-Year Strength Statistics:
US Dollar Index (3.7 percent) vs US Dollar Index previous week (5.0 percent)
EuroFX (76.6 percent) vs EuroFX previous week (74.3 percent)
British Pound Sterling (10.8 percent) vs British Pound Sterling previous week (11.0 percent)
Japanese Yen (75.9 percent) vs Japanese Yen previous week (70.8 percent)
Swiss Franc (42.5 percent) vs Swiss Franc previous week (48.4 percent)
Canadian Dollar (43.1 percent) vs Canadian Dollar previous week (43.1 percent)
Australian Dollar (20.1 percent) vs Australian Dollar previous week (17.6 percent)
New Zealand Dollar (54.4 percent) vs New Zealand Dollar previous week (57.0 percent)
Mexican Peso (66.4 percent) vs Mexican Peso previous week (66.0 percent)
Brazilian Real (90.1 percent) vs Brazilian Real previous week (71.5 percent)
Bitcoin (42.8 percent) vs Bitcoin previous week (33.6 percent)
Brazilian Real & Bitcoin top the 6-Week Strength Trends

COT Strength Score Trends (or move index, calculates the 6-week changes in strength scores) showed that the Brazilian Real (26 percent) and Bitcoin (11 percent) lead the past six weeks trends for the currencies. The Mexican Peso (9 percent) was the next highest positive mover in the 3-Year trends data.
The Canadian Dollar (-16 percent) leads the downside trend scores currently with the British Pound (-11 percent), Swiss Franc (-10 percent) and the New Zealand Dollar (-8 percent) following next with lower trend scores.
3-Year Strength Trends:
US Dollar Index (-3.5 percent) vs US Dollar Index previous week (-3.9 percent)
EuroFX (0.9 percent) vs EuroFX previous week (-2.3 percent)
British Pound Sterling (-11.0 percent) vs British Pound Sterling previous week (-17.1 percent)
Japanese Yen (0.7 percent) vs Japanese Yen previous week (-9.2 percent)
Swiss Franc (-9.7 percent) vs Swiss Franc previous week (0.4 percent)
Canadian Dollar (-16.0 percent) vs Canadian Dollar previous week (-19.1 percent)
Australian Dollar (-0.8 percent) vs Australian Dollar previous week (-1.0 percent)
New Zealand Dollar (-7.7 percent) vs New Zealand Dollar previous week (-3.8 percent)
Mexican Peso (8.7 percent) vs Mexican Peso previous week (8.6 percent)
Brazilian Real (26.1 percent) vs Brazilian Real previous week (5.9 percent)
Bitcoin (11.4 percent) vs Bitcoin previous week (20.1 percent)
Individual COT Forex Markets:
US Dollar Index Futures:
 The US Dollar Index large speculator standing this week reached a net position of -5,558 contracts in the data reported through Tuesday. This was a weekly lowering of -537 contracts from the previous week which had a total of -5,021 net contracts.
This week’s current strength score (the trader positioning range over the past three years, measured from 0 to 100) shows the speculators are currently Bearish-Extreme with a score of 3.7 percent. The commercials are Bullish-Extreme with a score of 99.8 percent and the small traders (not shown in chart) are Bearish-Extreme with a score of 15.6 percent.
Price Trend-Following Model: Weak Downtrend
Our weekly trend-following model classifies the current market price position as: Weak Downtrend.
| US DOLLAR INDEX Statistics | SPECULATORS | COMMERCIALS | SMALL TRADERS |
| – Percent of Open Interest Longs: | 50.5 | 34.9 | 6.8 |
| – Percent of Open Interest Shorts: | 65.1 | 17.5 | 9.7 |
| – Net Position: | -5,558 | 6,642 | -1,084 |
| – Gross Longs: | 19,192 | 13,288 | 2,604 |
| – Gross Shorts: | 24,750 | 6,646 | 3,688 |
| – Long to Short Ratio: | 0.8 to 1 | 2.0 to 1 | 0.7 to 1 |
| NET POSITION TREND: | | | |
| – Strength Index Score (3 Year Range Pct): | 3.7 | 99.8 | 15.6 |
| – Strength Index Reading (3 Year Range): | Bearish-Extreme | Bullish-Extreme | Bearish-Extreme |
| NET POSITION MOVEMENT INDEX: | | | |
| – 6-Week Change in Strength Index: | -3.5 | 6.4 | -18.9 |
Euro Currency Futures:
 The Euro Currency large speculator standing this week reached a net position of 125,677 contracts in the data reported through Tuesday. This was a weekly advance of 6,085 contracts from the previous week which had a total of 119,592 net contracts.
This week’s current strength score (the trader positioning range over the past three years, measured from 0 to 100) shows the speculators are currently Bullish with a score of 76.6 percent. The commercials are Bearish-Extreme with a score of 20.0 percent and the small traders (not shown in chart) are Bullish-Extreme with a score of 88.4 percent.
Price Trend-Following Model: Uptrend
Our weekly trend-following model classifies the current market price position as: Uptrend.
| EURO Currency Statistics | SPECULATORS | COMMERCIALS | SMALL TRADERS |
| – Percent of Open Interest Longs: | 29.4 | 53.4 | 11.4 |
| – Percent of Open Interest Shorts: | 15.1 | 73.9 | 5.3 |
| – Net Position: | 125,677 | -179,647 | 53,970 |
| – Gross Longs: | 258,049 | 468,861 | 100,417 |
| – Gross Shorts: | 132,372 | 648,508 | 46,447 |
| – Long to Short Ratio: | 1.9 to 1 | 0.7 to 1 | 2.2 to 1 |
| NET POSITION TREND: | | | |
| – Strength Index Score (3 Year Range Pct): | 76.6 | 20.0 | 88.4 |
| – Strength Index Reading (3 Year Range): | Bullish | Bearish-Extreme | Bullish-Extreme |
| NET POSITION MOVEMENT INDEX: | | | |
| – 6-Week Change in Strength Index: | 0.9 | -1.3 | 3.3 |
British Pound Sterling Futures:
 The British Pound Sterling large speculator standing this week reached a net position of -33,605 contracts in the data reported through Tuesday. This was a weekly reduction of -465 contracts from the previous week which had a total of -33,140 net contracts.
This week’s current strength score (the trader positioning range over the past three years, measured from 0 to 100) shows the speculators are currently Bearish-Extreme with a score of 10.8 percent. The commercials are Bullish with a score of 78.9 percent and the small traders (not shown in chart) are Bullish with a score of 70.2 percent.
Price Trend-Following Model: Strong Uptrend
Our weekly trend-following model classifies the current market price position as: Strong Uptrend.
| BRITISH POUND Statistics | SPECULATORS | COMMERCIALS | SMALL TRADERS |
| – Percent of Open Interest Longs: | 23.2 | 57.1 | 10.4 |
| – Percent of Open Interest Shorts: | 33.6 | 47.9 | 9.2 |
| – Net Position: | -33,605 | 29,784 | 3,821 |
| – Gross Longs: | 74,849 | 184,370 | 33,639 |
| – Gross Shorts: | 108,454 | 154,586 | 29,818 |
| – Long to Short Ratio: | 0.7 to 1 | 1.2 to 1 | 1.1 to 1 |
| NET POSITION TREND: | | | |
| – Strength Index Score (3 Year Range Pct): | 10.8 | 78.9 | 70.2 |
| – Strength Index Reading (3 Year Range): | Bearish-Extreme | Bullish | Bullish |
| NET POSITION MOVEMENT INDEX: | | | |
| – 6-Week Change in Strength Index: | -11.0 | 7.1 | 10.8 |
Japanese Yen Futures:
 The Japanese Yen large speculator standing this week reached a net position of 91,643 contracts in the data reported through Tuesday. This was a weekly increase of 18,385 contracts from the previous week which had a total of 73,258 net contracts.
This week’s current strength score (the trader positioning range over the past three years, measured from 0 to 100) shows the speculators are currently Bullish with a score of 75.9 percent. The commercials are Bearish with a score of 25.6 percent and the small traders (not shown in chart) are Bullish with a score of 63.2 percent.
Price Trend-Following Model: Downtrend
Our weekly trend-following model classifies the current market price position as: Downtrend.
| JAPANESE YEN Statistics | SPECULATORS | COMMERCIALS | SMALL TRADERS |
| – Percent of Open Interest Longs: | 44.0 | 38.4 | 10.6 |
| – Percent of Open Interest Shorts: | 21.7 | 62.9 | 8.5 |
| – Net Position: | 91,643 | -100,442 | 8,799 |
| – Gross Longs: | 180,724 | 157,854 | 43,537 |
| – Gross Shorts: | 89,081 | 258,296 | 34,738 |
| – Long to Short Ratio: | 2.0 to 1 | 0.6 to 1 | 1.3 to 1 |
| NET POSITION TREND: | | | |
| – Strength Index Score (3 Year Range Pct): | 75.9 | 25.6 | 63.2 |
| – Strength Index Reading (3 Year Range): | Bullish | Bearish | Bullish |
| NET POSITION MOVEMENT INDEX: | | | |
| – 6-Week Change in Strength Index: | 0.7 | -2.0 | 12.9 |
Swiss Franc Futures:
 The Swiss Franc large speculator standing this week reached a net position of -28,839 contracts in the data reported through Tuesday. This was a weekly fall of -2,951 contracts from the previous week which had a total of -25,888 net contracts.
This week’s current strength score (the trader positioning range over the past three years, measured from 0 to 100) shows the speculators are currently Bearish with a score of 42.5 percent. The commercials are Bearish with a score of 49.7 percent and the small traders (not shown in chart) are Bullish with a score of 70.4 percent.
Price Trend-Following Model: Uptrend
Our weekly trend-following model classifies the current market price position as: Uptrend.
| SWISS FRANC Statistics | SPECULATORS | COMMERCIALS | SMALL TRADERS |
| – Percent of Open Interest Longs: | 6.6 | 74.1 | 16.5 |
| – Percent of Open Interest Shorts: | 34.1 | 44.8 | 18.4 |
| – Net Position: | -28,839 | 30,815 | -1,976 |
| – Gross Longs: | 6,989 | 77,874 | 17,332 |
| – Gross Shorts: | 35,828 | 47,059 | 19,308 |
| – Long to Short Ratio: | 0.2 to 1 | 1.7 to 1 | 0.9 to 1 |
| NET POSITION TREND: | | | |
| – Strength Index Score (3 Year Range Pct): | 42.5 | 49.7 | 70.4 |
| – Strength Index Reading (3 Year Range): | Bearish | Bearish | Bullish |
| NET POSITION MOVEMENT INDEX: | | | |
| – 6-Week Change in Strength Index: | -9.7 | 4.1 | 9.7 |
Canadian Dollar Futures:
 The Canadian Dollar large speculator standing this week reached a net position of -108,917 contracts in the data reported through Tuesday. This was a weekly advance of 59 contracts from the previous week which had a total of -108,976 net contracts.
This week’s current strength score (the trader positioning range over the past three years, measured from 0 to 100) shows the speculators are currently Bearish with a score of 43.1 percent. The commercials are Bullish with a score of 60.9 percent and the small traders (not shown in chart) are Bearish with a score of 26.5 percent.
Price Trend-Following Model: Weak Uptrend
Our weekly trend-following model classifies the current market price position as: Weak Uptrend.
| CANADIAN DOLLAR Statistics | SPECULATORS | COMMERCIALS | SMALL TRADERS |
| – Percent of Open Interest Longs: | 7.5 | 77.2 | 10.1 |
| – Percent of Open Interest Shorts: | 51.2 | 31.1 | 12.6 |
| – Net Position: | -108,917 | 115,041 | -6,124 |
| – Gross Longs: | 18,704 | 192,465 | 25,216 |
| – Gross Shorts: | 127,621 | 77,424 | 31,340 |
| – Long to Short Ratio: | 0.1 to 1 | 2.5 to 1 | 0.8 to 1 |
| NET POSITION TREND: | | | |
| – Strength Index Score (3 Year Range Pct): | 43.1 | 60.9 | 26.5 |
| – Strength Index Reading (3 Year Range): | Bearish | Bullish | Bearish |
| NET POSITION MOVEMENT INDEX: | | | |
| – 6-Week Change in Strength Index: | -16.0 | 16.6 | -15.1 |
Australian Dollar Futures:
 The Australian Dollar large speculator standing this week reached a net position of -79,231 contracts in the data reported through Tuesday. This was a weekly advance of 3,452 contracts from the previous week which had a total of -82,683 net contracts.
This week’s current strength score (the trader positioning range over the past three years, measured from 0 to 100) shows the speculators are currently Bearish with a score of 20.1 percent. The commercials are Bullish with a score of 73.6 percent and the small traders (not shown in chart) are Bullish with a score of 64.9 percent.
Price Trend-Following Model: Strong Uptrend
Our weekly trend-following model classifies the current market price position as: Strong Uptrend.
| AUSTRALIAN DOLLAR Statistics | SPECULATORS | COMMERCIALS | SMALL TRADERS |
| – Percent of Open Interest Longs: | 15.5 | 67.8 | 12.1 |
| – Percent of Open Interest Shorts: | 53.5 | 32.6 | 9.2 |
| – Net Position: | -79,231 | 73,221 | 6,010 |
| – Gross Longs: | 32,200 | 141,051 | 25,129 |
| – Gross Shorts: | 111,431 | 67,830 | 19,119 |
| – Long to Short Ratio: | 0.3 to 1 | 2.1 to 1 | 1.3 to 1 |
| NET POSITION TREND: | | | |
| – Strength Index Score (3 Year Range Pct): | 20.1 | 73.6 | 64.9 |
| – Strength Index Reading (3 Year Range): | Bearish | Bullish | Bullish |
| NET POSITION MOVEMENT INDEX: | | | |
| – 6-Week Change in Strength Index: | -0.8 | -1.1 | 7.8 |
New Zealand Dollar Futures:
 The New Zealand Dollar large speculator standing this week reached a net position of -8,743 contracts in the data reported through Tuesday. This was a weekly lowering of -2,269 contracts from the previous week which had a total of -6,474 net contracts.
This week’s current strength score (the trader positioning range over the past three years, measured from 0 to 100) shows the speculators are currently Bullish with a score of 54.4 percent. The commercials are Bearish with a score of 46.3 percent and the small traders (not shown in chart) are Bearish with a score of 26.8 percent.
Price Trend-Following Model: Downtrend
Our weekly trend-following model classifies the current market price position as: Downtrend.
| NEW ZEALAND DOLLAR Statistics | SPECULATORS | COMMERCIALS | SMALL TRADERS |
| – Percent of Open Interest Longs: | 21.6 | 53.2 | 5.1 |
| – Percent of Open Interest Shorts: | 33.8 | 38.0 | 8.0 |
| – Net Position: | -8,743 | 10,841 | -2,098 |
| – Gross Longs: | 15,479 | 38,065 | 3,637 |
| – Gross Shorts: | 24,222 | 27,224 | 5,735 |
| – Long to Short Ratio: | 0.6 to 1 | 1.4 to 1 | 0.6 to 1 |
| NET POSITION TREND: | | | |
| – Strength Index Score (3 Year Range Pct): | 54.4 | 46.3 | 26.8 |
| – Strength Index Reading (3 Year Range): | Bullish | Bearish | Bearish |
| NET POSITION MOVEMENT INDEX: | | | |
| – 6-Week Change in Strength Index: | -7.7 | 10.9 | -38.5 |
Mexican Peso Futures:
 The Mexican Peso large speculator standing this week reached a net position of 73,732 contracts in the data reported through Tuesday. This was a weekly gain of 719 contracts from the previous week which had a total of 73,013 net contracts.
This week’s current strength score (the trader positioning range over the past three years, measured from 0 to 100) shows the speculators are currently Bullish with a score of 66.4 percent. The commercials are Bearish with a score of 34.4 percent and the small traders (not shown in chart) are Bearish with a score of 43.8 percent.
Price Trend-Following Model: Uptrend
Our weekly trend-following model classifies the current market price position as: Uptrend.
| MEXICAN PESO Statistics | SPECULATORS | COMMERCIALS | SMALL TRADERS |
| – Percent of Open Interest Longs: | 50.4 | 41.7 | 3.3 |
| – Percent of Open Interest Shorts: | 15.8 | 78.1 | 1.5 |
| – Net Position: | 73,732 | -77,535 | 3,803 |
| – Gross Longs: | 107,503 | 89,064 | 7,051 |
| – Gross Shorts: | 33,771 | 166,599 | 3,248 |
| – Long to Short Ratio: | 3.2 to 1 | 0.5 to 1 | 2.2 to 1 |
| NET POSITION TREND: | | | |
| – Strength Index Score (3 Year Range Pct): | 66.4 | 34.4 | 43.8 |
| – Strength Index Reading (3 Year Range): | Bullish | Bearish | Bearish |
| NET POSITION MOVEMENT INDEX: | | | |
| – 6-Week Change in Strength Index: | 8.7 | -9.0 | 2.1 |
Brazilian Real Futures:
 The Brazilian Real large speculator standing this week reached a net position of 56,087 contracts in the data reported through Tuesday. This was a weekly boost of 22,918 contracts from the previous week which had a total of 33,169 net contracts.
This week’s current strength score (the trader positioning range over the past three years, measured from 0 to 100) shows the speculators are currently Bullish-Extreme with a score of 90.1 percent. The commercials are Bearish-Extreme with a score of 8.4 percent and the small traders (not shown in chart) are Bearish with a score of 43.5 percent.
Price Trend-Following Model: Strong Uptrend
Our weekly trend-following model classifies the current market price position as: Strong Uptrend.
| BRAZIL REAL Statistics | SPECULATORS | COMMERCIALS | SMALL TRADERS |
| – Percent of Open Interest Longs: | 62.9 | 32.0 | 4.5 |
| – Percent of Open Interest Shorts: | 10.7 | 87.9 | 0.8 |
| – Net Position: | 56,087 | -60,098 | 4,011 |
| – Gross Longs: | 67,641 | 34,405 | 4,856 |
| – Gross Shorts: | 11,554 | 94,503 | 845 |
| – Long to Short Ratio: | 5.9 to 1 | 0.4 to 1 | 5.7 to 1 |
| NET POSITION TREND: | | | |
| – Strength Index Score (3 Year Range Pct): | 90.1 | 8.4 | 43.5 |
| – Strength Index Reading (3 Year Range): | Bullish-Extreme | Bearish-Extreme | Bearish |
| NET POSITION MOVEMENT INDEX: | | | |
| – 6-Week Change in Strength Index: | 26.1 | -26.5 | 5.4 |
Bitcoin Futures:
 The Bitcoin large speculator standing this week reached a net position of -468 contracts in the data reported through Tuesday. This was a weekly advance of 434 contracts from the previous week which had a total of -902 net contracts.
This week’s current strength score (the trader positioning range over the past three years, measured from 0 to 100) shows the speculators are currently Bearish with a score of 42.8 percent. The commercials are Bullish with a score of 57.9 percent and the small traders (not shown in chart) are Bullish with a score of 58.7 percent.
Price Trend-Following Model: Uptrend
Our weekly trend-following model classifies the current market price position as: Uptrend.
| BITCOIN Statistics | SPECULATORS | COMMERCIALS | SMALL TRADERS |
| – Percent of Open Interest Longs: | 85.7 | 4.0 | 4.7 |
| – Percent of Open Interest Shorts: | 87.4 | 3.8 | 3.2 |
| – Net Position: | -468 | 56 | 412 |
| – Gross Longs: | 23,075 | 1,081 | 1,263 |
| – Gross Shorts: | 23,543 | 1,025 | 851 |
| – Long to Short Ratio: | 1.0 to 1 | 1.1 to 1 | 1.5 to 1 |
| NET POSITION TREND: | | | |
| – Strength Index Score (3 Year Range Pct): | 42.8 | 57.9 | 58.7 |
| – Strength Index Reading (3 Year Range): | Bearish | Bullish | Bullish |
| NET POSITION MOVEMENT INDEX: | | | |
| – 6-Week Change in Strength Index: | 11.4 | -10.6 | -3.4 |
Article By InvestMacro – Receive our weekly COT Newsletter
*COT Report: The COT data, released weekly to the public each Friday, is updated through the most recent Tuesday (data is 3 days old) and shows a quick view of how large speculators or non-commercials (for-profit traders) were positioned in the futures markets.
The CFTC categorizes trader positions according to commercial hedgers (traders who use futures contracts for hedging as part of the business), non-commercials (large traders who speculate to realize trading profits) and nonreportable traders (usually small traders/speculators) as well as their open interest (contracts open in the market at time of reporting). See CFTC criteria here.