By InvestMacro
Here are the latest charts and statistics for the Commitment of Traders (COT) reports data published by the Commodities Futures Trading Commission (CFTC).
The latest COT data is updated through Tuesday May 26th and shows a quick view of how large traders (for-profit speculators and commercial entities) were positioned in the futures markets.
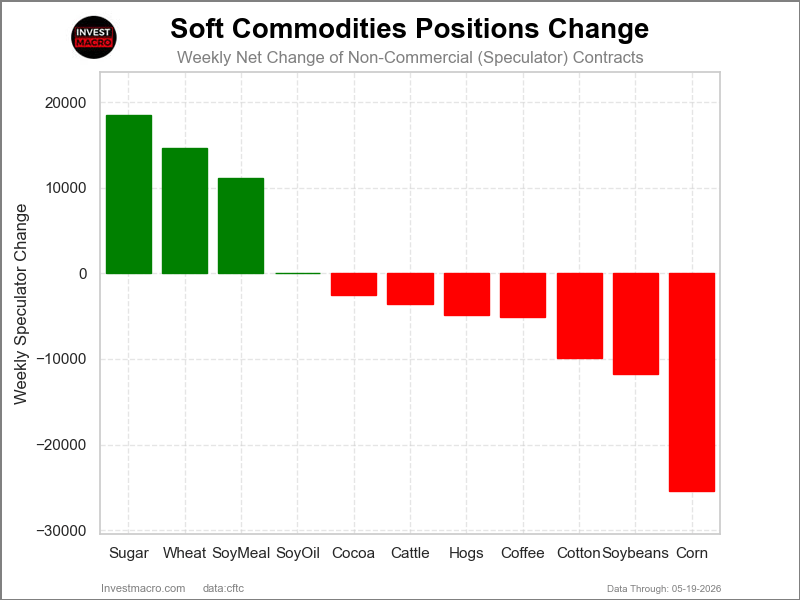
Weekly Speculator Changes led by Coffee
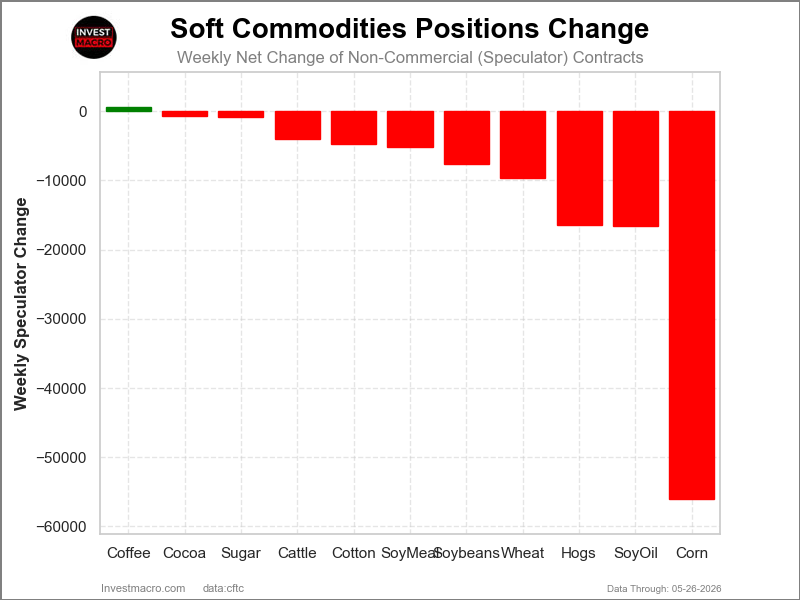
The COT soft commodities markets speculator bets were overall lower this week as just one out of the eleven softs markets we cover had higher positioning while the other ten markets had lower speculator contracts.
The only market with a gain for the softs markets this week was Coffee with a small increase by 671 contracts.
The markets with the declines in speculator bets this week were Corn (-56,100 contracts) with Soybean Oil (-16,534 contracts), Lean Hogs (-16,412 contracts), Wheat (-9,721 contracts) and Soybeans (-7,563 contracts), Soybean Meal (-5,147 contracts), Cotton (-4,796 contracts), Live Cattle (-4,053 contracts), Sugar (-841 contracts) and with Cocoa (-752 contracts) also registering lower bets on the week.
Soft Commodities price performance was led by Soybean Oil and Cocoa
The past five days price performances for the Soft Commodities markets were led by Soybean Oil, which rose by 3.83% for the week, and was followed up by Cocoa, which rose by 3.56% on the week. These were the only two markets that had higher five-day performances.
On the downside, Live Cattle was lower by -0.23%, followed by Lean Hogs which saw a dip by -0.52%. Next, Soybean Oil was lower by -0.63%, while Soybeans was close behind with a -0.81% decline.
Cotton saw lower levels by -1.64% on the week, while Coffee was down by over -2.5% with a -2.74% decrease. Corn dropped by more than -3% with a -3.56% shortfall, followed by Wheat, which decreased by -4.73% on the week.
Finally, Sugar was the biggest decliner on the week with a -5.57% drop.
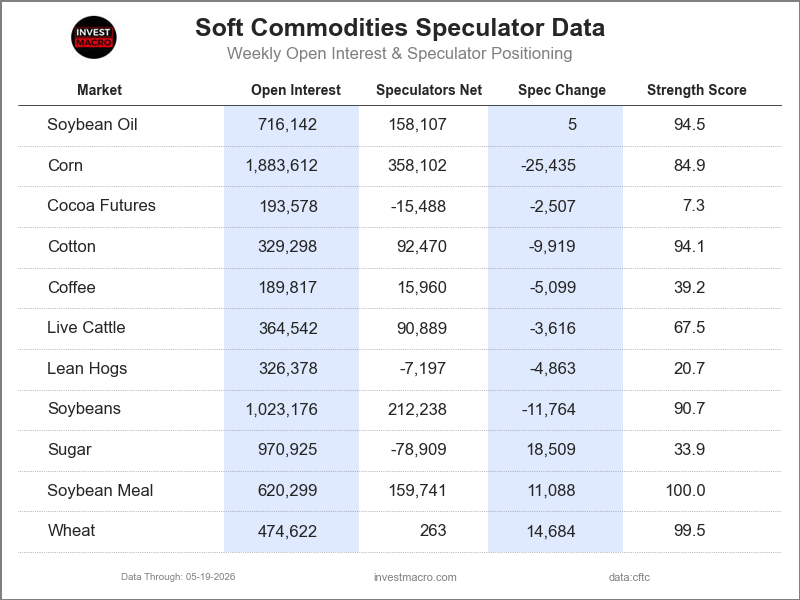
Soft Commodities Data:
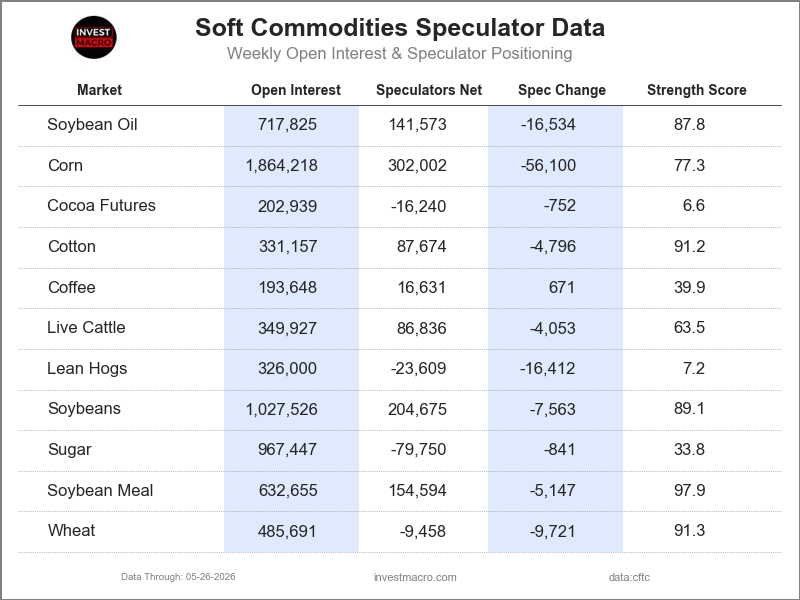
Legend: Weekly Speculators Change | Speculators Current Net Position | Speculators Strength Score compared to last 3-Years (0-100 range)
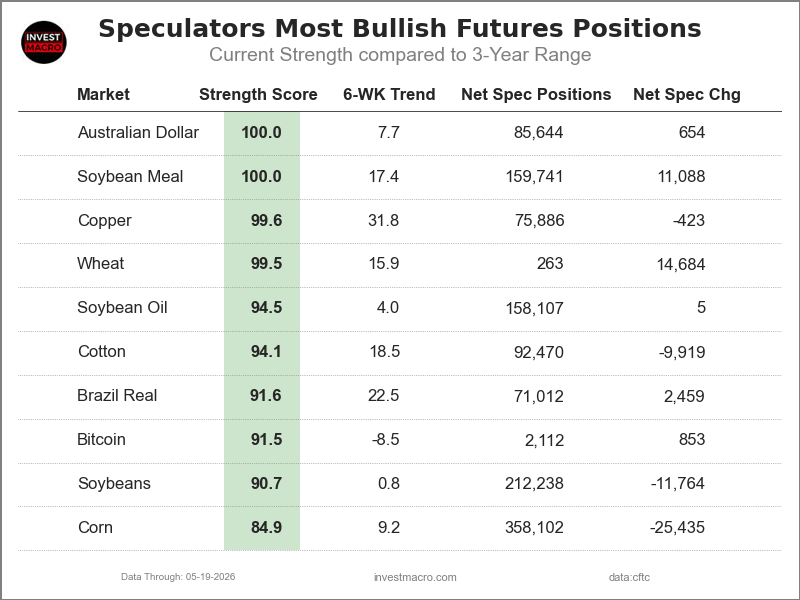
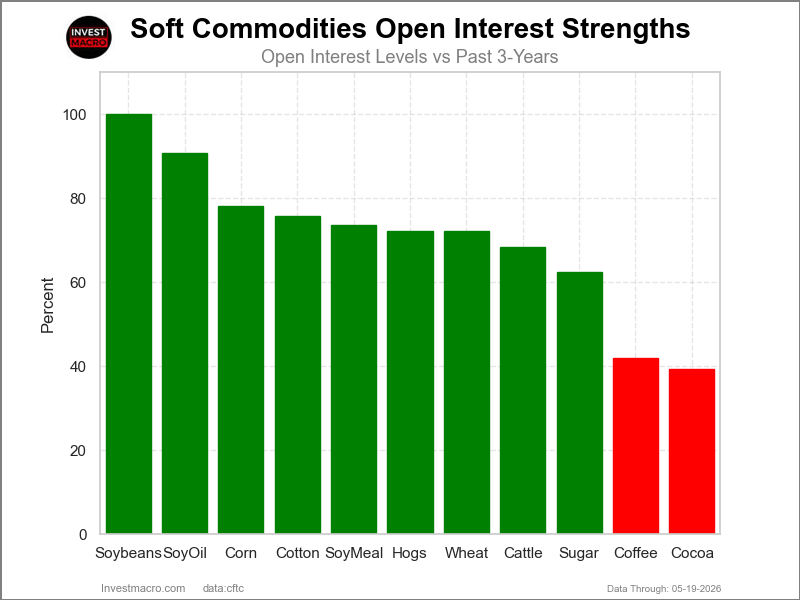
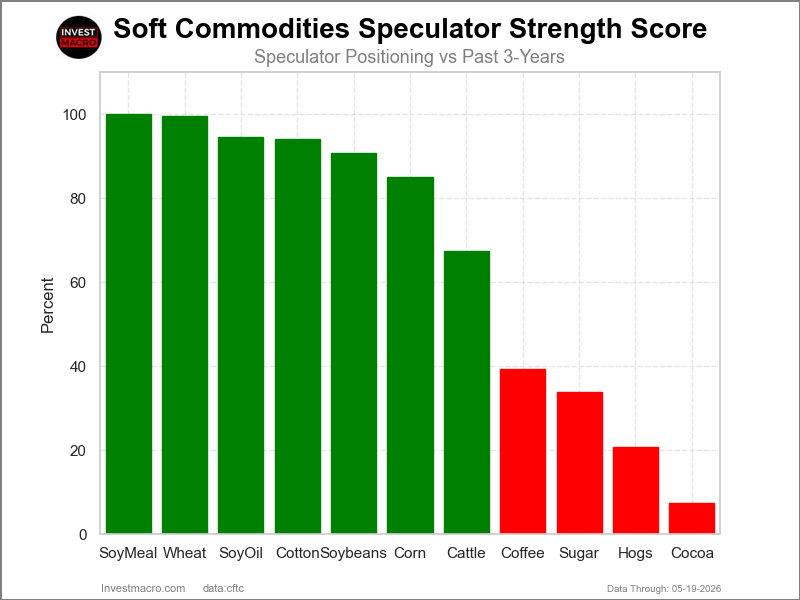
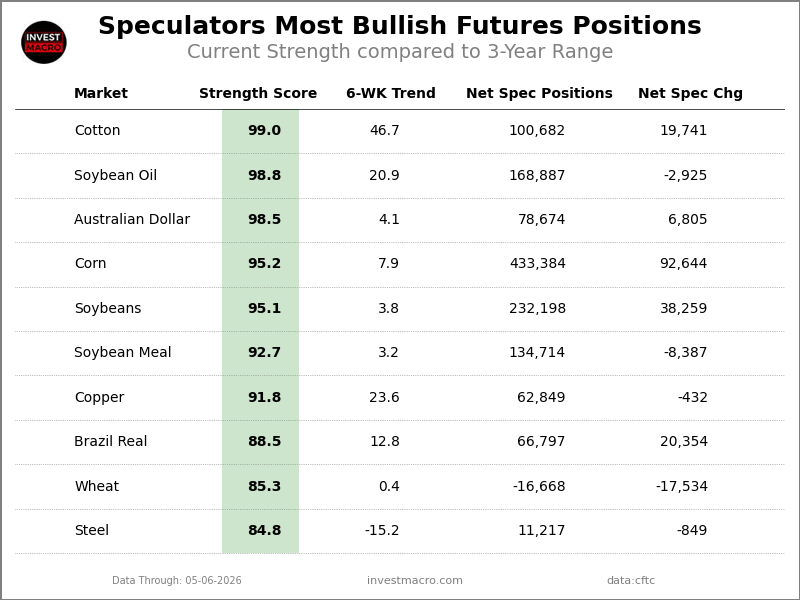
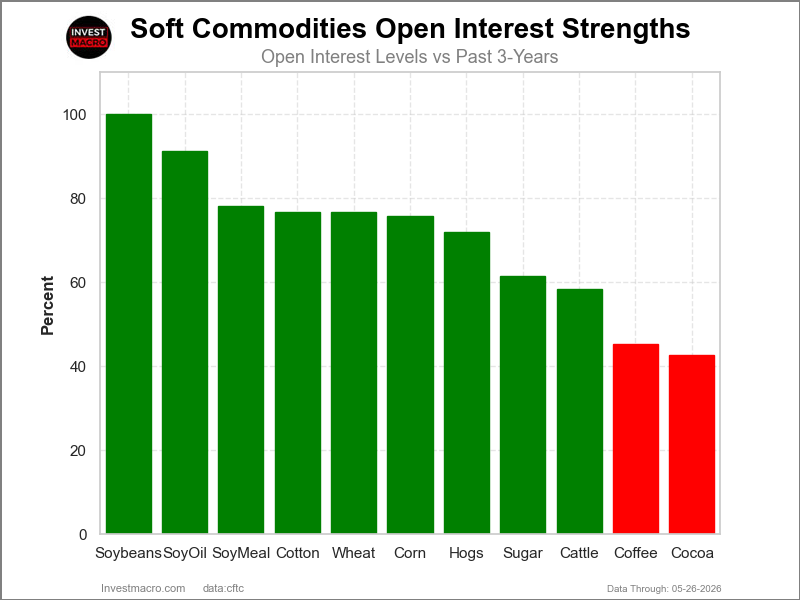
Strength Scores led by Soybean Meal & Wheat
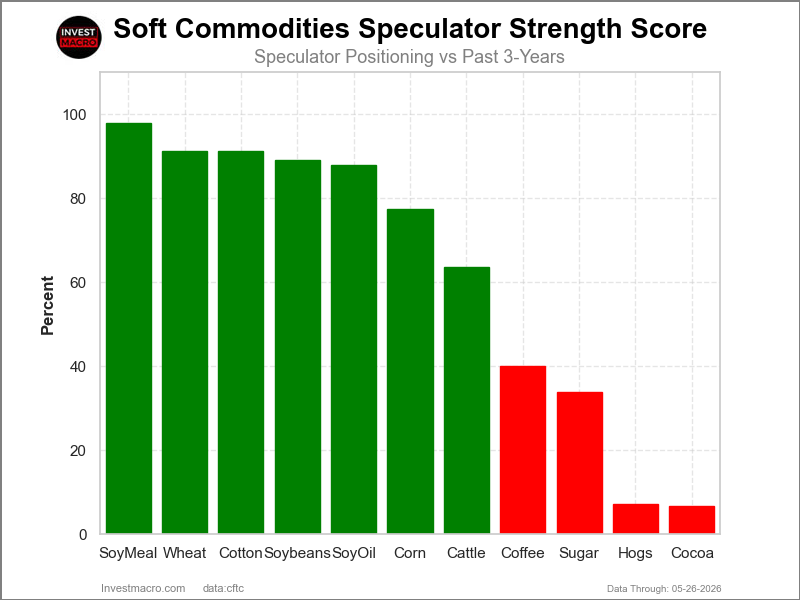
COT Strength Scores (a normalized measure of Speculator positions over a 3-Year range, from 0 to 100 where above 80 is Extreme-Bullish and below 20 is Extreme-Bearish) showed that Soybean Meal (98 percent) and Wheat (91 percent) lead the softs markets this week. Cotton (91 percent), Soybeans (89 percent) and Soybean Oil (88 percent) come in as the next highest in the weekly strength scores.
On the downside, Lean Hogs (7 percent) and Cocoa (7 percent) come in at the lowest strength levels currently and are in Extreme-Bearish territory (below 20 percent). The next lowest strength scores are the Sugar (34 percent) and the Coffee (40 percent).
Strength Statistics:
Corn (77.3 percent) vs Corn previous week (84.9 percent)
Sugar (33.8 percent) vs Sugar previous week (33.9 percent)
Coffee (39.9 percent) vs Coffee previous week (39.2 percent)
Soybeans (89.1 percent) vs Soybeans previous week (90.7 percent)
Soybean Oil (87.8 percent) vs Soybean Oil previous week (94.5 percent)
Soybean Meal (97.9 percent) vs Soybean Meal previous week (100.0 percent)
Live Cattle (63.5 percent) vs Live Cattle previous week (67.5 percent)
Lean Hogs (7.2 percent) vs Lean Hogs previous week (19.2 percent)
Cotton (91.2 percent) vs Cotton previous week (94.1 percent)
Cocoa (6.6 percent) vs Cocoa previous week (7.3 percent)
Wheat (91.3 percent) vs Wheat previous week (99.5 percent)
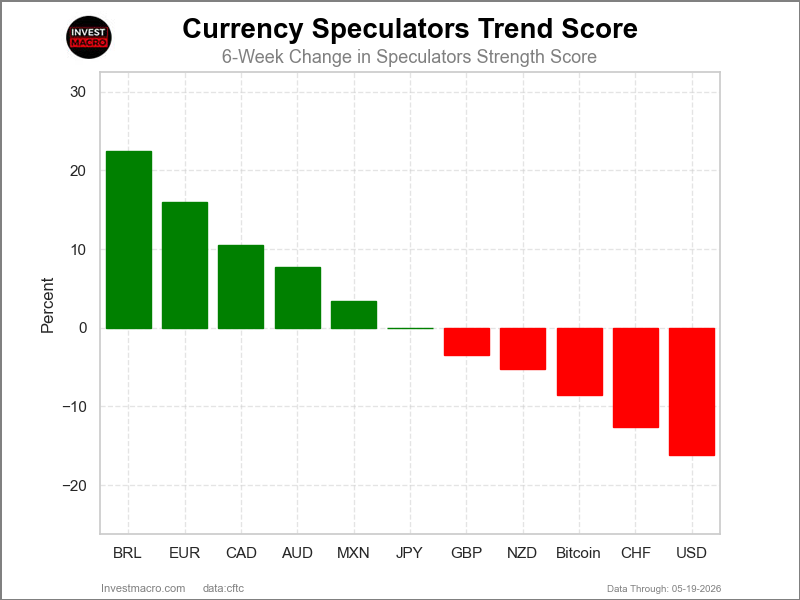
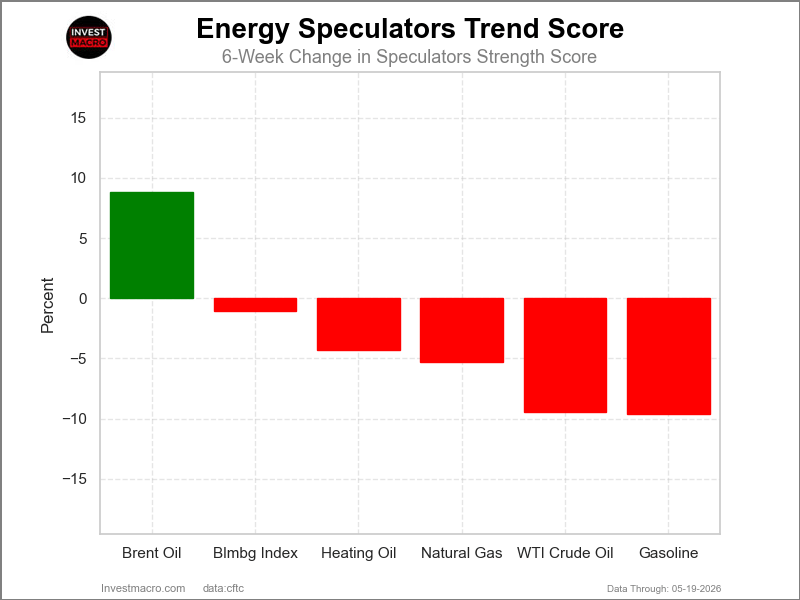
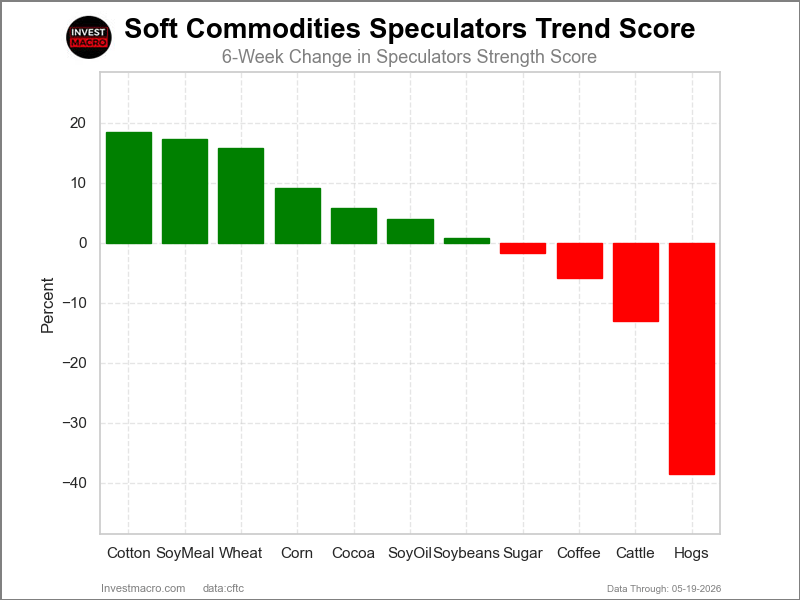
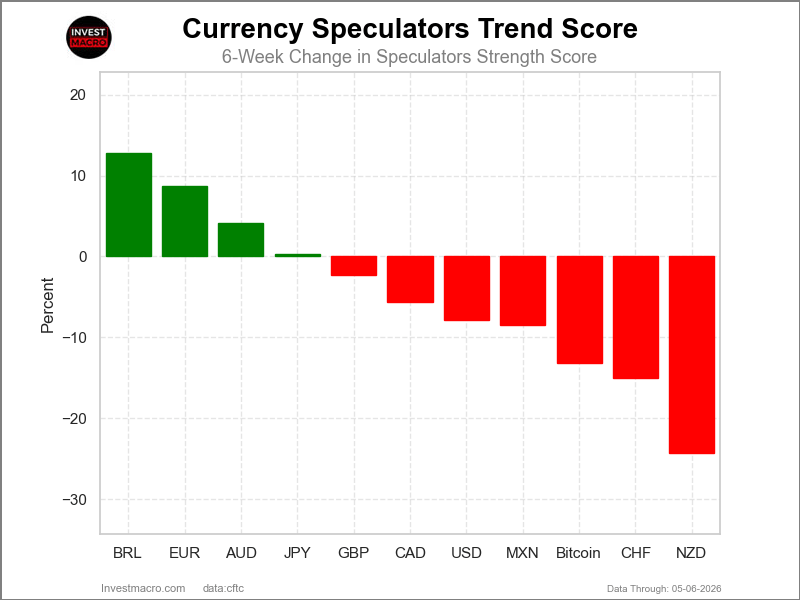
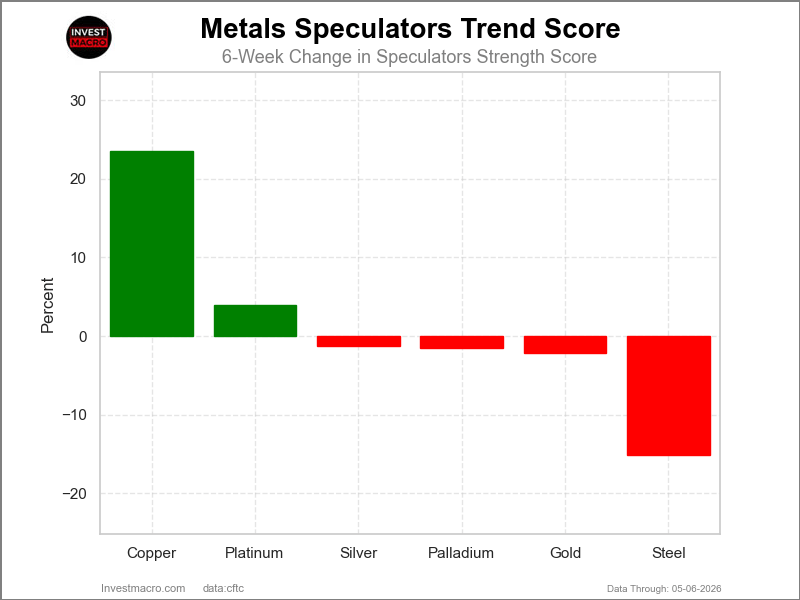
Sugar & Cotton top the 6-Week Strength Trends
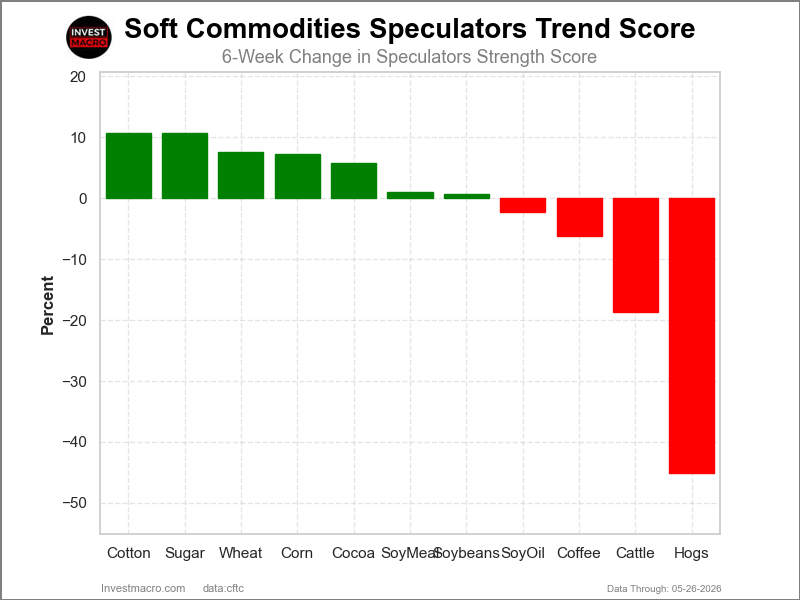
COT Strength Score Trends (or move index, calculates the 6-week changes in strength scores) showed that Sugar (11 percent) and Cotton (11 percent) lead the past six weeks trends for soft commodities. Corn (7 percent), Wheat (7 percent) and Cocoa (6 percent) are the next highest positive movers in the latest trends data.
Lean Hogs (-45 percent) leads the downside trend scores currently with Live Cattle (-19 percent), Coffee (-6 percent) and Soybean Oil (-2 percent) following next with lower trend scores.
Strength Trend Statistics:
Corn (7.2 percent) vs Corn previous week (9.2 percent)
Sugar (10.7 percent) vs Sugar previous week (-1.6 percent)
Coffee (-6.2 percent) vs Coffee previous week (-5.8 percent)
Soybeans (0.7 percent) vs Soybeans previous week (0.8 percent)
Soybean Oil (-2.2 percent) vs Soybean Oil previous week (4.0 percent)
Soybean Meal (1.0 percent) vs Soybean Meal previous week (17.4 percent)
Live Cattle (-18.6 percent) vs Live Cattle previous week (-13.0 percent)
Lean Hogs (-45.1 percent) vs Lean Hogs previous week (-39.2 percent)
Cotton (10.7 percent) vs Cotton previous week (18.5 percent)
Cocoa (5.7 percent) vs Cocoa previous week (5.9 percent)
Wheat (7.5 percent) vs Wheat previous week (15.9 percent)
Individual Soft Commodities Markets:
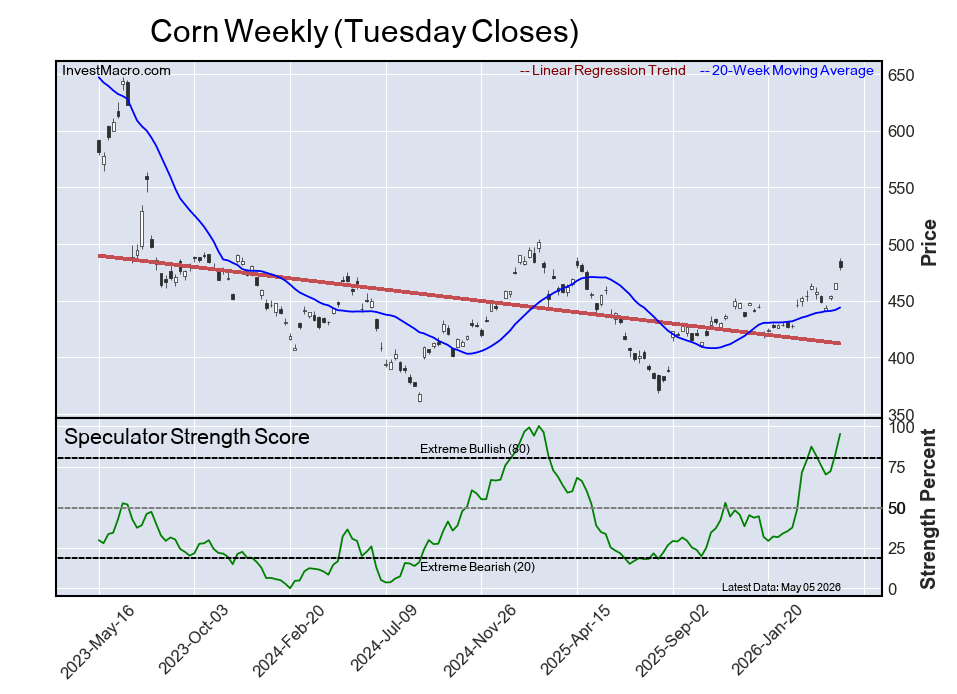
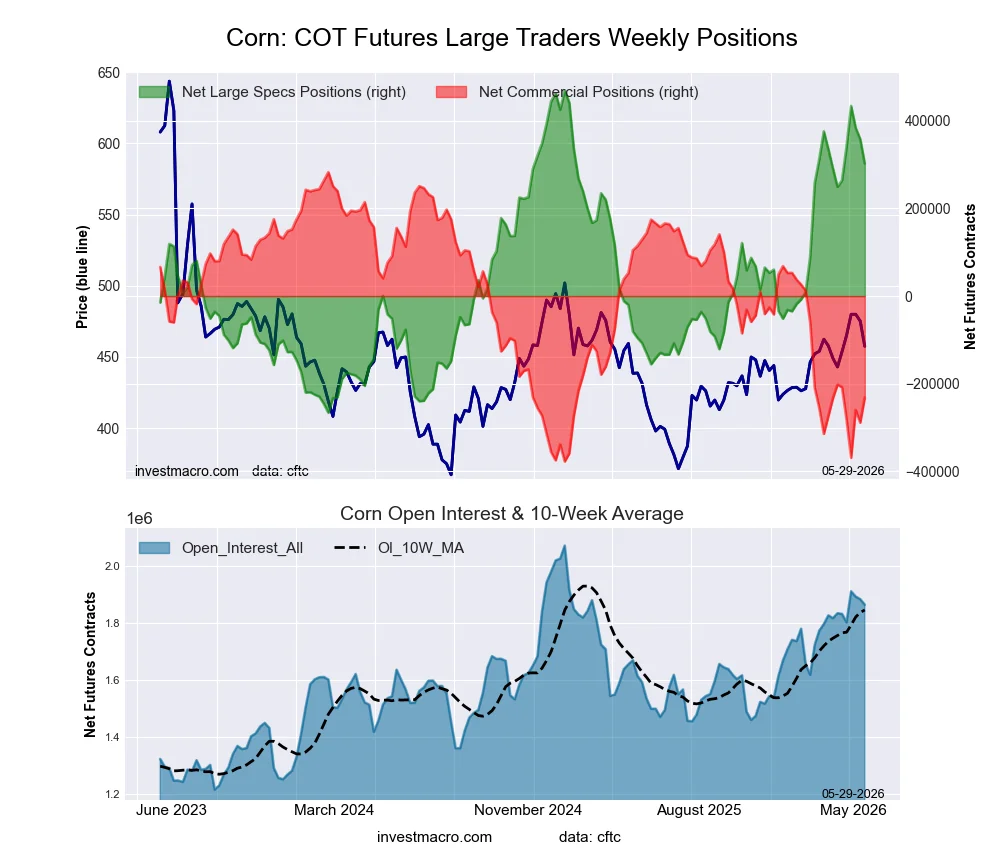
CORN Futures:
 Positioning Notes:
- CORN large speculator standing this week reached a net position of 302,002 contracts in the data reported through Tuesday.
- Weekly Speculator position decline of -56,100 contracts from the previous week which had a total of 358,102 net contracts.
- This week’s current strength score (range over the past 3 years, measured from 0 to 100) shows the speculators are currently Bullish with a score of 77.3 percent.
- The Commercials are Bearish with a score of 22.1 percent.
- The Small Traders (not shown in chart) are Bearish with a score of 45.0 percent.
Price Trend-Following Model: Weak Uptrend
Our weekly trend-following model classifies the current market price position as: Weak Uptrend.
| CORN Futures Statistics | SPECULATORS | COMMERCIALS | SMALL TRADERS |
| – Percent of Open Interest Longs: | 28.0 | 41.5 | 7.2 |
| – Percent of Open Interest Shorts: | 11.8 | 53.9 | 10.9 |
| – Net Position: | 302,002 | -231,519 | -70,483 |
| – Gross Longs: | 521,725 | 773,197 | 133,362 |
| – Gross Shorts: | 219,723 | 1,004,716 | 203,845 |
| – Long to Short Ratio: | 2.4 to 1 | 0.8 to 1 | 0.7 to 1 |
| NET POSITION TREND: | |||
| – Strength Index Score (3 Year Range Pct): | 77.3 | 22.1 | 45.0 |
| – Strength Index Reading (3 Year Range): | Bullish | Bearish | Bearish |
| NET POSITION MOVEMENT INDEX: | |||
| – 6-Week Change in Strength Index: | 7.2 | -4.4 | -20.2 |
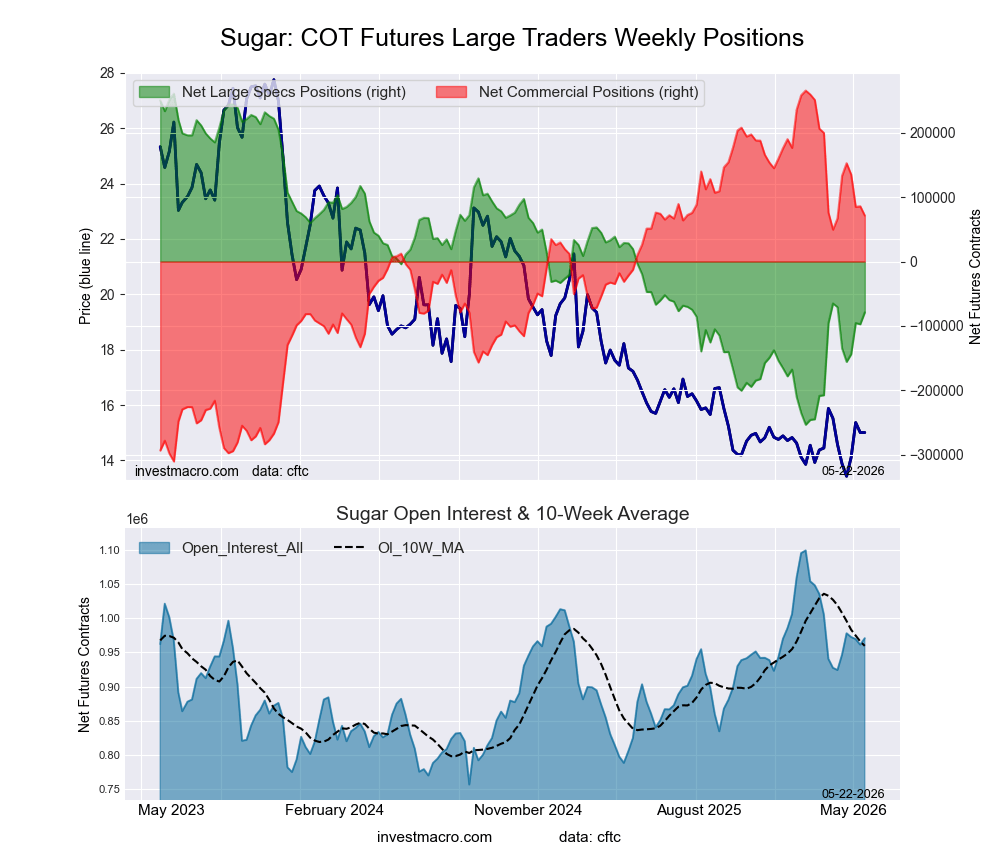
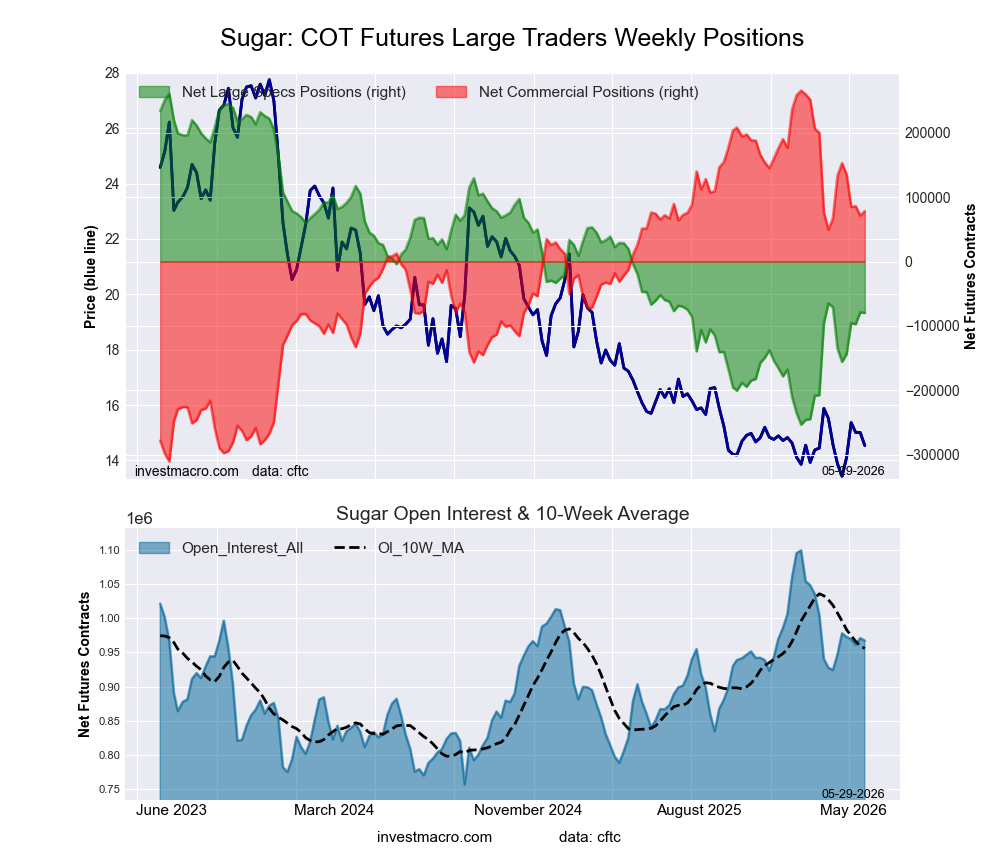
SUGAR Futures:
 Positioning Notes:
- SUGAR large speculator standing this week reached a net position of -79,750 contracts in the data reported through Tuesday.
- Weekly Speculator position decline of -841 contracts from the previous week which had a total of -78,909 net contracts.
- This week’s current strength score (range over the past 3 years, measured from 0 to 100) shows the speculators are currently Bearish with a score of 33.8 percent.
- The Commercials are Bullish with a score of 67.5 percent.
- The Small Traders (not shown in chart) are Bearish with a score of 33.9 percent.
Price Trend-Following Model: Strong Downtrend
Our weekly trend-following model classifies the current market price position as: Strong Downtrend.
| SUGAR Futures Statistics | SPECULATORS | COMMERCIALS | SMALL TRADERS |
| – Percent of Open Interest Longs: | 24.7 | 50.7 | 8.3 |
| – Percent of Open Interest Shorts: | 32.9 | 42.6 | 8.1 |
| – Net Position: | -79,750 | 78,292 | 1,458 |
| – Gross Longs: | 238,727 | 490,877 | 79,967 |
| – Gross Shorts: | 318,477 | 412,585 | 78,509 |
| – Long to Short Ratio: | 0.7 to 1 | 1.2 to 1 | 1.0 to 1 |
| NET POSITION TREND: | |||
| – Strength Index Score (3 Year Range Pct): | 33.8 | 67.5 | 33.9 |
| – Strength Index Reading (3 Year Range): | Bearish | Bullish | Bearish |
| NET POSITION MOVEMENT INDEX: | |||
| – 6-Week Change in Strength Index: | 10.7 | -9.6 | -0.1 |
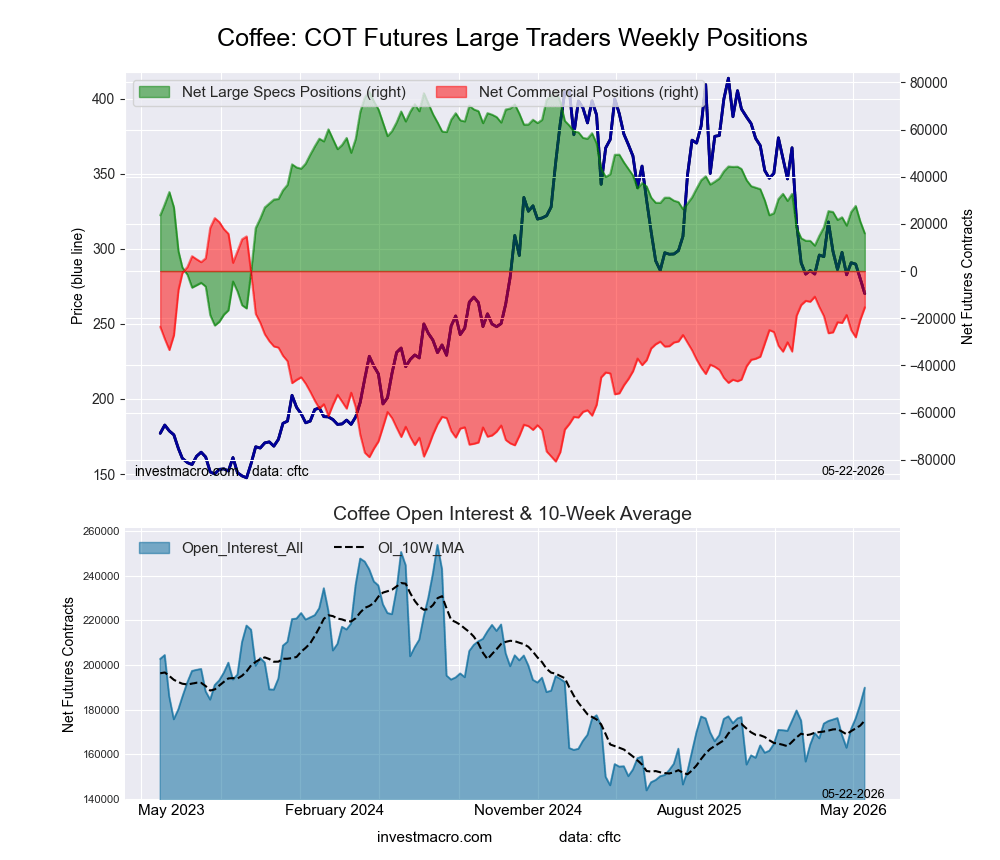
COFFEE Futures:
 Positioning Notes:
- COFFEE large speculator standing this week reached a net position of 16,631 contracts in the data reported through Tuesday.
- Weekly Speculator position gain of 671 contracts from the previous week which had a total of 15,960 net contracts.
- This week’s current strength score (range over the past 3 years, measured from 0 to 100) shows the speculators are currently Bearish with a score of 39.9 percent.
- The Commercials are Bullish with a score of 62.0 percent.
- The Small Traders (not shown in chart) are Bearish-Extreme with a score of 17.7 percent.
Price Trend-Following Model: Downtrend
Our weekly trend-following model classifies the current market price position as: Downtrend.
| COFFEE Futures Statistics | SPECULATORS | COMMERCIALS | SMALL TRADERS |
| – Percent of Open Interest Longs: | 27.7 | 38.6 | 4.1 |
| – Percent of Open Interest Shorts: | 19.1 | 47.2 | 4.1 |
| – Net Position: | 16,631 | -16,766 | 135 |
| – Gross Longs: | 53,574 | 74,669 | 7,985 |
| – Gross Shorts: | 36,943 | 91,435 | 7,850 |
| – Long to Short Ratio: | 1.5 to 1 | 0.8 to 1 | 1.0 to 1 |
| NET POSITION TREND: | |||
| – Strength Index Score (3 Year Range Pct): | 39.9 | 62.0 | 17.7 |
| – Strength Index Reading (3 Year Range): | Bearish | Bullish | Bearish-Extreme |
| NET POSITION MOVEMENT INDEX: | |||
| – 6-Week Change in Strength Index: | -6.2 | 5.0 | 17.7 |
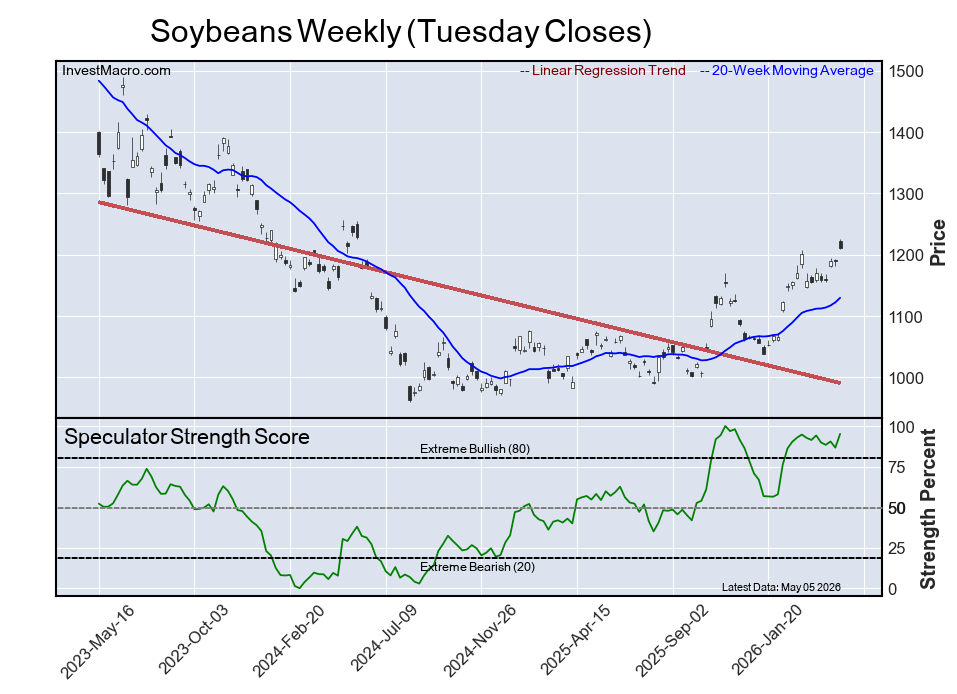
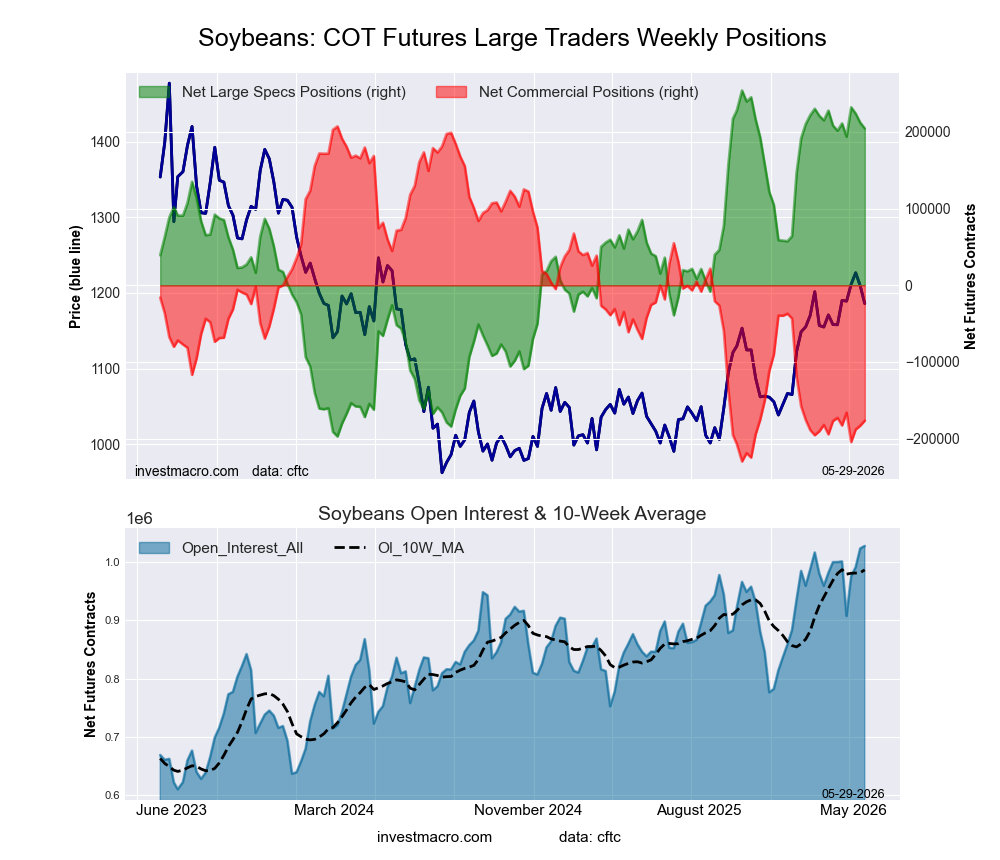
SOYBEANS Futures:
 Positioning Notes:
- SOYBEANS large speculator standing this week reached a net position of 204,675 contracts in the data reported through Tuesday.
- Weekly Speculator position decline of -7,563 contracts from the previous week which had a total of 212,238 net contracts.
- This week’s current strength score (range over the past 3 years, measured from 0 to 100) shows the speculators are currently Bullish-Extreme with a score of 89.1 percent.
- The Commercials are Bearish-Extreme with a score of 12.2 percent.
- The Small Traders (not shown in chart) are Bearish with a score of 25.2 percent.
Price Trend-Following Model: Uptrend
Our weekly trend-following model classifies the current market price position as: Uptrend.
| SOYBEANS Futures Statistics | SPECULATORS | COMMERCIALS | SMALL TRADERS |
| – Percent of Open Interest Longs: | 27.8 | 47.2 | 5.0 |
| – Percent of Open Interest Shorts: | 7.8 | 64.4 | 7.7 |
| – Net Position: | 204,675 | -176,610 | -28,065 |
| – Gross Longs: | 285,330 | 484,904 | 51,229 |
| – Gross Shorts: | 80,655 | 661,514 | 79,294 |
| – Long to Short Ratio: | 3.5 to 1 | 0.7 to 1 | 0.6 to 1 |
| NET POSITION TREND: | |||
| – Strength Index Score (3 Year Range Pct): | 89.1 | 12.2 | 25.2 |
| – Strength Index Reading (3 Year Range): | Bullish-Extreme | Bearish-Extreme | Bearish |
| NET POSITION MOVEMENT INDEX: | |||
| – 6-Week Change in Strength Index: | 0.7 | -0.8 | 2.1 |
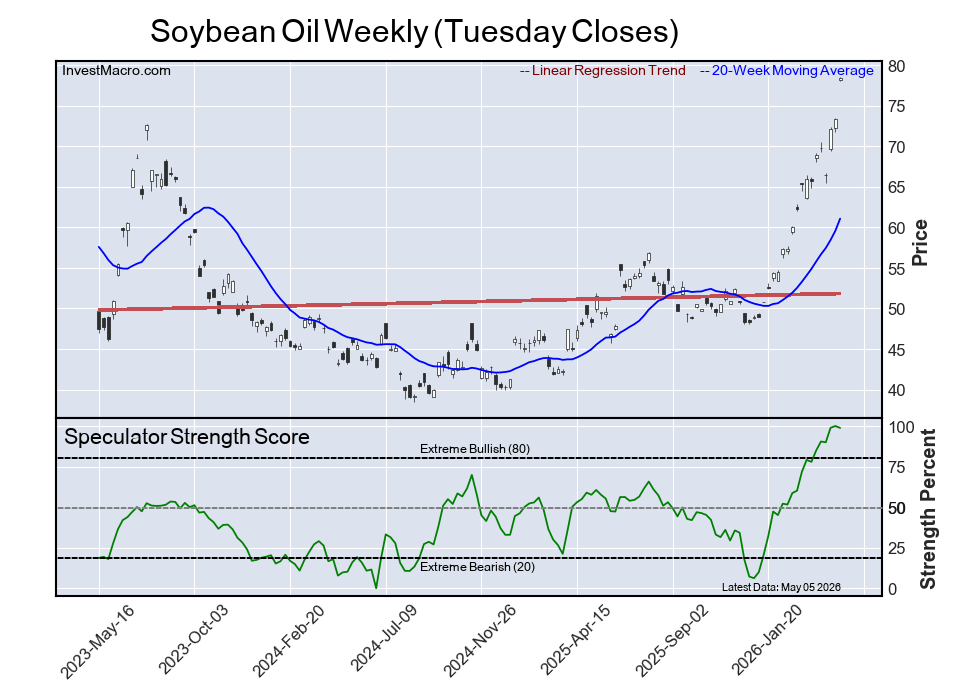
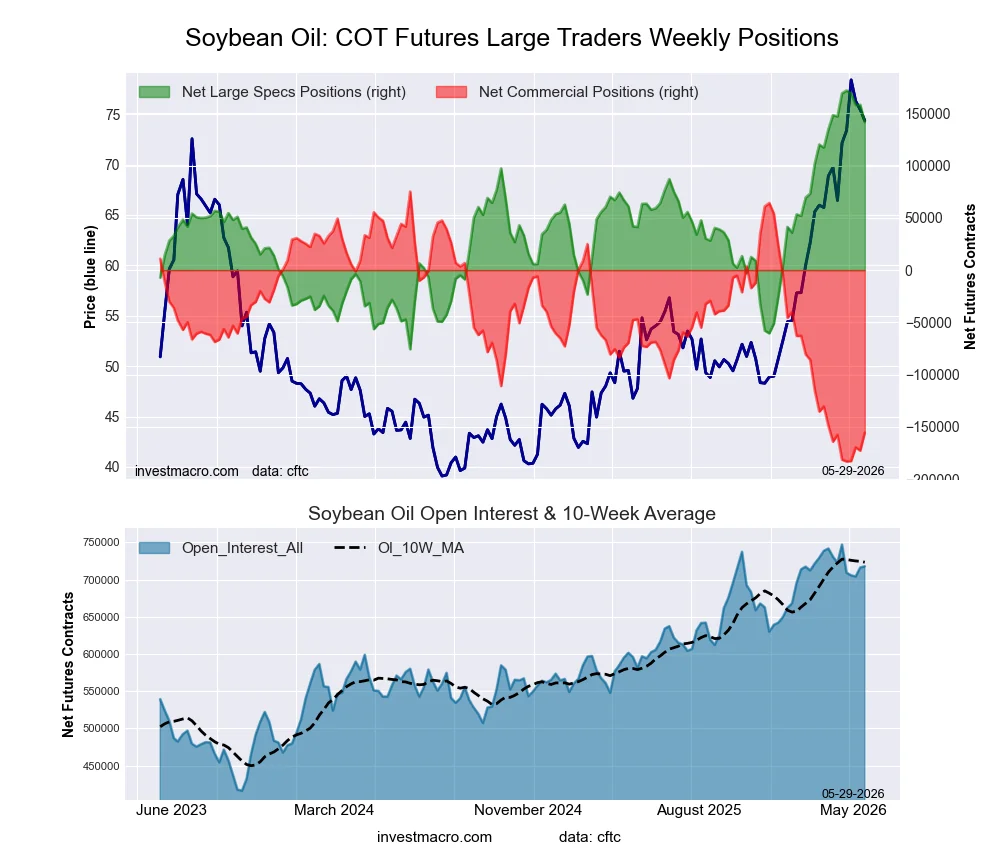
SOYBEAN OIL Futures:
 Positioning Notes:
- SOYBEAN OIL large speculator standing this week reached a net position of 141,573 contracts in the data reported through Tuesday.
- Weekly Speculator position decrease of -16,534 contracts from the previous week which had a total of 158,107 net contracts.
- This week’s current strength score (range over the past 3 years, measured from 0 to 100) shows the speculators are currently Bullish-Extreme with a score of 87.8 percent.
- The Commercials are Bearish-Extreme with a score of 10.7 percent.
- The Small Traders (not shown in chart) are Bullish-Extreme with a score of 87.9 percent.
Price Trend-Following Model: Uptrend
Our weekly trend-following model classifies the current market price position as: Uptrend.
| SOYBEAN OIL Futures Statistics | SPECULATORS | COMMERCIALS | SMALL TRADERS |
| – Percent of Open Interest Longs: | 28.2 | 45.7 | 5.8 |
| – Percent of Open Interest Shorts: | 8.5 | 67.4 | 3.9 |
| – Net Position: | 141,573 | -155,545 | 13,972 |
| – Gross Longs: | 202,640 | 328,337 | 41,978 |
| – Gross Shorts: | 61,067 | 483,882 | 28,006 |
| – Long to Short Ratio: | 3.3 to 1 | 0.7 to 1 | 1.5 to 1 |
| NET POSITION TREND: | |||
| – Strength Index Score (3 Year Range Pct): | 87.8 | 10.7 | 87.9 |
| – Strength Index Reading (3 Year Range): | Bullish-Extreme | Bearish-Extreme | Bullish-Extreme |
| NET POSITION MOVEMENT INDEX: | |||
| – 6-Week Change in Strength Index: | -2.2 | 0.8 | 16.2 |
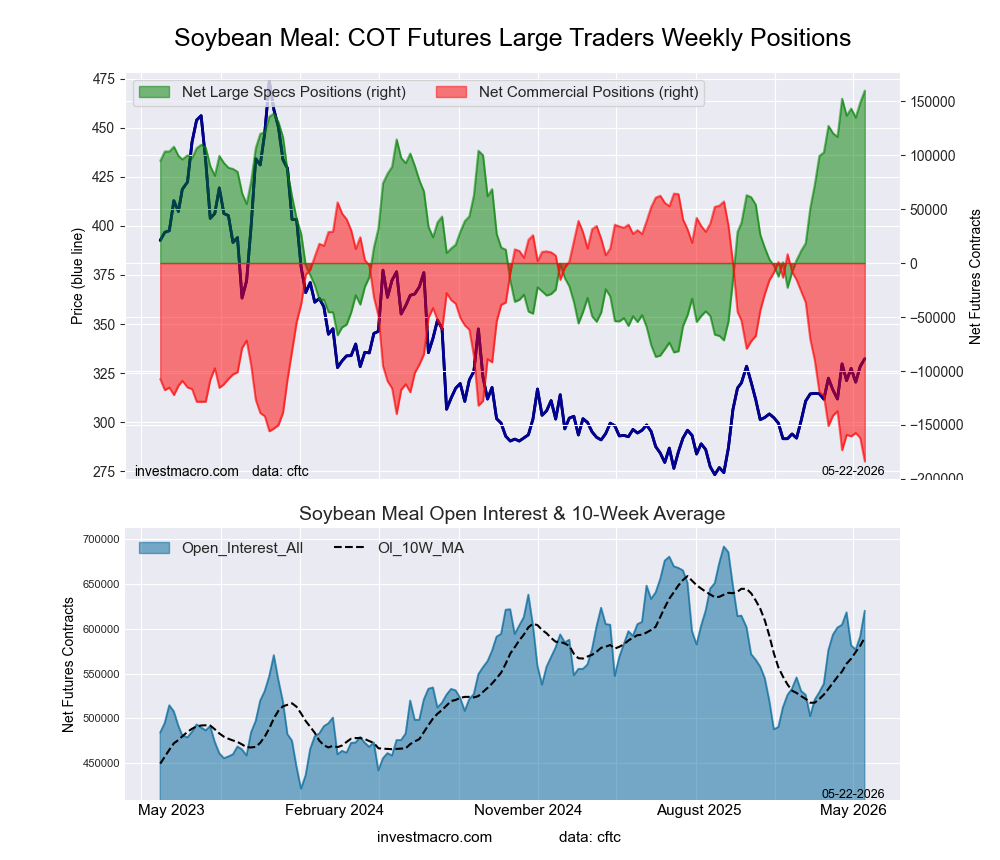
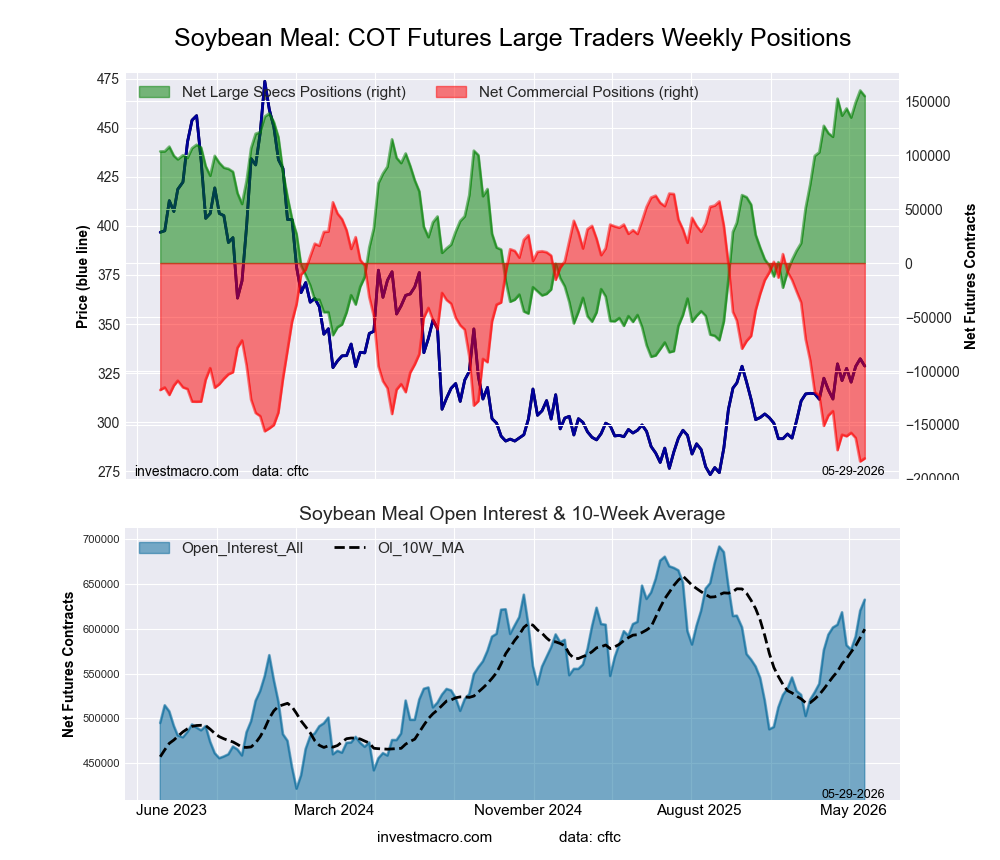
SOYBEAN MEAL Futures:
 Positioning Notes:
- SOYBEAN MEAL large speculator standing this week reached a net position of 154,594 contracts in the data reported through Tuesday.
- Weekly Speculator position decline of -5,147 contracts from the previous week which had a total of 159,741 net contracts.
- This week’s current strength score (range over the past 3 years, measured from 0 to 100) shows the speculators are currently Bullish-Extreme with a score of 97.9 percent.
- The Commercials are Bearish-Extreme with a score of 1.1 percent.
- The Small Traders (not shown in chart) are Bullish-Extreme with a score of 90.8 percent.
Price Trend-Following Model: Uptrend
Our weekly trend-following model classifies the current market price position as: Uptrend.
| SOYBEAN MEAL Futures Statistics | SPECULATORS | COMMERCIALS | SMALL TRADERS |
| – Percent of Open Interest Longs: | 32.1 | 40.6 | 8.5 |
| – Percent of Open Interest Shorts: | 7.6 | 69.2 | 4.4 |
| – Net Position: | 154,594 | -180,958 | 26,364 |
| – Gross Longs: | 202,878 | 256,643 | 54,085 |
| – Gross Shorts: | 48,284 | 437,601 | 27,721 |
| – Long to Short Ratio: | 4.2 to 1 | 0.6 to 1 | 2.0 to 1 |
| NET POSITION TREND: | |||
| – Strength Index Score (3 Year Range Pct): | 97.9 | 1.1 | 90.8 |
| – Strength Index Reading (3 Year Range): | Bullish-Extreme | Bearish-Extreme | Bullish-Extreme |
| NET POSITION MOVEMENT INDEX: | |||
| – 6-Week Change in Strength Index: | 1.0 | -3.1 | 30.6 |
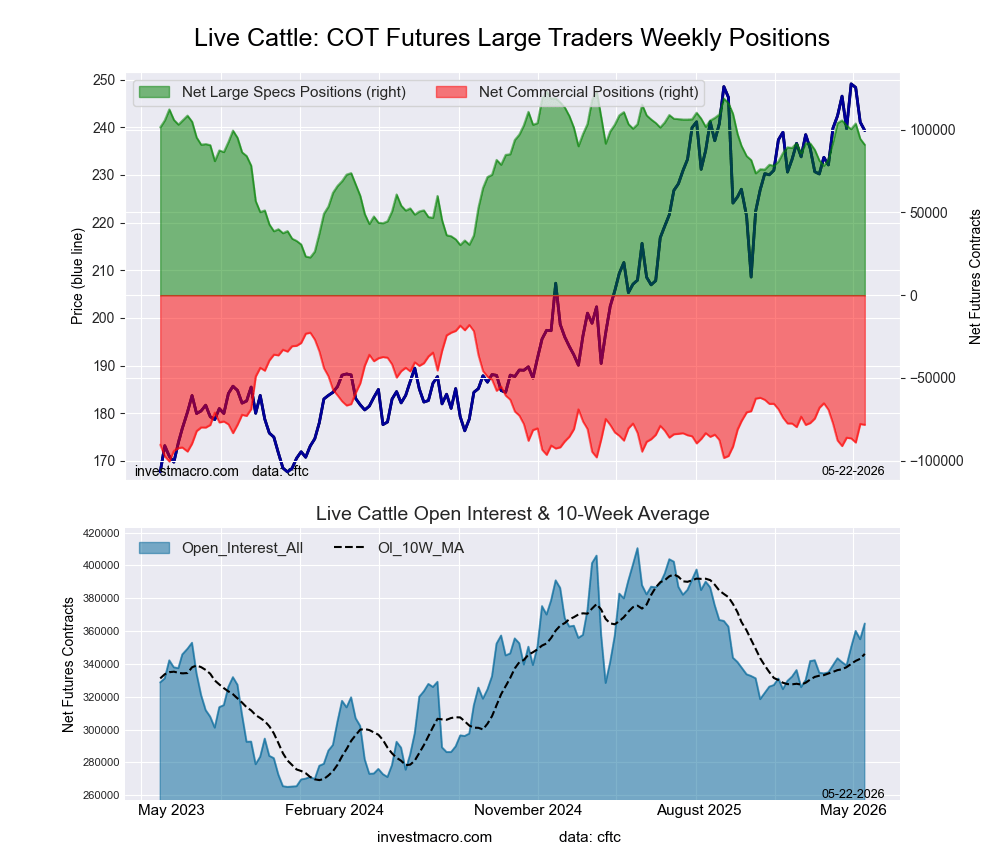
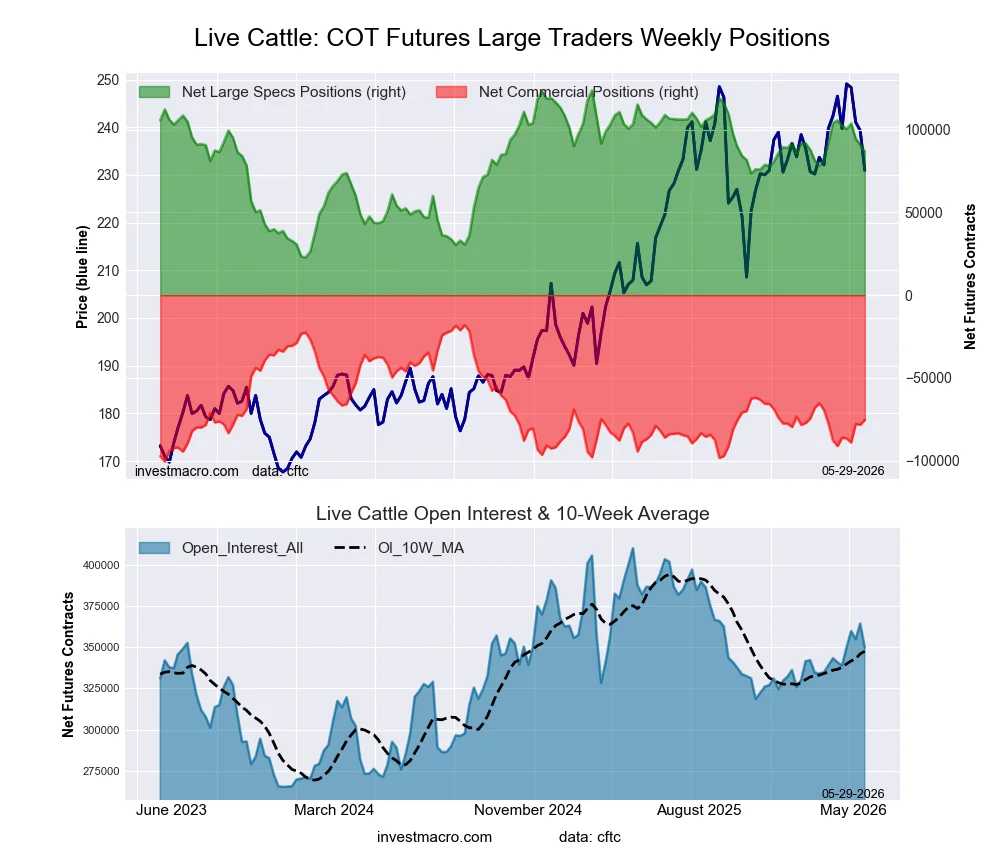
LIVE CATTLE Futures:
 Positioning Notes:
- LIVE CATTLE large speculator standing this week reached a net position of 86,836 contracts in the data reported through Tuesday.
- Weekly Speculator position fall of -4,053 contracts from the previous week which had a total of 90,889 net contracts.
- This week’s current strength score (range over the past 3 years, measured from 0 to 100) shows the speculators are currently Bullish with a score of 63.5 percent.
- The Commercials are Bearish with a score of 30.5 percent.
- The Small Traders (not shown in chart) are Bullish with a score of 57.9 percent.
Price Trend-Following Model: Weak Uptrend
Our weekly trend-following model classifies the current market price position as: Weak Uptrend.
| LIVE CATTLE Futures Statistics | SPECULATORS | COMMERCIALS | SMALL TRADERS |
| – Percent of Open Interest Longs: | 43.4 | 30.3 | 8.1 |
| – Percent of Open Interest Shorts: | 18.6 | 51.9 | 11.4 |
| – Net Position: | 86,836 | -75,333 | -11,503 |
| – Gross Longs: | 151,778 | 106,193 | 28,220 |
| – Gross Shorts: | 64,942 | 181,526 | 39,723 |
| – Long to Short Ratio: | 2.3 to 1 | 0.6 to 1 | 0.7 to 1 |
| NET POSITION TREND: | |||
| – Strength Index Score (3 Year Range Pct): | 63.5 | 30.5 | 57.9 |
| – Strength Index Reading (3 Year Range): | Bullish | Bearish | Bullish |
| NET POSITION MOVEMENT INDEX: | |||
| – 6-Week Change in Strength Index: | -18.6 | 19.1 | 10.4 |
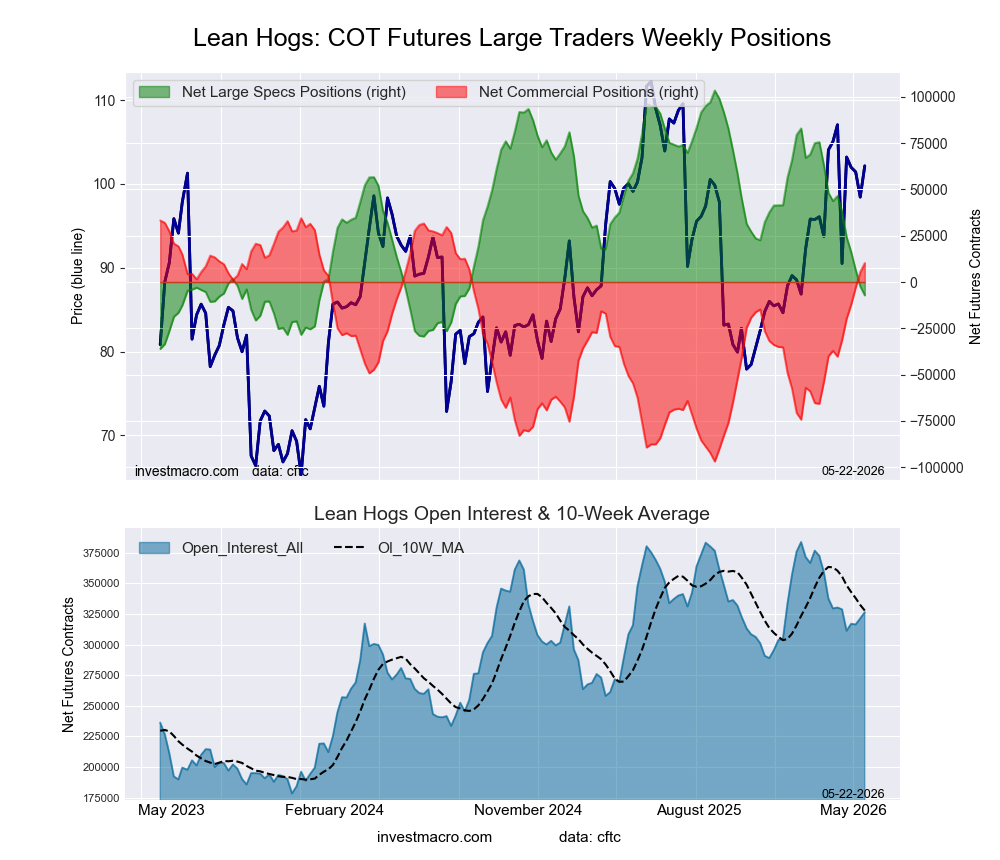
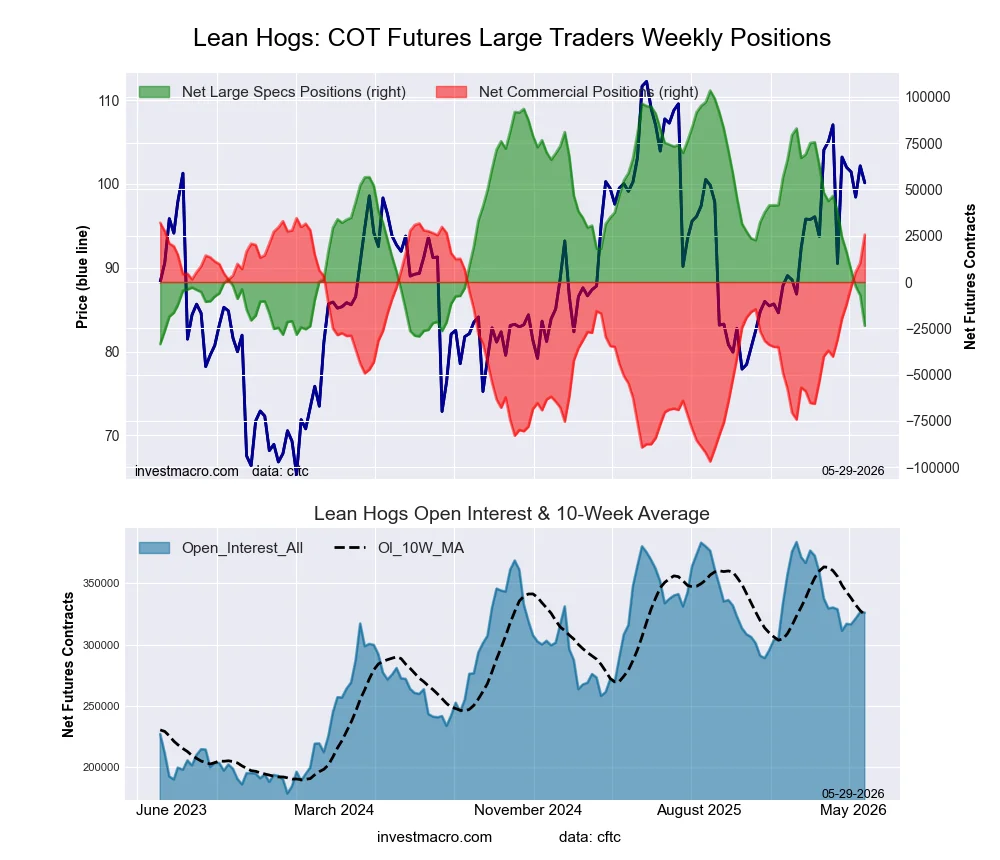
LEAN HOGS Futures:
 Positioning Notes:
- LEAN HOGS large speculator standing this week reached a net position of -23,609 contracts in the data reported through Tuesday.
- Weekly Speculator position decrease of -16,412 contracts from the previous week which had a total of -7,197 net contracts.
- This week’s current strength score (range over the past 3 years, measured from 0 to 100) shows the speculators are currently Bearish-Extreme with a score of 7.2 percent.
- The Commercials are Bullish-Extreme with a score of 93.2 percent.
- The Small Traders (not shown in chart) are Bullish with a score of 75.7 percent.
Price Trend-Following Model: Uptrend
Our weekly trend-following model classifies the current market price position as: Uptrend.
| LEAN HOGS Futures Statistics | SPECULATORS | COMMERCIALS | SMALL TRADERS |
| – Percent of Open Interest Longs: | 24.8 | 41.0 | 7.3 |
| – Percent of Open Interest Shorts: | 32.0 | 33.2 | 7.9 |
| – Net Position: | -23,609 | 25,553 | -1,944 |
| – Gross Longs: | 80,782 | 133,802 | 23,805 |
| – Gross Shorts: | 104,391 | 108,249 | 25,749 |
| – Long to Short Ratio: | 0.8 to 1 | 1.2 to 1 | 0.9 to 1 |
| NET POSITION TREND: | |||
| – Strength Index Score (3 Year Range Pct): | 7.2 | 93.2 | 75.7 |
| – Strength Index Reading (3 Year Range): | Bearish-Extreme | Bullish-Extreme | Bullish |
| NET POSITION MOVEMENT INDEX: | |||
| – 6-Week Change in Strength Index: | -45.1 | 43.3 | 33.6 |
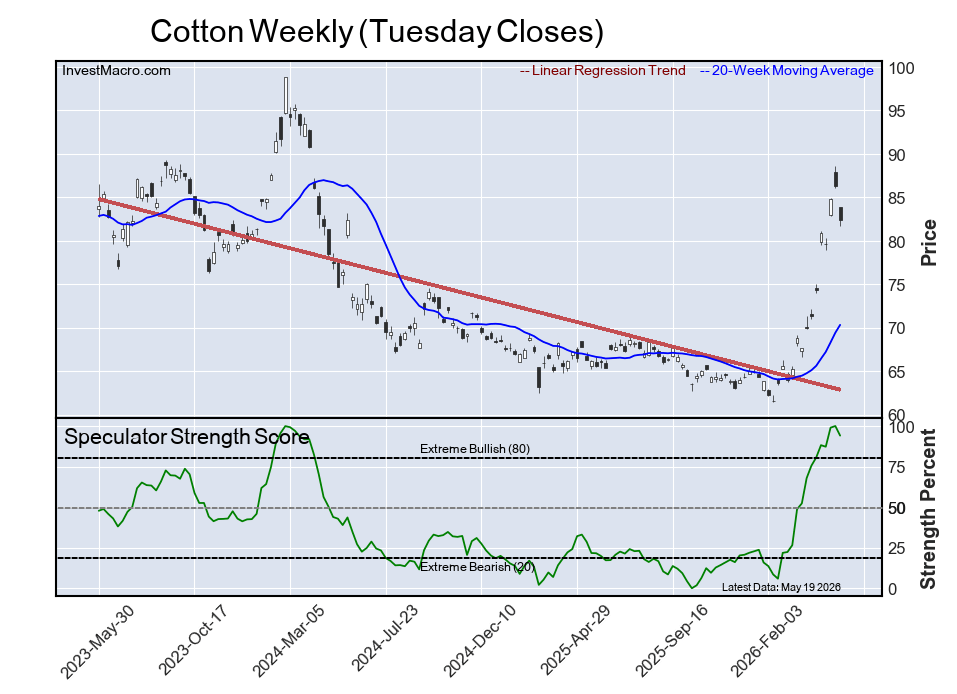
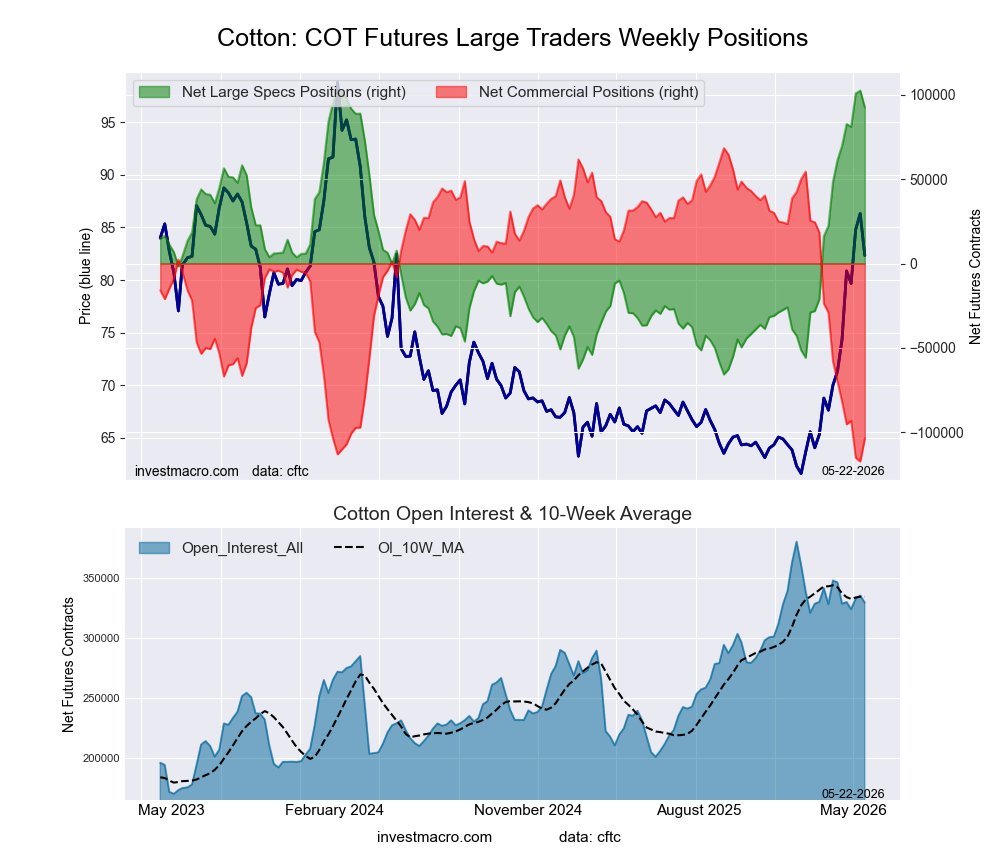
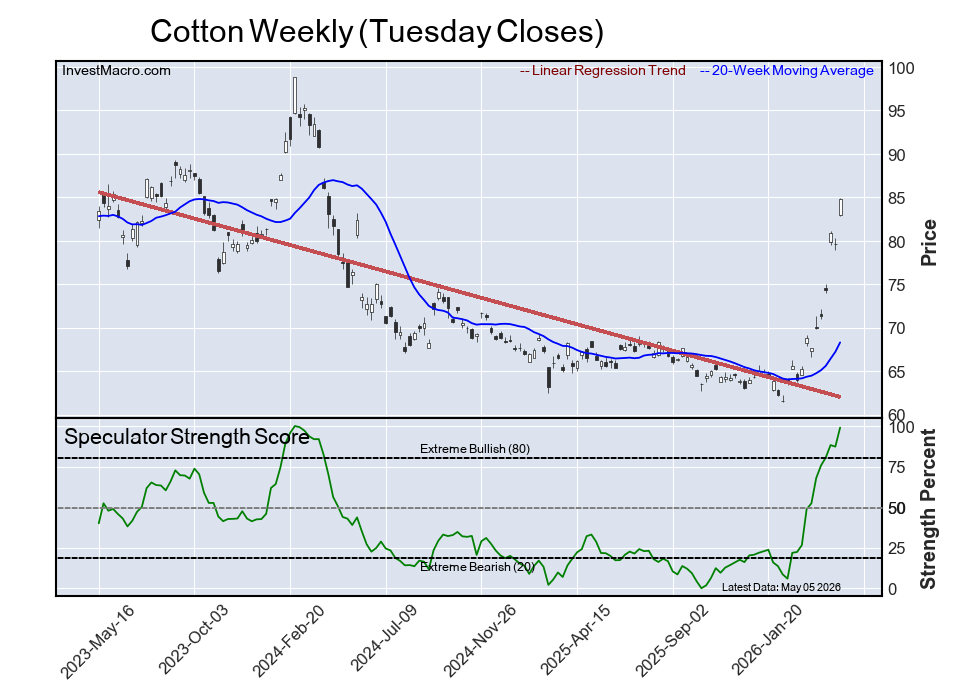
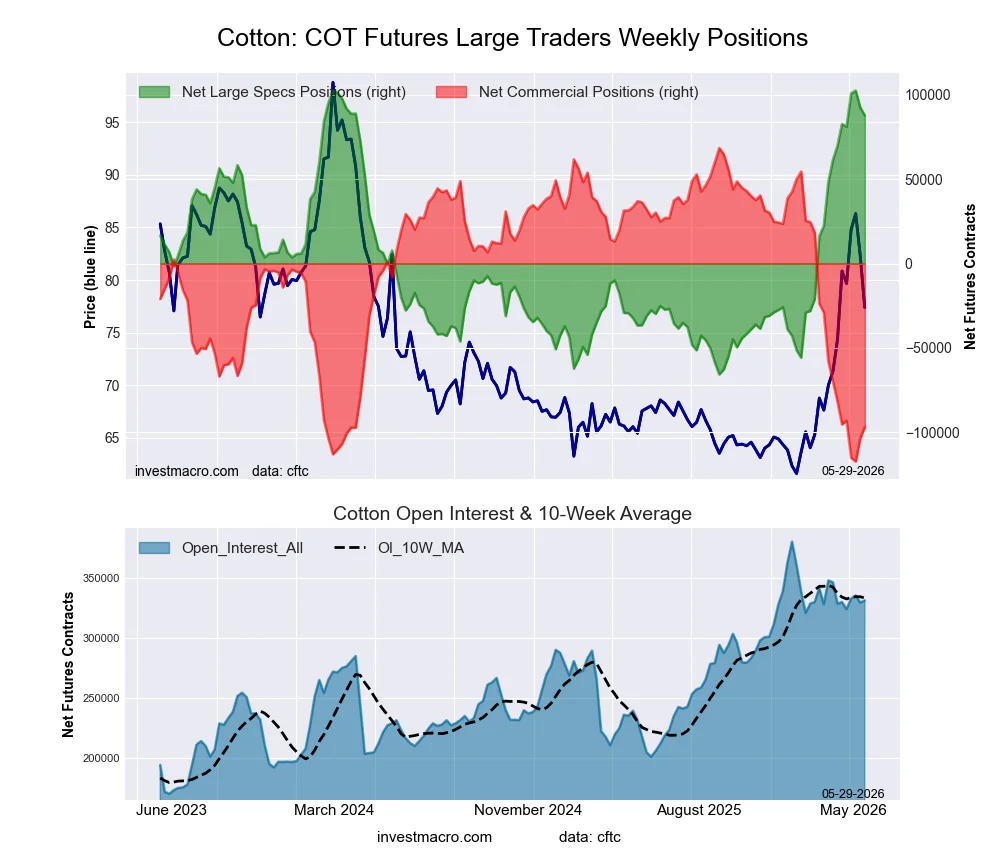
COTTON Futures:
 Positioning Notes:
- COTTON large speculator standing this week reached a net position of 87,674 contracts in the data reported through Tuesday.
- Weekly Speculator position decline of -4,796 contracts from the previous week which had a total of 92,470 net contracts.
- This week’s current strength score (range over the past 3 years, measured from 0 to 100) shows the speculators are currently Bullish-Extreme with a score of 91.2 percent.
- The Commercials are Bearish-Extreme with a score of 11.0 percent.
- The Small Traders (not shown in chart) are Bullish with a score of 68.1 percent.
Price Trend-Following Model: Strong Uptrend
Our weekly trend-following model classifies the current market price position as: Strong Uptrend.
| COTTON Futures Statistics | SPECULATORS | COMMERCIALS | SMALL TRADERS |
| – Percent of Open Interest Longs: | 41.0 | 34.7 | 5.6 |
| – Percent of Open Interest Shorts: | 14.5 | 63.9 | 2.8 |
| – Net Position: | 87,674 | -96,751 | 9,077 |
| – Gross Longs: | 135,684 | 114,884 | 18,439 |
| – Gross Shorts: | 48,010 | 211,635 | 9,362 |
| – Long to Short Ratio: | 2.8 to 1 | 0.5 to 1 | 2.0 to 1 |
| NET POSITION TREND: | |||
| – Strength Index Score (3 Year Range Pct): | 91.2 | 11.0 | 68.1 |
| – Strength Index Reading (3 Year Range): | Bullish-Extreme | Bearish-Extreme | Bullish |
| NET POSITION MOVEMENT INDEX: | |||
| – 6-Week Change in Strength Index: | 10.7 | -8.1 | -16.1 |
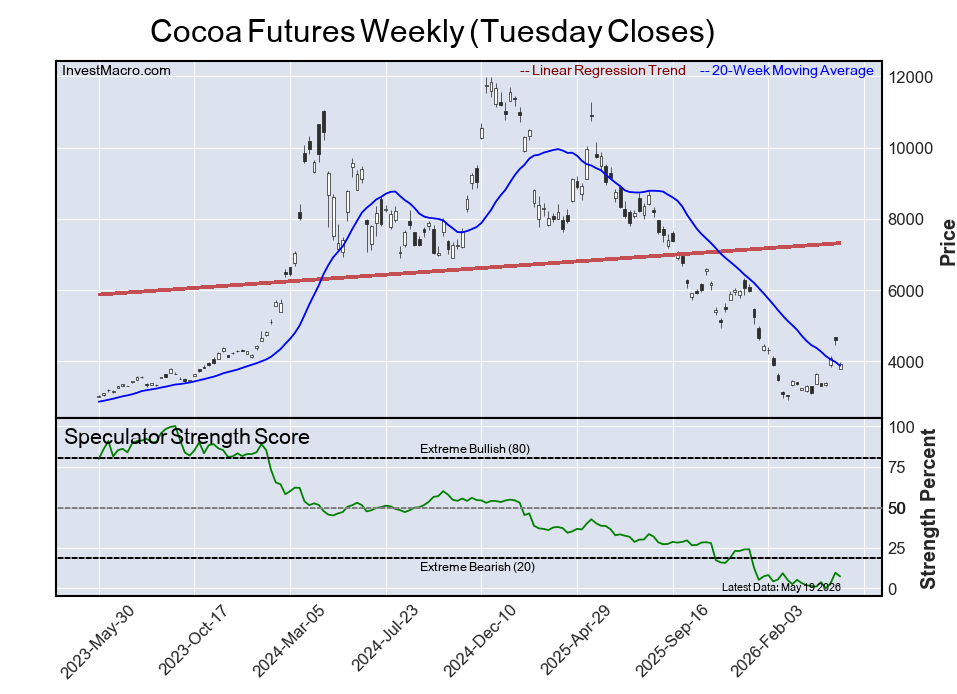
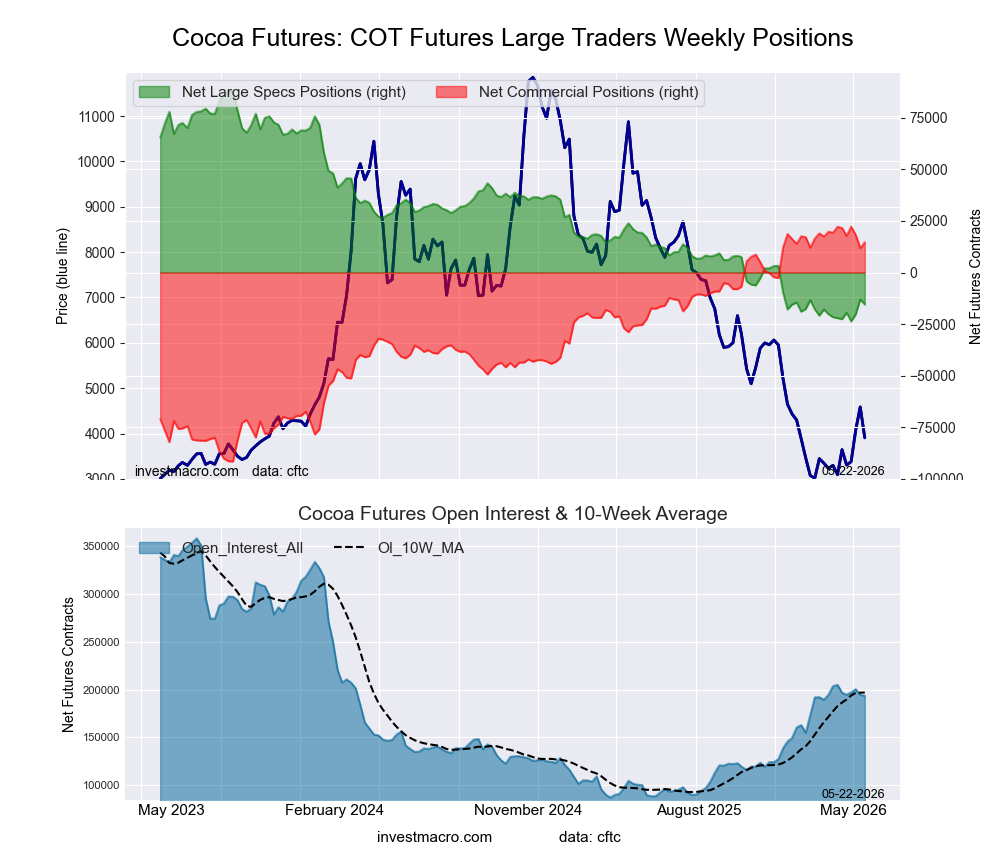
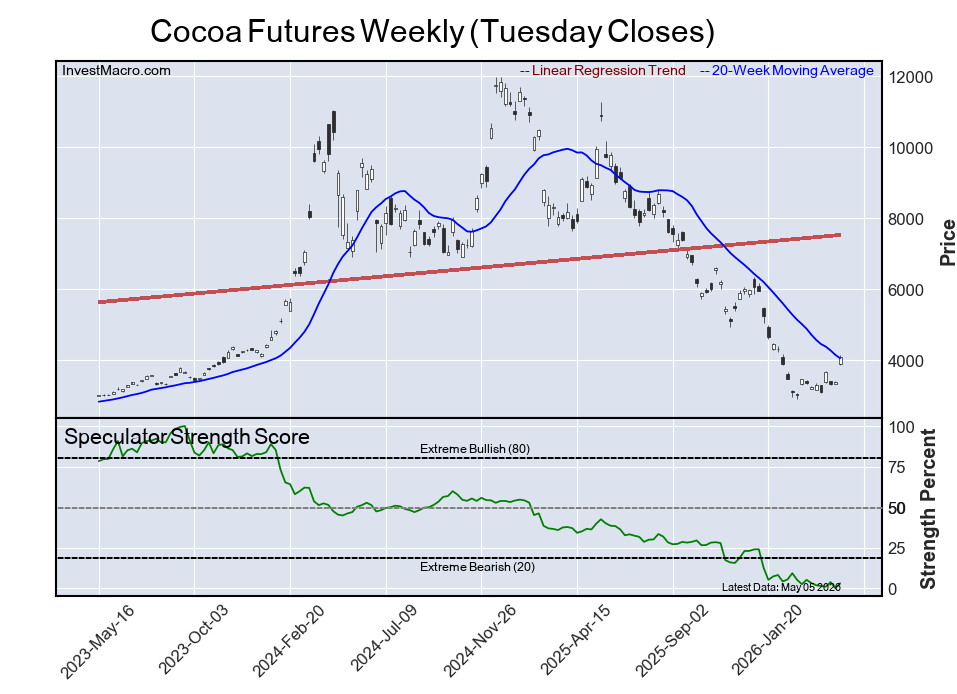
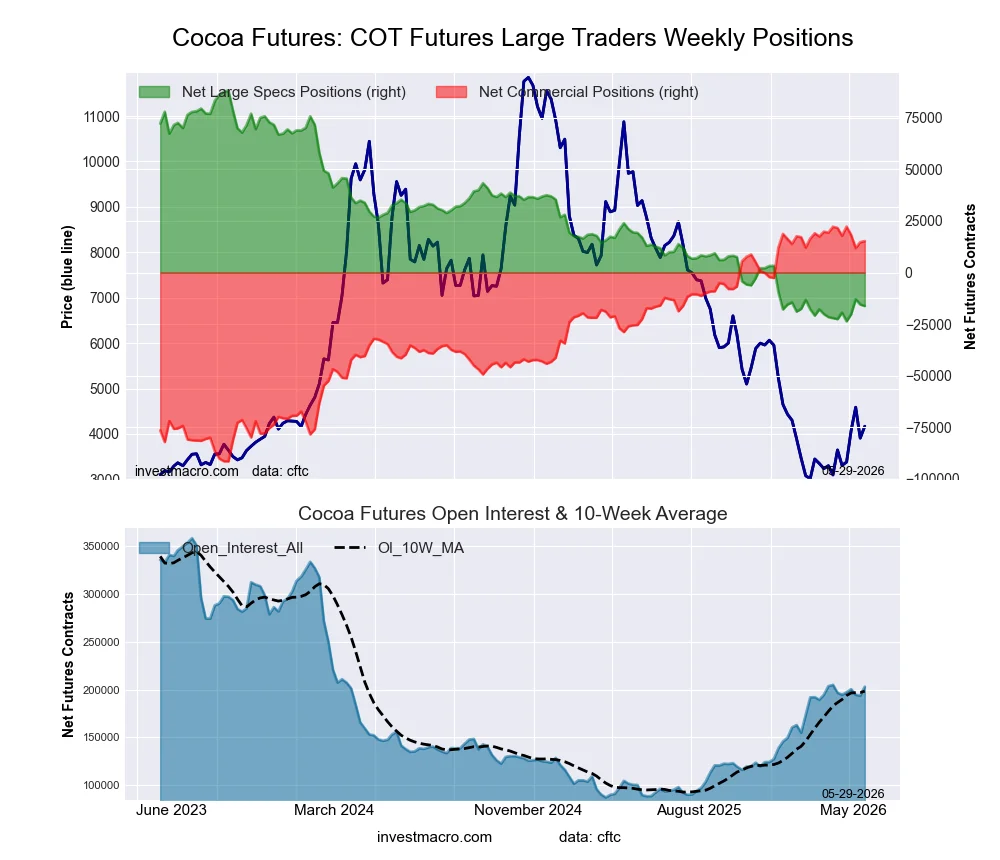
COCOA Futures:
 Positioning Notes:
- COCOA large speculator standing this week reached a net position of -16,240 contracts in the data reported through Tuesday.
- Weekly Speculator position fall of -752 contracts from the previous week which had a total of -15,488 net contracts.
- This week’s current strength score (range over the past 3 years, measured from 0 to 100) shows the speculators are currently Bearish-Extreme with a score of 6.6 percent.
- The Commercials are Bullish-Extreme with a score of 93.9 percent.
- The Small Traders (not shown in chart) are Bearish with a score of 36.3 percent.
Price Trend-Following Model: Weak Downtrend
Our weekly trend-following model classifies the current market price position as: Weak Downtrend.
| COCOA Futures Statistics | SPECULATORS | COMMERCIALS | SMALL TRADERS |
| – Percent of Open Interest Longs: | 20.3 | 52.0 | 5.2 |
| – Percent of Open Interest Shorts: | 28.3 | 44.5 | 4.7 |
| – Net Position: | -16,240 | 15,291 | 949 |
| – Gross Longs: | 41,108 | 105,544 | 10,501 |
| – Gross Shorts: | 57,348 | 90,253 | 9,552 |
| – Long to Short Ratio: | 0.7 to 1 | 1.2 to 1 | 1.1 to 1 |
| NET POSITION TREND: | |||
| – Strength Index Score (3 Year Range Pct): | 6.6 | 93.9 | 36.3 |
| – Strength Index Reading (3 Year Range): | Bearish-Extreme | Bullish-Extreme | Bearish |
| NET POSITION MOVEMENT INDEX: | |||
| – 6-Week Change in Strength Index: | 5.7 | -5.6 | -0.3 |
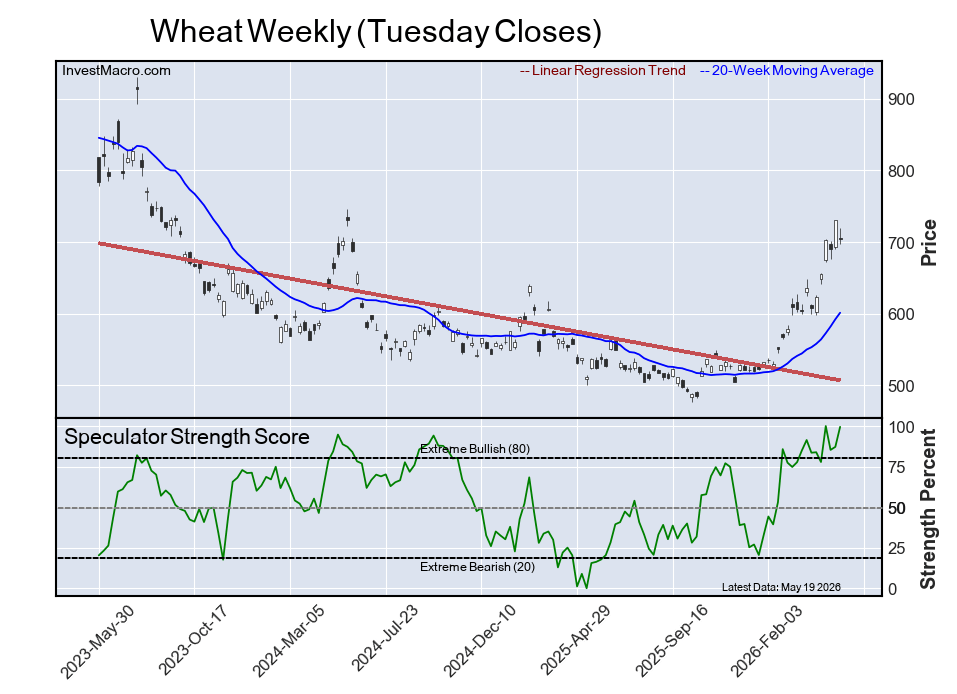
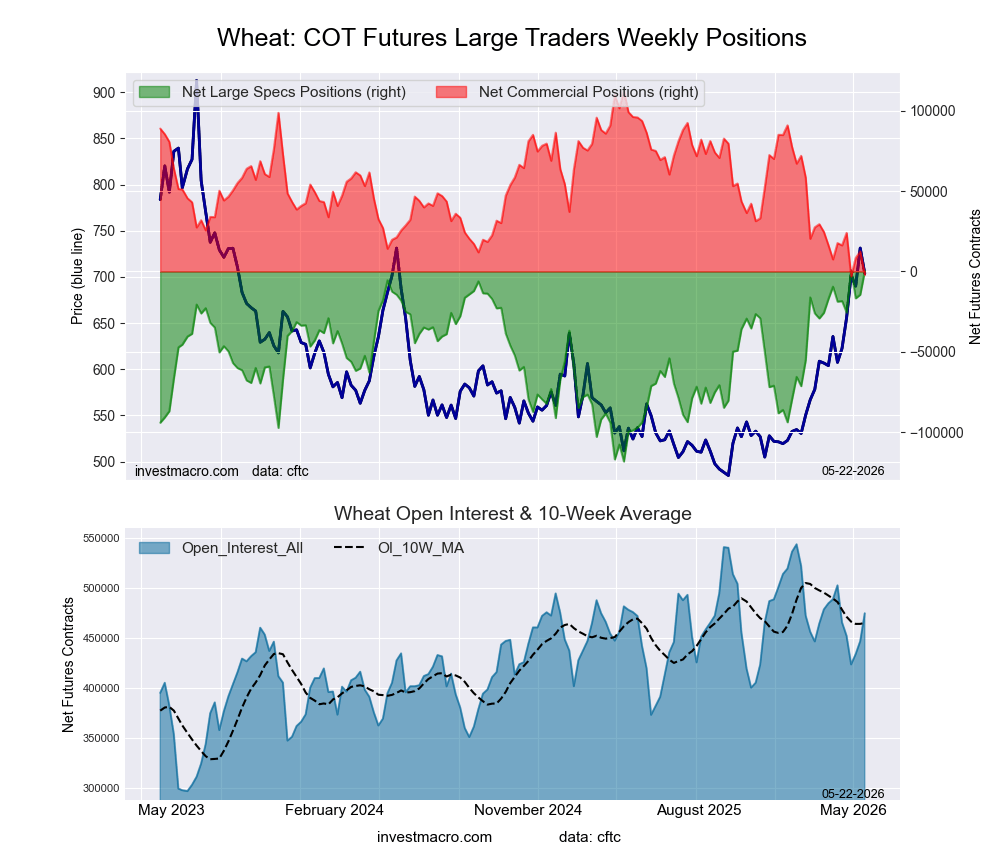
WHEAT Futures:
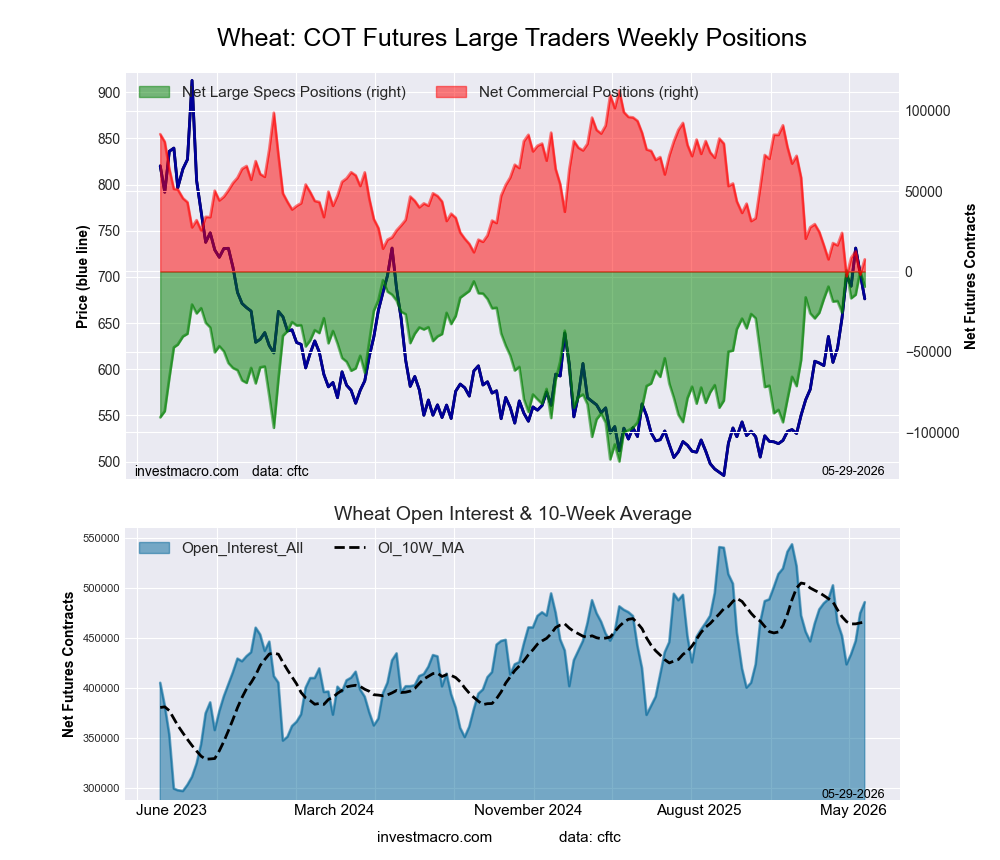 Positioning Notes:
- WHEAT large speculator standing this week reached a net position of -9,458 contracts in the data reported through Tuesday.
- Weekly Speculator position fall of -9,721 contracts from the previous week which had a total of 263 net contracts.
- This week’s current strength score (range over the past 3 years, measured from 0 to 100) shows the speculators are currently Bullish-Extreme with a score of 91.3 percent.
- The Commercials are Bearish-Extreme with a score of 9.1 percent.
- The Small Traders (not shown in chart) are Bullish with a score of 63.8 percent.
Price Trend-Following Model: Uptrend
Our weekly trend-following model classifies the current market price position as: Uptrend.
| WHEAT Futures Statistics | SPECULATORS | COMMERCIALS | SMALL TRADERS |
| – Percent of Open Interest Longs: | 29.7 | 33.4 | 7.7 |
| – Percent of Open Interest Shorts: | 31.6 | 31.9 | 7.3 |
| – Net Position: | -9,458 | 7,530 | 1,928 |
| – Gross Longs: | 144,186 | 162,357 | 37,621 |
| – Gross Shorts: | 153,644 | 154,827 | 35,693 |
| – Long to Short Ratio: | 0.9 to 1 | 1.0 to 1 | 1.1 to 1 |
| NET POSITION TREND: | |||
| – Strength Index Score (3 Year Range Pct): | 91.3 | 9.1 | 63.8 |
| – Strength Index Reading (3 Year Range): | Bullish-Extreme | Bearish-Extreme | Bullish |
| NET POSITION MOVEMENT INDEX: | |||
| – 6-Week Change in Strength Index: | 7.5 | -7.6 | -1.1 |
Article By InvestMacro – Receive our weekly COT Reports by Email
*COT Report: The COT data, released weekly to the public each Friday, is updated through the most recent Tuesday (data is 3 days old) and shows a quick view of how large speculators or non-commercials (for-profit traders) were positioned in the futures markets.
The CFTC categorizes trader positions according to commercial hedgers (traders who use futures contracts for hedging as part of the business), non-commercials (large traders who speculate to realize trading profits) and nonreportable traders (usually small traders/speculators) as well as their open interest (contracts open in the market at time of reporting).See CFTC criteria here.
All information and opinions on this website and contained in this article are for general informational purposes only and do not constitute investment advice.