
By InvestMacro | COT | Data Tables | COT Leaders | Downloads | COT Newsletter

Here are the latest charts and statistics for the Commitment of Traders (COT) reports data published by the Commodities Futures Trading Commission (CFTC).
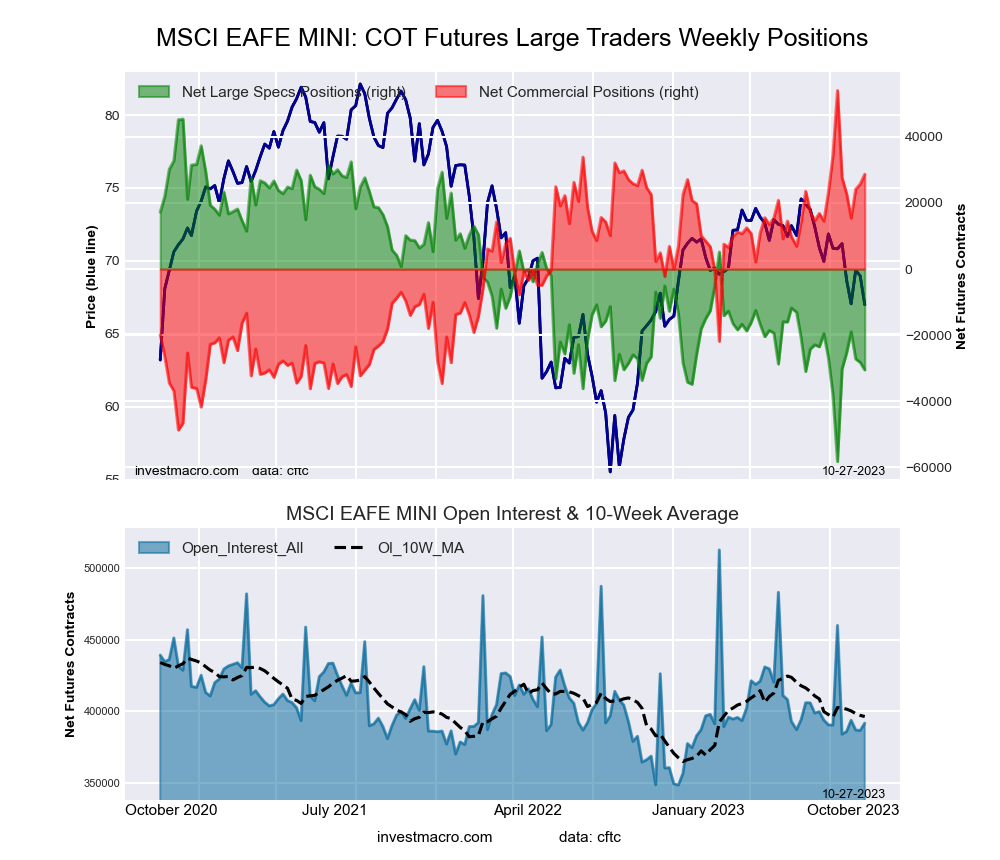
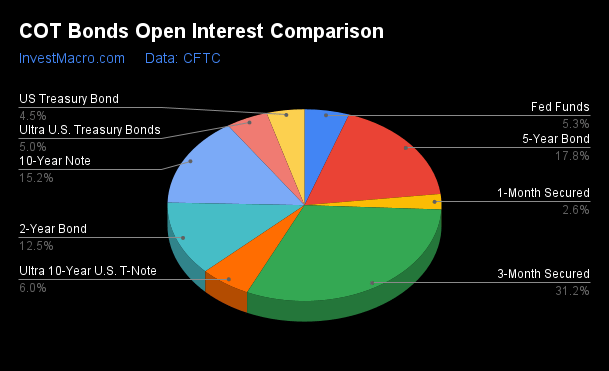
The latest COT data is updated through Tuesday October 24th and shows a quick view of how large traders (for-profit speculators and commercial hedgers) were positioned in the futures markets.
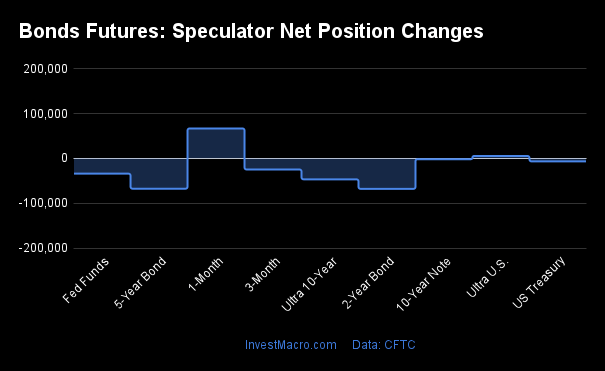
Weekly Speculator Changes led by 10-Year & 5-Year Bonds
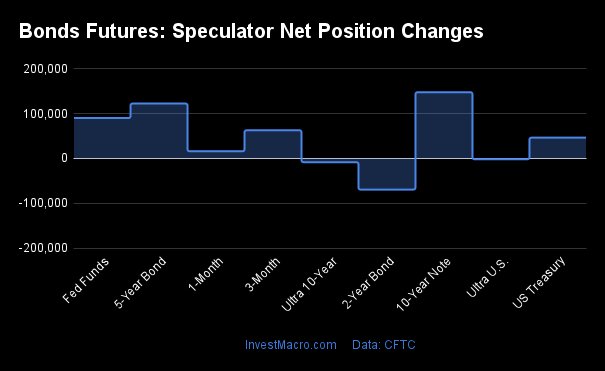
The COT bond market speculator bets were higher this week as five out of the eight bond markets we cover had higher positioning while the other three markets had lower speculator contracts.
Leading the gains for the bond markets was the 10-Year Bonds (147,378 contracts) with the 5-Year Bonds (122,184 contracts), the Fed Funds (89,836 contracts), the SOFR 3-Months (62,572 contracts) and US Treasury Bonds (46,218 contracts) also having positive weeks.
The bond markets with declines in speculator bets for the week were the 2-Year Bonds (-69,613 contracts), the Ultra 10-Year Bonds (-8,704 contracts) and the Ultra Treasury Bonds (-2,065 contracts) also seeing lower bets on the week.
| Oct-24-2023 | OI | OI-Index | Spec-Net | Spec-Index | Com-Net | COM-Index | Smalls-Net | Smalls-Index |
|---|---|---|---|---|---|---|---|---|
| SOFR-3-Months | 10,262,756 | 96 | 283,813 | 87 | -284,065 | 13 | 252 | 88 |
| FedFunds | 2,014,709 | 90 | -205,834 | 25 | 226,924 | 78 | -21,090 | 50 |
| 2-Year | 4,207,274 | 100 | -1,424,312 | 0 | 1,297,860 | 100 | 126,452 | 96 |
| Long T-Bond | 1,366,758 | 80 | -136,238 | 40 | 92,123 | 43 | 44,115 | 81 |
| 10-Year | 4,626,649 | 84 | -563,362 | 28 | 467,001 | 65 | 96,361 | 94 |
| 5-Year | 5,571,039 | 91 | -1,008,903 | 18 | 946,801 | 79 | 62,102 | 87 |
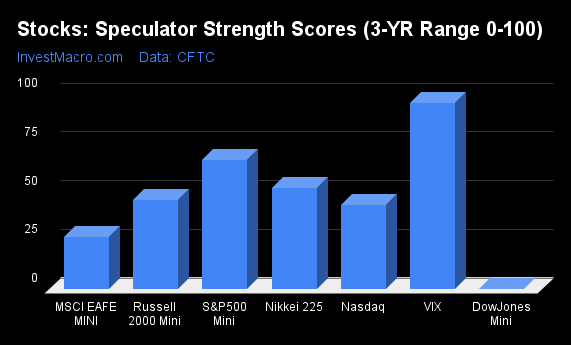
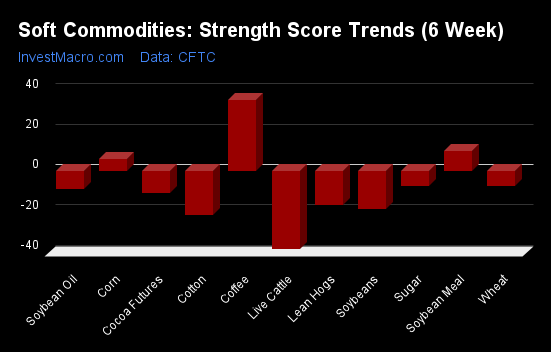
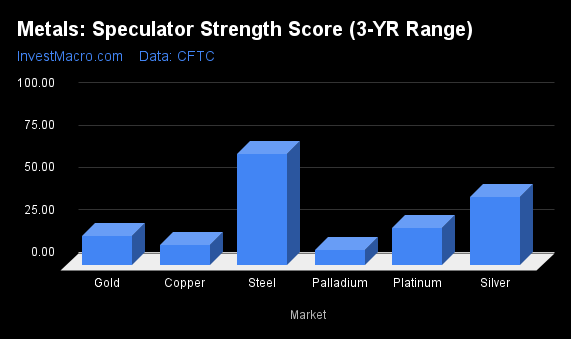
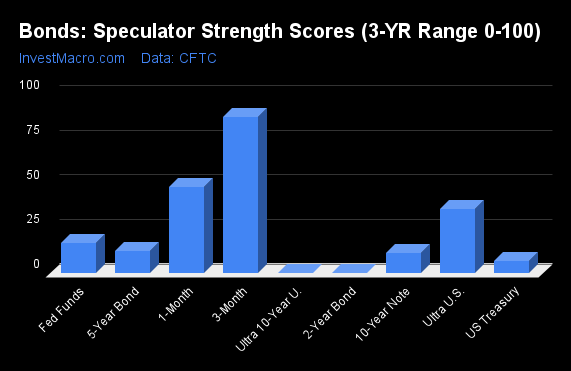
Strength Scores led by SOFR 3-Months & US Treasury Bonds
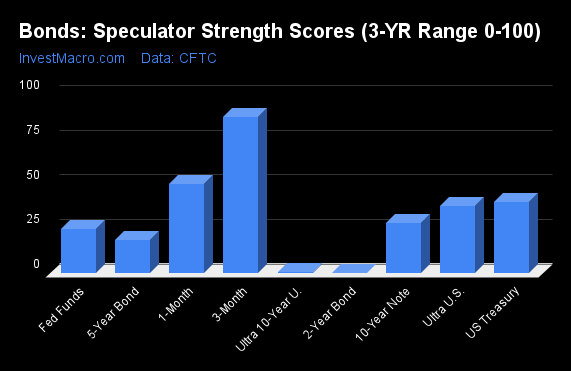
COT Strength Scores (a normalized measure of Speculator positions over a 3-Year range, from 0 to 100 where above 80 is Extreme-Bullish and below 20 is Extreme-Bearish) showed that the SOFR 3-Months (87 percent) leads the bond markets this week. The US Treasury Bonds (40 percent) and the Ultra Treasury Bonds (38 percent) come in as the next highest in the strength scores.
On the downside, the 2-Year Bonds (0 percent), the Ultra 10-Year Bonds (1 percent) and the 5-Year Bonds (18 percent) come in at the lowest strength levels currently and are all in Extreme-Bearish territory (below 20 percent).
Strength Statistics:
Fed Funds (24.6 percent) vs Fed Funds previous week (5.4 percent)
2-Year Bond (0.0 percent) vs 2-Year Bond previous week (4.6 percent)
5-Year Bond (18.3 percent) vs 5-Year Bond previous week (9.3 percent)
10-Year Bond (27.8 percent) vs 10-Year Bond previous week (13.5 percent)
Ultra 10-Year Bond (0.7 percent) vs Ultra 10-Year Bond previous week (2.3 percent)
US Treasury Bond (39.5 percent) vs US Treasury Bond previous week (24.3 percent)
Ultra US Treasury Bond (37.5 percent) vs Ultra US Treasury Bond previous week (38.4 percent)
SOFR 3-Months (87.1 percent) vs SOFR 3-Months previous week (83.3 percent)
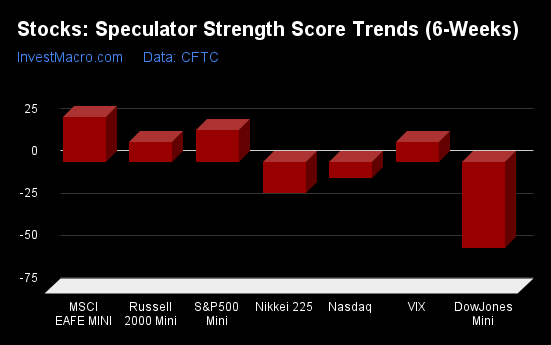
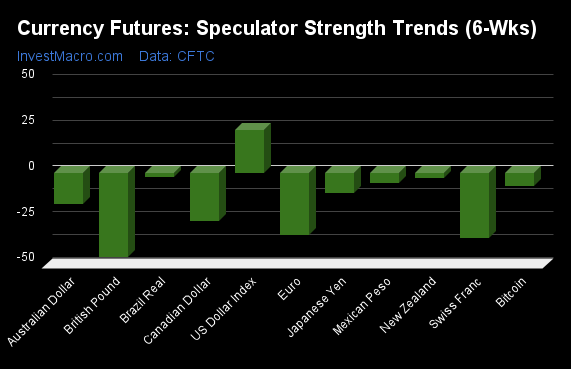
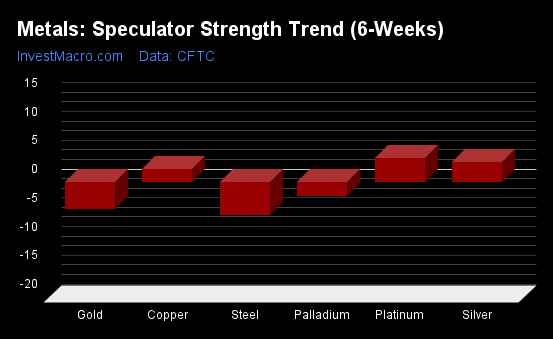
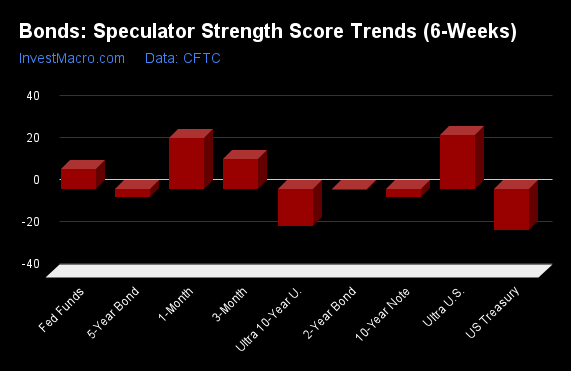
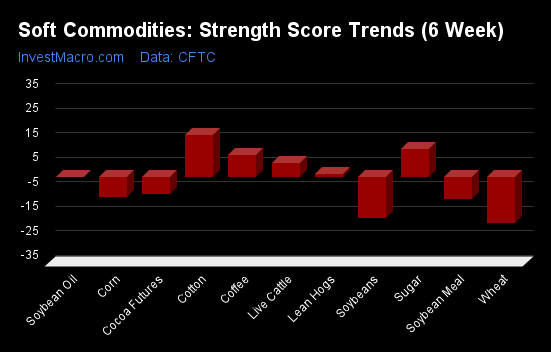
US Treasury Bonds & 10-Year Bonds top the 6-Week Strength Trends
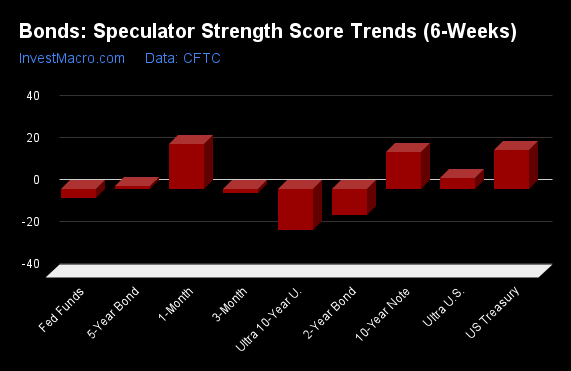
COT Strength Score Trends (or move index, calculates the 6-week changes in strength scores) showed that the US Treasury Bonds (19 percent) and the 10-Year Bonds (18 percent) lead the past six weeks trends for bonds. The Ultra Treasury Bonds (5 percent) and the are the next highest positive movers in the latest trends data.
The Ultra 10-Year Bonds (-20 percent) and the 2-Year Bonds (-12 percent) lead the downside trend scores this week.
Strength Trend Statistics:
Fed Funds (-4.5 percent) vs Fed Funds previous week (-31.8 percent)
2-Year Bond (-12.2 percent) vs 2-Year Bond previous week (-9.0 percent)
5-Year Bond (1.6 percent) vs 5-Year Bond previous week (-5.5 percent)
10-Year Bond (17.5 percent) vs 10-Year Bond previous week (7.8 percent)
Ultra 10-Year Bond (-19.6 percent) vs Ultra 10-Year Bond previous week (-12.2 percent)
US Treasury Bond (18.6 percent) vs US Treasury Bond previous week (5.2 percent)
Ultra US Treasury Bond (5.4 percent) vs Ultra US Treasury Bond previous week (6.8 percent)
SOFR 3-Months (-2.0 percent) vs SOFR 3-Months previous week (-3.1 percent)
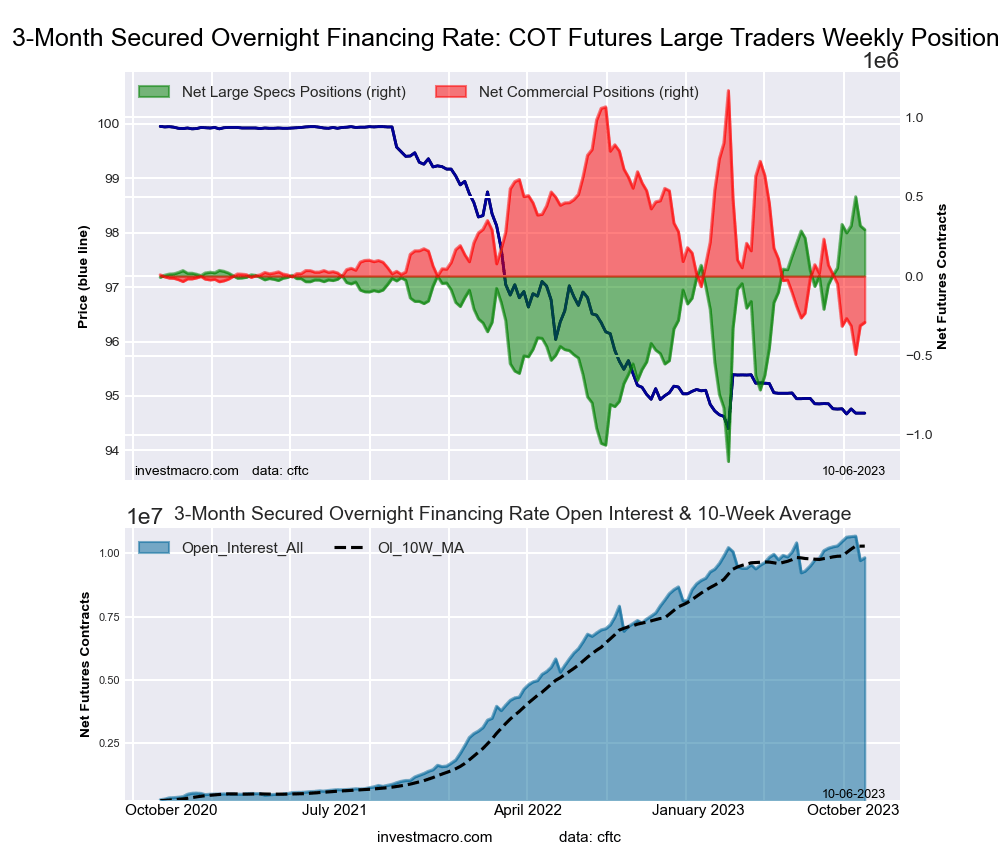
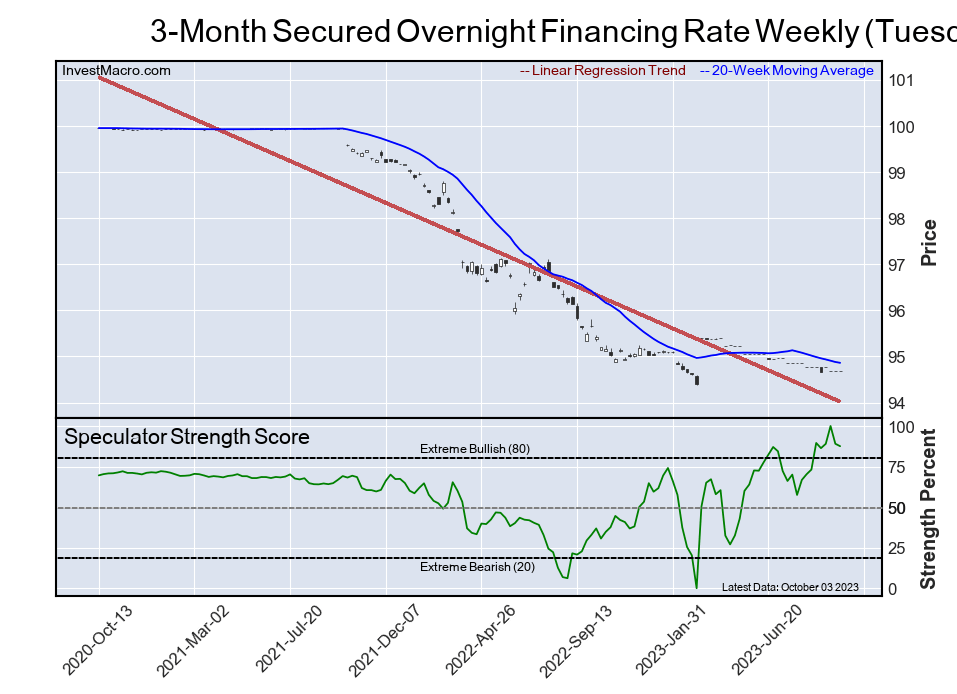
Secured Overnight Financing Rate (3-Month) Futures:
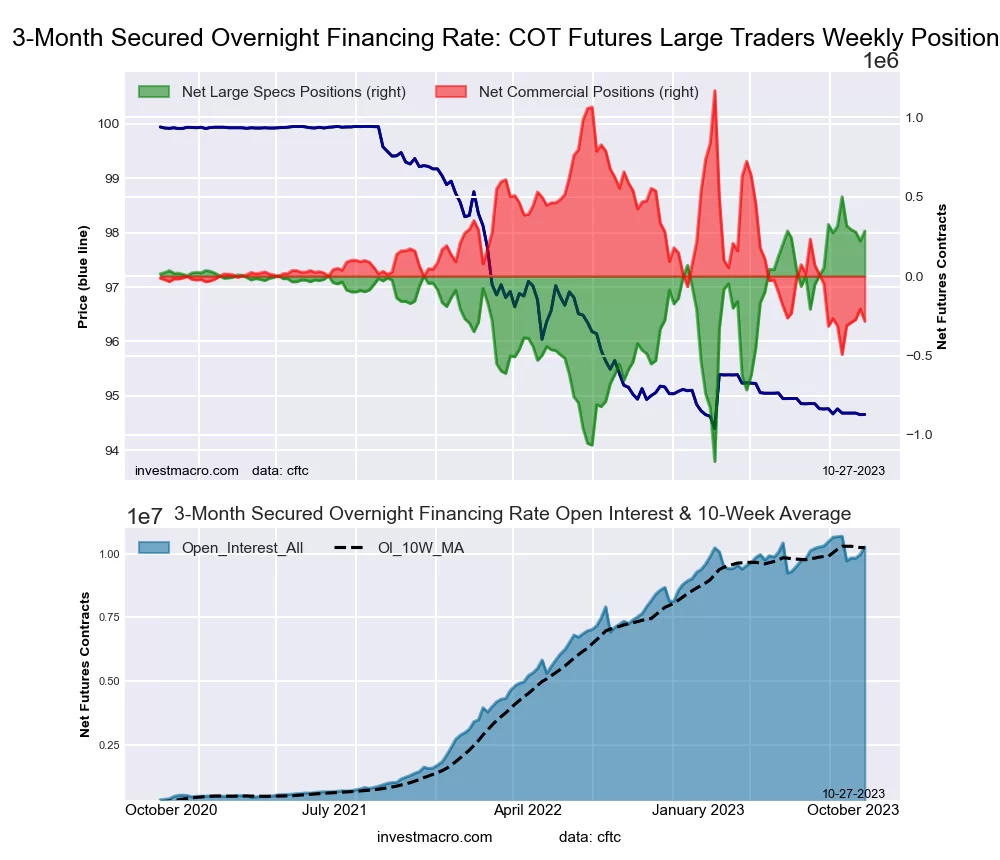 The Secured Overnight Financing Rate (3-Month) large speculator standing this week equaled a net position of 283,813 contracts in the data reported through Tuesday. This was a weekly lift of 62,572 contracts from the previous week which had a total of 221,241 net contracts.
This week’s current strength score (the trader positioning range over the past three years, measured from 0 to 100) shows the speculators are currently Bullish-Extreme with a score of 87.1 percent. The commercials are Bearish-Extreme with a score of 12.6 percent and the small traders (not shown in chart) are Bullish-Extreme with a score of 88.0 percent.
Price Trend-Following Model: Weak Uptrend
Our weekly trend-following model classifies the current market price position as: Weak Uptrend. The current action for the model is considered to be: Hold – Maintain Long Position.
| SOFR 3-Months Statistics | SPECULATORS | COMMERCIALS | SMALL TRADERS |
| – Percent of Open Interest Longs: | 20.4 | 56.2 | 0.4 |
| – Percent of Open Interest Shorts: | 17.7 | 59.0 | 0.4 |
| – Net Position: | 283,813 | -284,065 | 252 |
| – Gross Longs: | 2,097,645 | 5,767,009 | 39,391 |
| – Gross Shorts: | 1,813,832 | 6,051,074 | 39,139 |
| – Long to Short Ratio: | 1.2 to 1 | 1.0 to 1 | 1.0 to 1 |
| NET POSITION TREND: | |||
| – Strength Index Score (3 Year Range Pct): | 87.1 | 12.6 | 88.0 |
| – Strength Index Reading (3 Year Range): | Bullish-Extreme | Bearish-Extreme | Bullish-Extreme |
| NET POSITION MOVEMENT INDEX: | |||
| – 6-Week Change in Strength Index: | -2.0 | 1.8 | 1.8 |
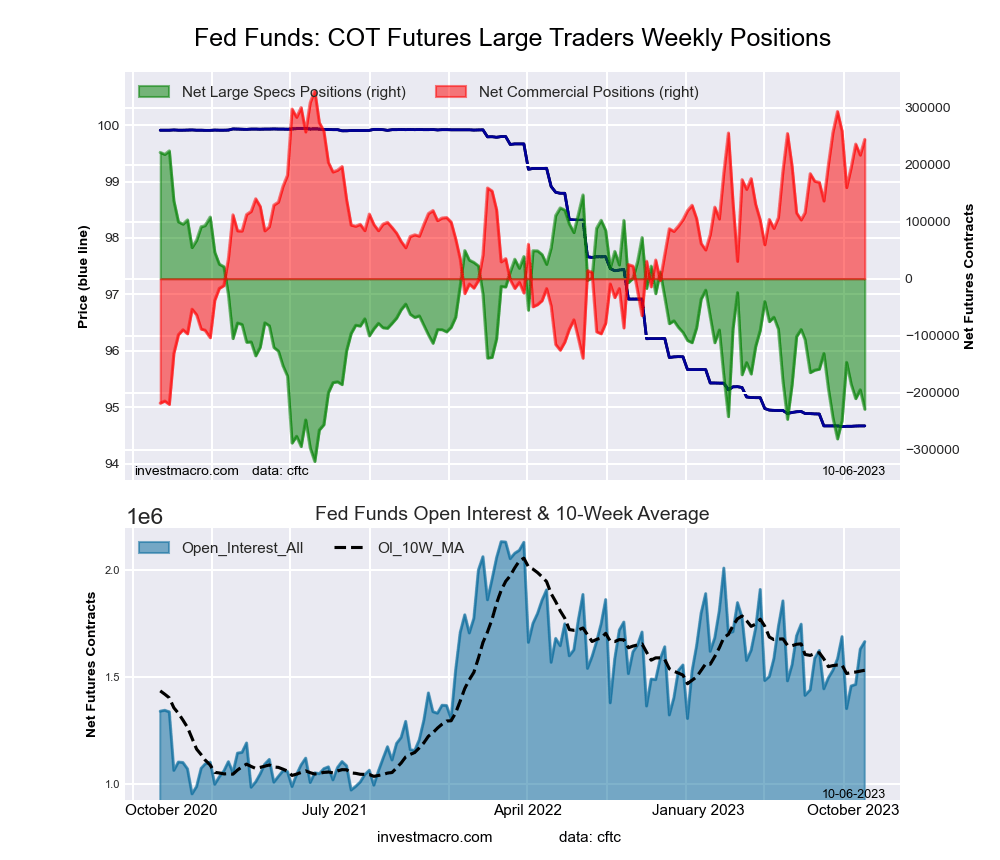
30-Day Federal Funds Futures:
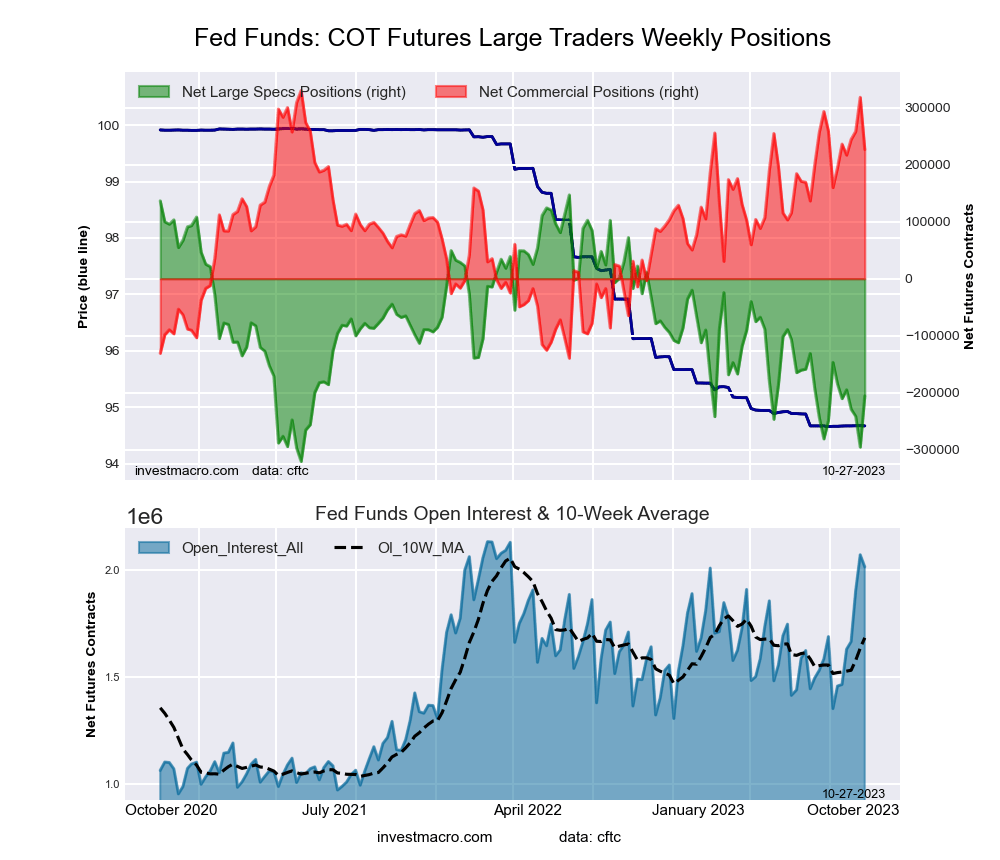 The 30-Day Federal Funds large speculator standing this week equaled a net position of -205,834 contracts in the data reported through Tuesday. This was a weekly increase of 89,836 contracts from the previous week which had a total of -295,670 net contracts.
This week’s current strength score (the trader positioning range over the past three years, measured from 0 to 100) shows the speculators are currently Bearish with a score of 24.6 percent. The commercials are Bullish with a score of 78.0 percent and the small traders (not shown in chart) are Bearish with a score of 49.6 percent.
Price Trend-Following Model: Downtrend
Our weekly trend-following model classifies the current market price position as: Downtrend. The current action for the model is considered to be: Hold – Maintain Short Position.
| 30-Day Federal Funds Statistics | SPECULATORS | COMMERCIALS | SMALL TRADERS |
| – Percent of Open Interest Longs: | 8.0 | 74.8 | 1.7 |
| – Percent of Open Interest Shorts: | 18.2 | 63.5 | 2.7 |
| – Net Position: | -205,834 | 226,924 | -21,090 |
| – Gross Longs: | 160,615 | 1,506,971 | 33,662 |
| – Gross Shorts: | 366,449 | 1,280,047 | 54,752 |
| – Long to Short Ratio: | 0.4 to 1 | 1.2 to 1 | 0.6 to 1 |
| NET POSITION TREND: | |||
| – Strength Index Score (3 Year Range Pct): | 24.6 | 78.0 | 49.6 |
| – Strength Index Reading (3 Year Range): | Bearish | Bullish | Bearish |
| NET POSITION MOVEMENT INDEX: | |||
| – 6-Week Change in Strength Index: | -4.5 | 6.8 | -21.6 |
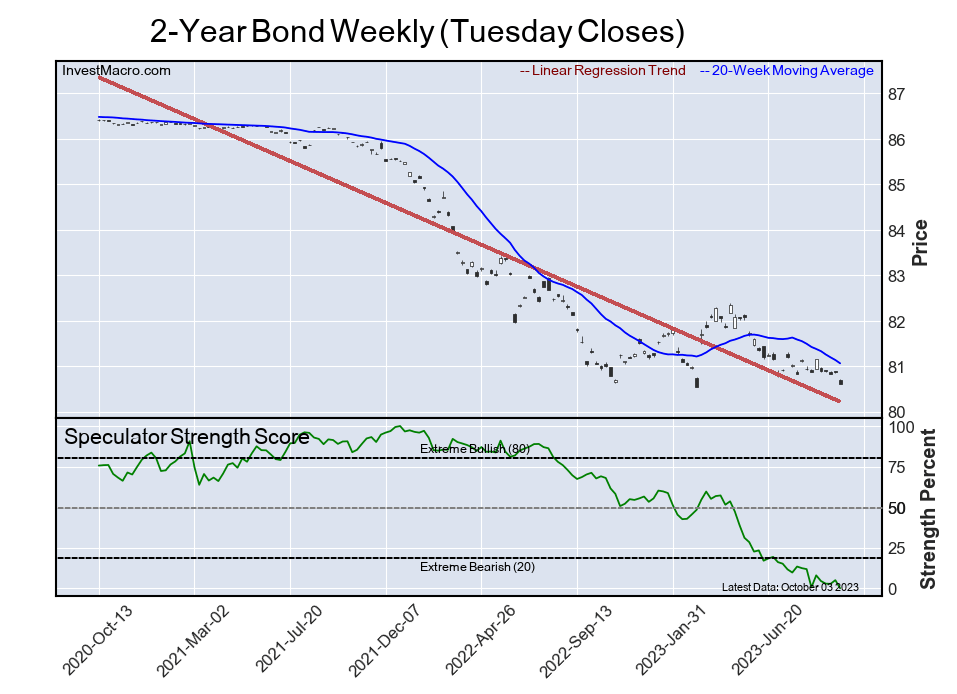
2-Year Treasury Note Futures:
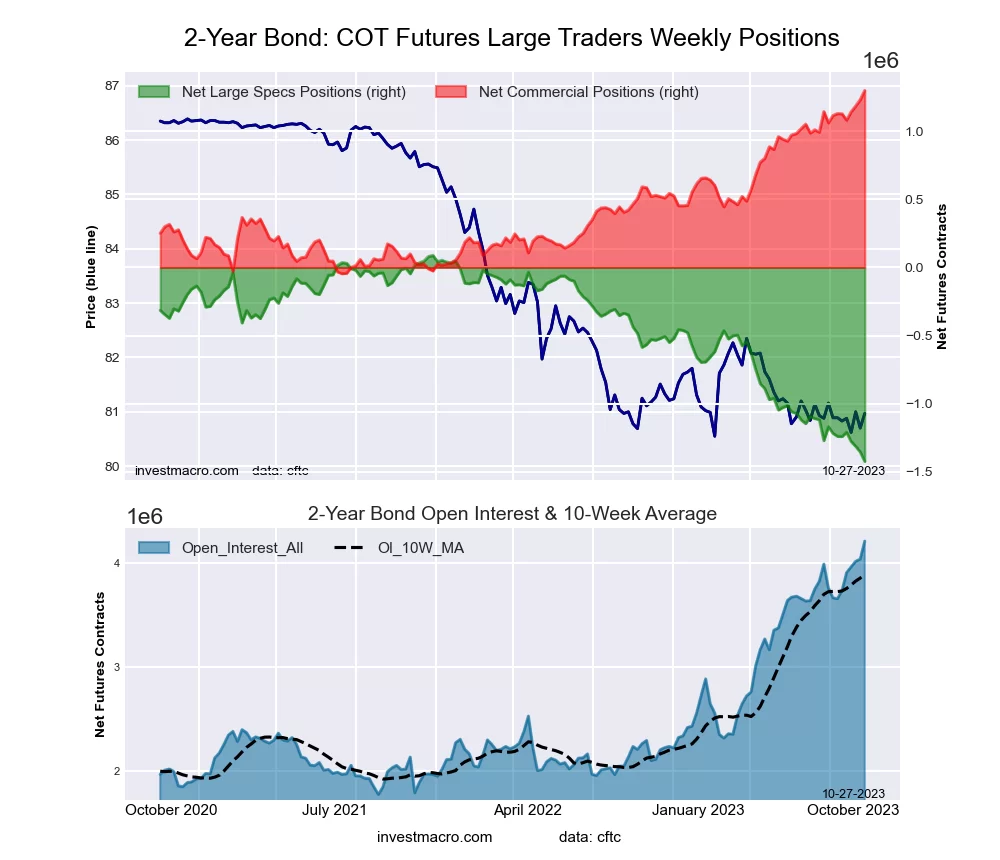 The 2-Year Treasury Note large speculator standing this week equaled a net position of -1,424,312 contracts in the data reported through Tuesday. This was a weekly lowering of -69,613 contracts from the previous week which had a total of -1,354,699 net contracts.
This week’s current strength score (the trader positioning range over the past three years, measured from 0 to 100) shows the speculators are currently Bearish-Extreme with a score of 0.0 percent. The commercials are Bullish-Extreme with a score of 100.0 percent and the small traders (not shown in chart) are Bullish-Extreme with a score of 95.9 percent.
Price Trend-Following Model: Weak Downtrend
Our weekly trend-following model classifies the current market price position as: Weak Downtrend. The current action for the model is considered to be: Hold – Maintain Short Position.
| 2-Year Treasury Note Statistics | SPECULATORS | COMMERCIALS | SMALL TRADERS |
| – Percent of Open Interest Longs: | 10.2 | 82.1 | 6.3 |
| – Percent of Open Interest Shorts: | 44.1 | 51.2 | 3.3 |
| – Net Position: | -1,424,312 | 1,297,860 | 126,452 |
| – Gross Longs: | 429,978 | 3,452,942 | 267,147 |
| – Gross Shorts: | 1,854,290 | 2,155,082 | 140,695 |
| – Long to Short Ratio: | 0.2 to 1 | 1.6 to 1 | 1.9 to 1 |
| NET POSITION TREND: | |||
| – Strength Index Score (3 Year Range Pct): | 0.0 | 100.0 | 95.9 |
| – Strength Index Reading (3 Year Range): | Bearish-Extreme | Bullish-Extreme | Bullish-Extreme |
| NET POSITION MOVEMENT INDEX: | |||
| – 6-Week Change in Strength Index: | -12.2 | 12.6 | 6.1 |
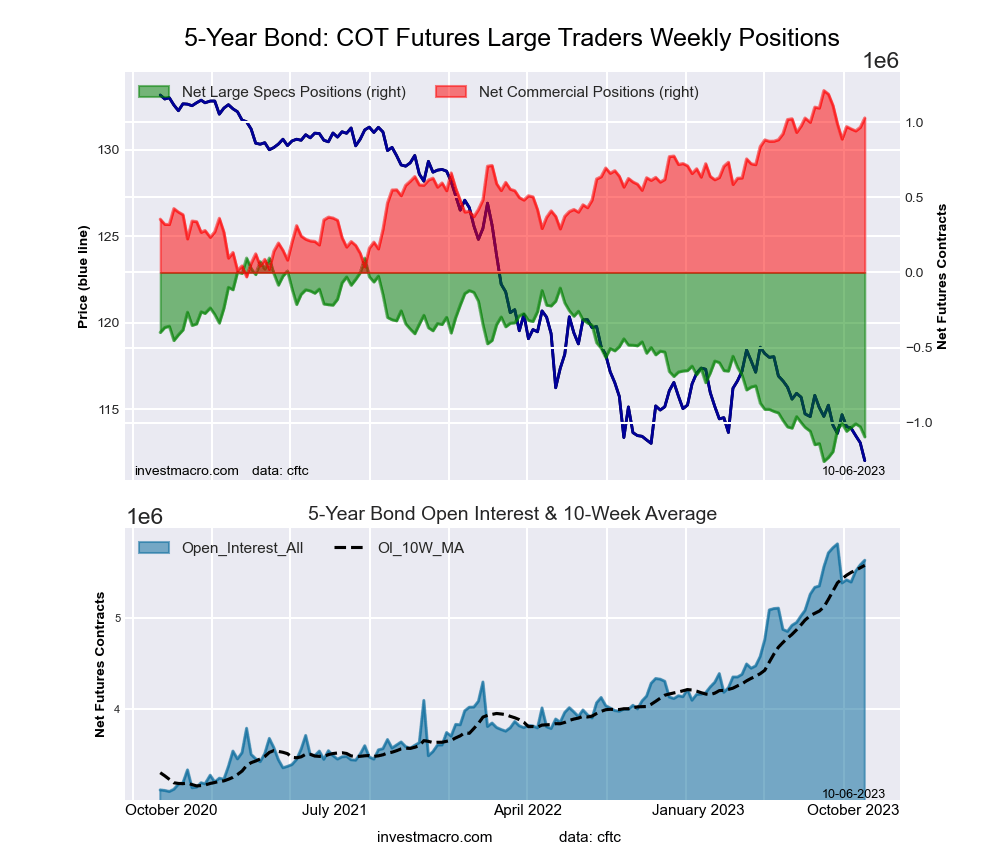
5-Year Treasury Note Futures:
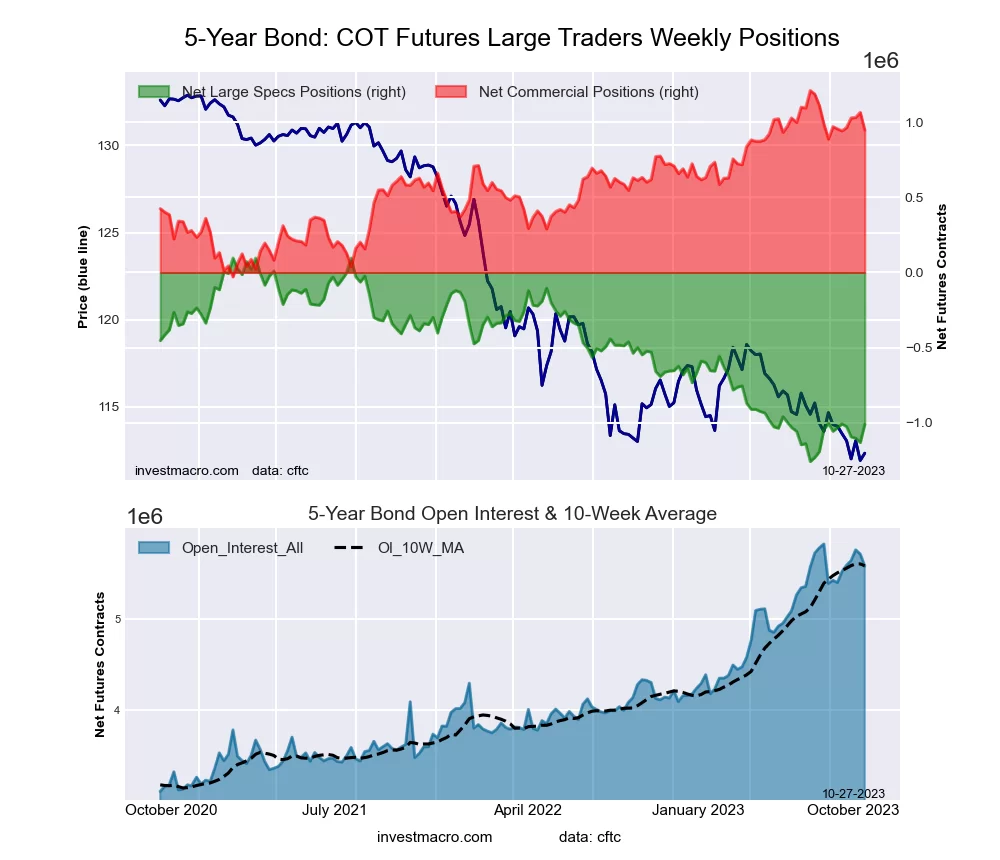 The 5-Year Treasury Note large speculator standing this week equaled a net position of -1,008,903 contracts in the data reported through Tuesday. This was a weekly rise of 122,184 contracts from the previous week which had a total of -1,131,087 net contracts.
This week’s current strength score (the trader positioning range over the past three years, measured from 0 to 100) shows the speculators are currently Bearish-Extreme with a score of 18.3 percent. The commercials are Bullish with a score of 78.8 percent and the small traders (not shown in chart) are Bullish-Extreme with a score of 86.5 percent.
Price Trend-Following Model: Downtrend
Our weekly trend-following model classifies the current market price position as: Downtrend. The current action for the model is considered to be: Hold – Maintain Short Position.
| 5-Year Treasury Note Statistics | SPECULATORS | COMMERCIALS | SMALL TRADERS |
| – Percent of Open Interest Longs: | 9.4 | 82.0 | 7.1 |
| – Percent of Open Interest Shorts: | 27.5 | 65.0 | 6.0 |
| – Net Position: | -1,008,903 | 946,801 | 62,102 |
| – Gross Longs: | 524,737 | 4,567,066 | 395,064 |
| – Gross Shorts: | 1,533,640 | 3,620,265 | 332,962 |
| – Long to Short Ratio: | 0.3 to 1 | 1.3 to 1 | 1.2 to 1 |
| NET POSITION TREND: | |||
| – Strength Index Score (3 Year Range Pct): | 18.3 | 78.8 | 86.5 |
| – Strength Index Reading (3 Year Range): | Bearish-Extreme | Bullish | Bullish-Extreme |
| NET POSITION MOVEMENT INDEX: | |||
| – 6-Week Change in Strength Index: | 1.6 | -0.6 | -3.5 |
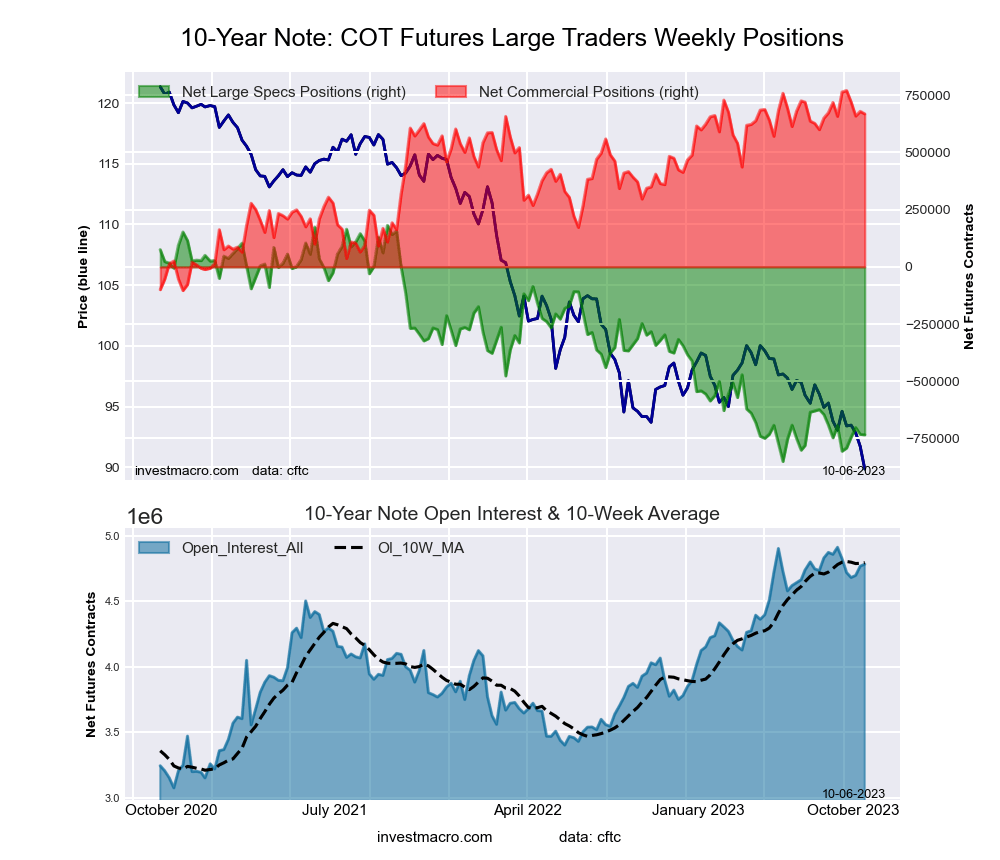
10-Year Treasury Note Futures:
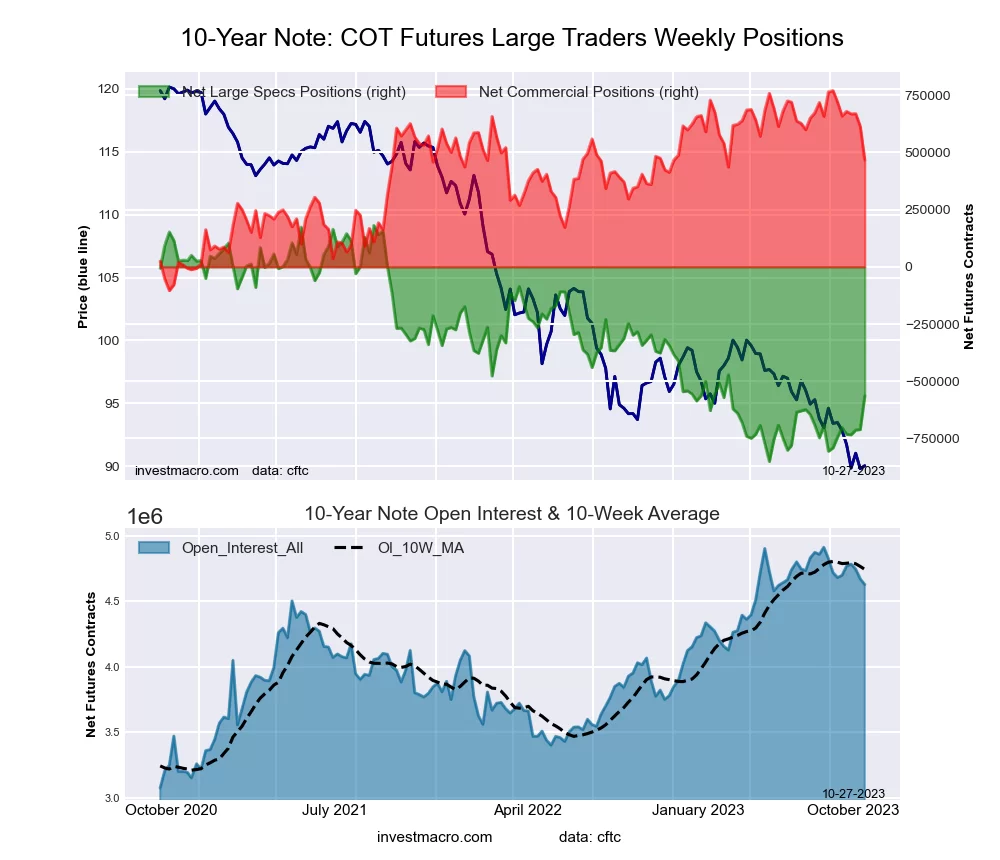 The 10-Year Treasury Note large speculator standing this week equaled a net position of -563,362 contracts in the data reported through Tuesday. This was a weekly lift of 147,378 contracts from the previous week which had a total of -710,740 net contracts.
This week’s current strength score (the trader positioning range over the past three years, measured from 0 to 100) shows the speculators are currently Bearish with a score of 27.8 percent. The commercials are Bullish with a score of 65.3 percent and the small traders (not shown in chart) are Bullish-Extreme with a score of 94.5 percent.
Price Trend-Following Model: Strong Downtrend
Our weekly trend-following model classifies the current market price position as: Strong Downtrend. The current action for the model is considered to be: Hold – Maintain Short Position.
| 10-Year Treasury Note Statistics | SPECULATORS | COMMERCIALS | SMALL TRADERS |
| – Percent of Open Interest Longs: | 11.7 | 77.0 | 9.5 |
| – Percent of Open Interest Shorts: | 23.9 | 66.9 | 7.4 |
| – Net Position: | -563,362 | 467,001 | 96,361 |
| – Gross Longs: | 542,324 | 3,562,693 | 438,802 |
| – Gross Shorts: | 1,105,686 | 3,095,692 | 342,441 |
| – Long to Short Ratio: | 0.5 to 1 | 1.2 to 1 | 1.3 to 1 |
| NET POSITION TREND: | |||
| – Strength Index Score (3 Year Range Pct): | 27.8 | 65.3 | 94.5 |
| – Strength Index Reading (3 Year Range): | Bearish | Bullish | Bullish-Extreme |
| NET POSITION MOVEMENT INDEX: | |||
| – 6-Week Change in Strength Index: | 17.5 | -29.0 | 15.7 |
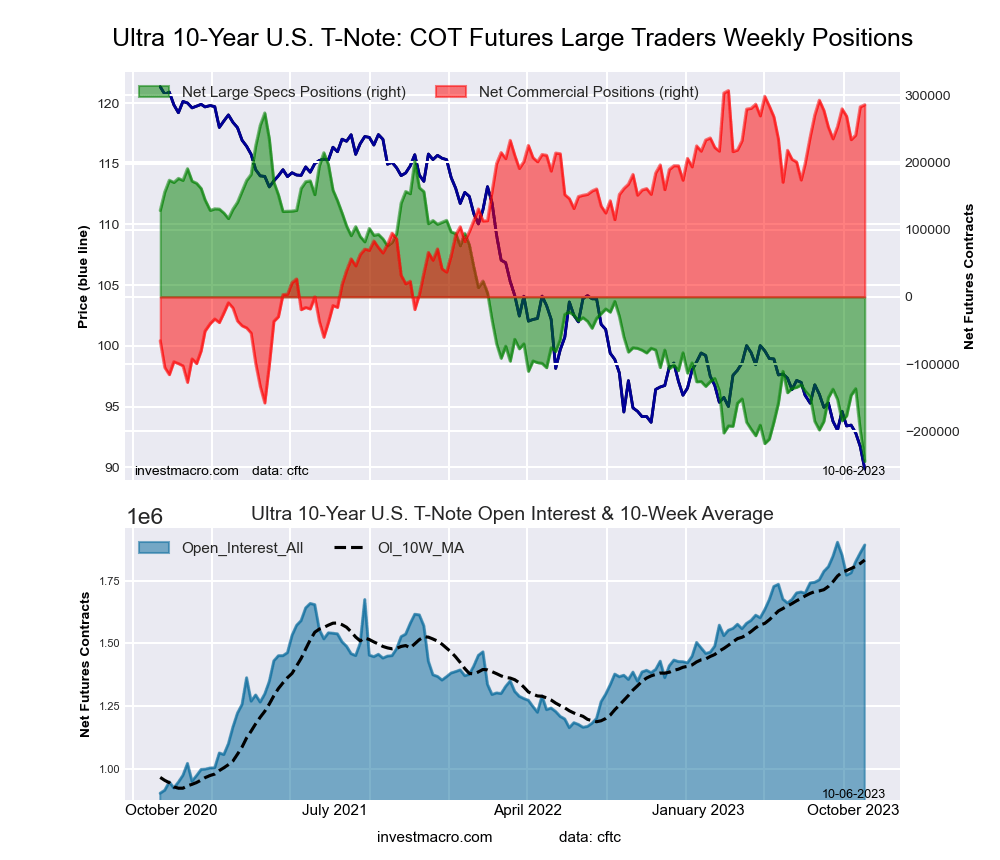
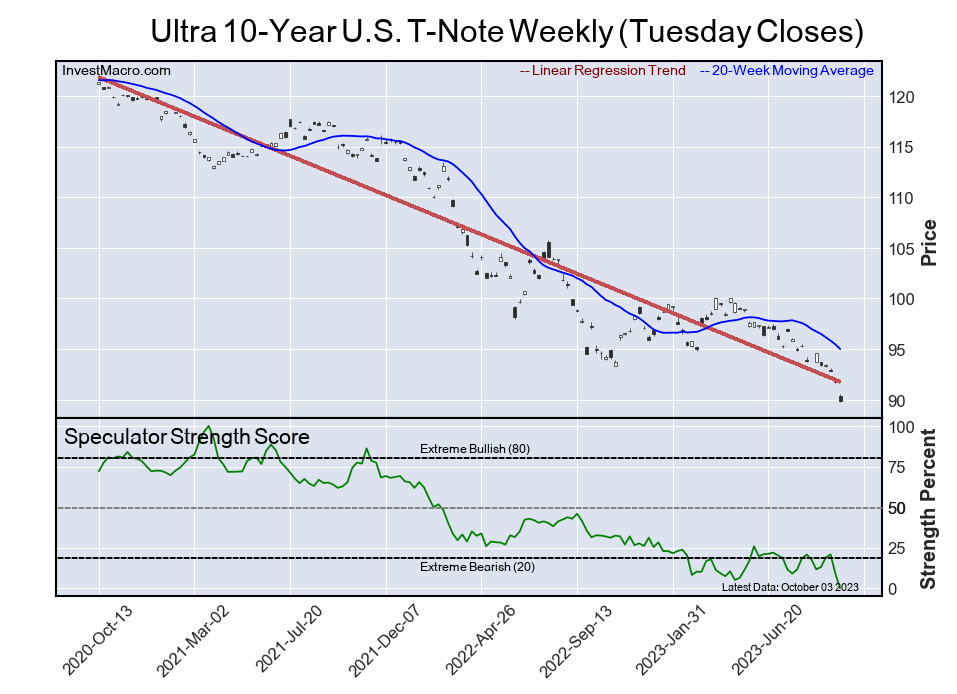
Ultra 10-Year Notes Futures:
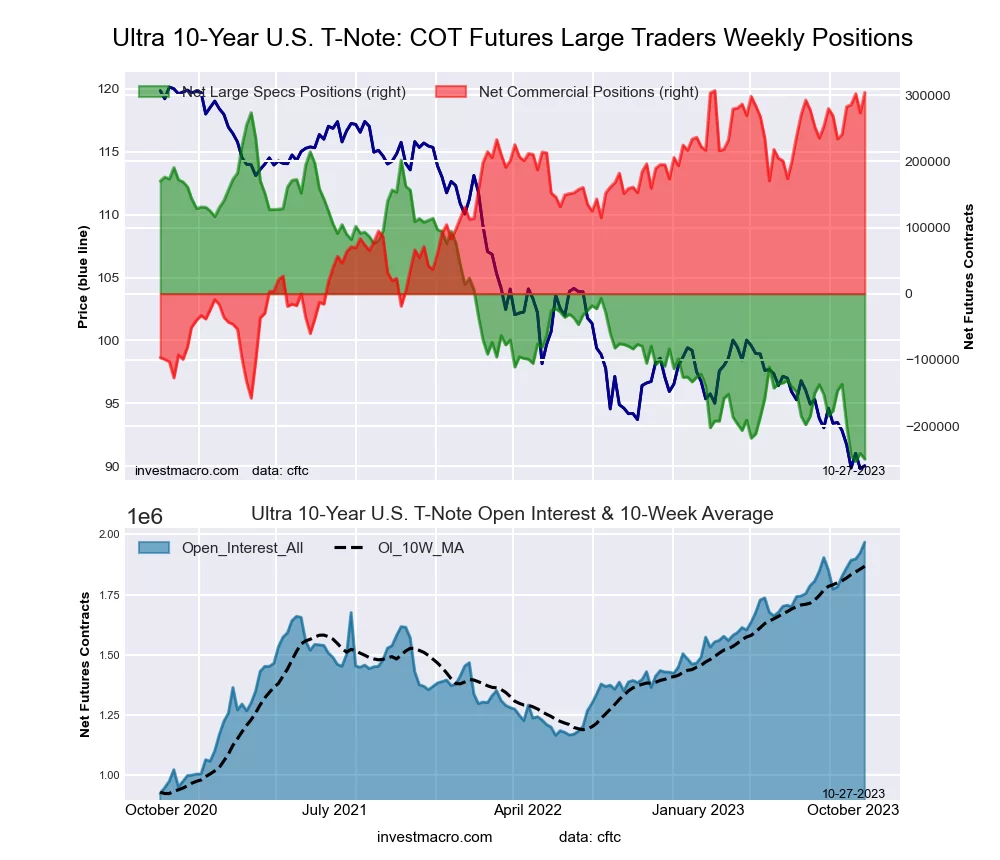 The Ultra 10-Year Notes large speculator standing this week equaled a net position of -249,869 contracts in the data reported through Tuesday. This was a weekly reduction of -8,704 contracts from the previous week which had a total of -241,165 net contracts.
This week’s current strength score (the trader positioning range over the past three years, measured from 0 to 100) shows the speculators are currently Bearish-Extreme with a score of 0.7 percent. The commercials are Bullish-Extreme with a score of 99.4 percent and the small traders (not shown in chart) are Bullish-Extreme with a score of 81.8 percent.
Price Trend-Following Model: Weak Uptrend
Our weekly trend-following model classifies the current market price position as: Weak Uptrend. The current action for the model is considered to be: Hold – Maintain Long Position.
| Ultra 10-Year Notes Statistics | SPECULATORS | COMMERCIALS | SMALL TRADERS |
| – Percent of Open Interest Longs: | 9.9 | 77.4 | 10.8 |
| – Percent of Open Interest Shorts: | 22.6 | 62.0 | 13.5 |
| – Net Position: | -249,869 | 304,036 | -54,167 |
| – Gross Longs: | 194,392 | 1,523,392 | 212,339 |
| – Gross Shorts: | 444,261 | 1,219,356 | 266,506 |
| – Long to Short Ratio: | 0.4 to 1 | 1.2 to 1 | 0.8 to 1 |
| NET POSITION TREND: | |||
| – Strength Index Score (3 Year Range Pct): | 0.7 | 99.4 | 81.8 |
| – Strength Index Reading (3 Year Range): | Bearish-Extreme | Bullish-Extreme | Bullish-Extreme |
| NET POSITION MOVEMENT INDEX: | |||
| – 6-Week Change in Strength Index: | -19.6 | 15.1 | 19.8 |
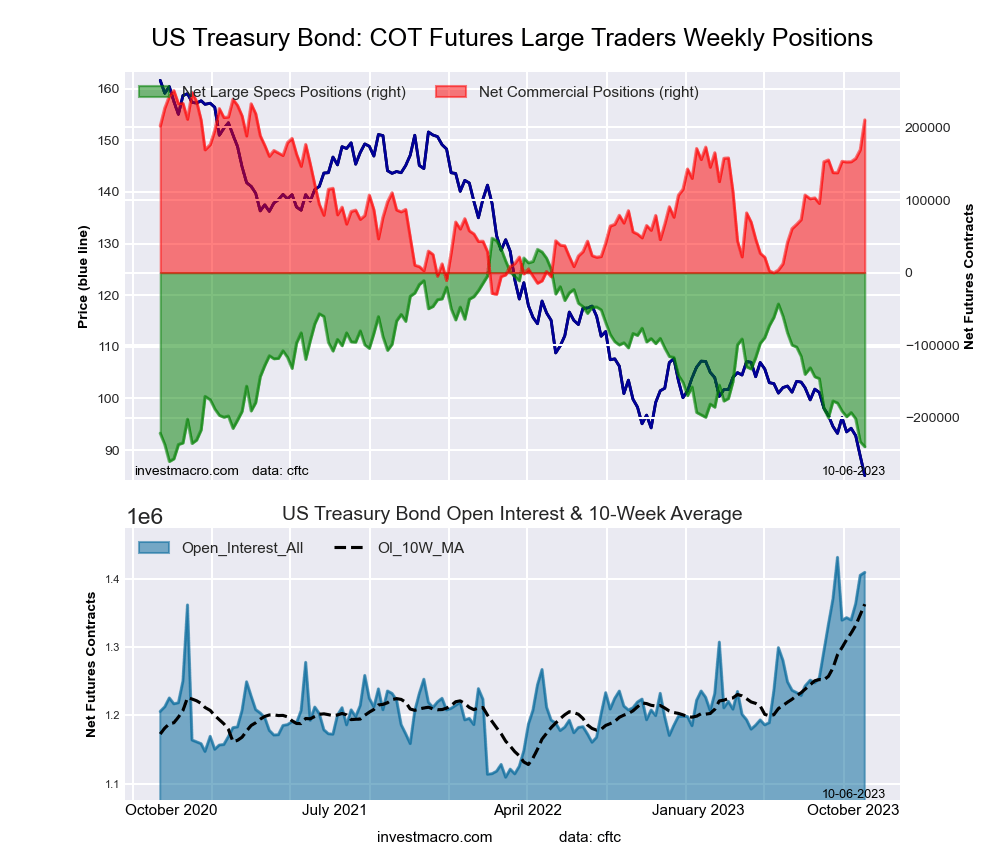
US Treasury Bonds Futures:
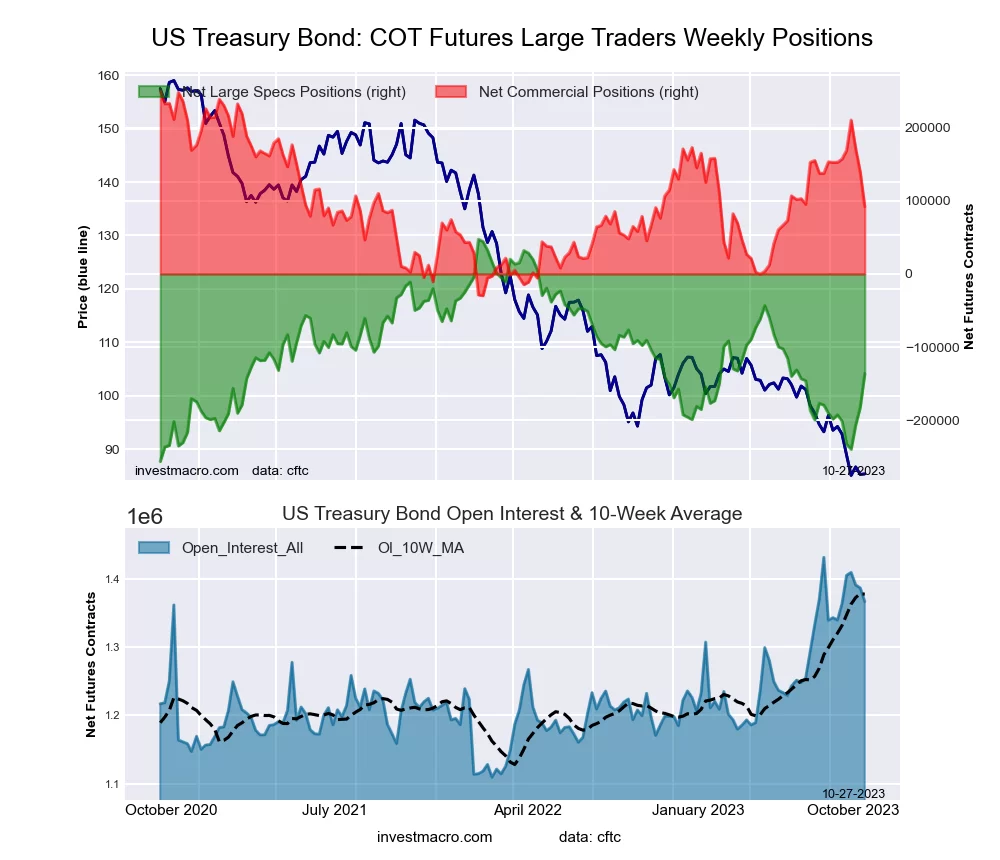 The US Treasury Bonds large speculator standing this week equaled a net position of -136,238 contracts in the data reported through Tuesday. This was a weekly gain of 46,218 contracts from the previous week which had a total of -182,456 net contracts.
This week’s current strength score (the trader positioning range over the past three years, measured from 0 to 100) shows the speculators are currently Bearish with a score of 39.5 percent. The commercials are Bearish with a score of 43.5 percent and the small traders (not shown in chart) are Bullish-Extreme with a score of 80.5 percent.
Price Trend-Following Model: Strong Downtrend
Our weekly trend-following model classifies the current market price position as: Strong Downtrend. The current action for the model is considered to be: Hold – Maintain Short Position.
| US Treasury Bonds Statistics | SPECULATORS | COMMERCIALS | SMALL TRADERS |
| – Percent of Open Interest Longs: | 6.9 | 77.0 | 13.8 |
| – Percent of Open Interest Shorts: | 16.8 | 70.2 | 10.6 |
| – Net Position: | -136,238 | 92,123 | 44,115 |
| – Gross Longs: | 93,736 | 1,051,787 | 189,136 |
| – Gross Shorts: | 229,974 | 959,664 | 145,021 |
| – Long to Short Ratio: | 0.4 to 1 | 1.1 to 1 | 1.3 to 1 |
| NET POSITION TREND: | |||
| – Strength Index Score (3 Year Range Pct): | 39.5 | 43.5 | 80.5 |
| – Strength Index Reading (3 Year Range): | Bearish | Bearish | Bullish-Extreme |
| NET POSITION MOVEMENT INDEX: | |||
| – 6-Week Change in Strength Index: | 18.6 | -21.6 | 3.0 |
Ultra US Treasury Bonds Futures:
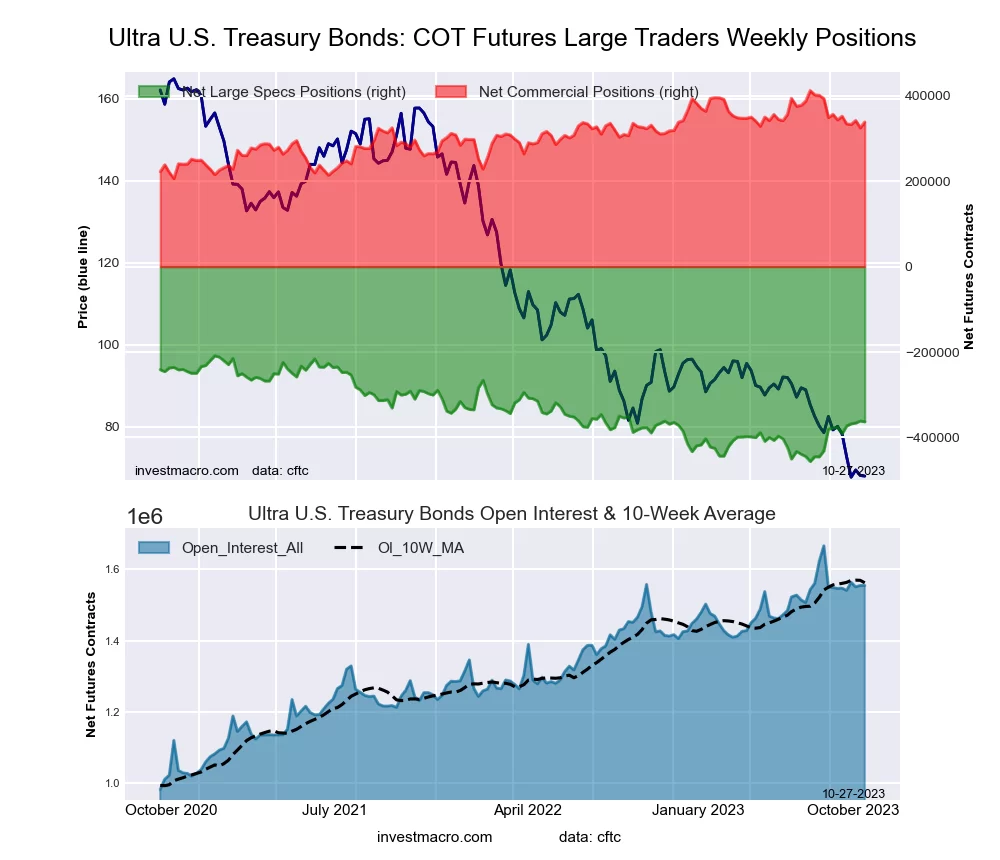 The Ultra US Treasury Bonds large speculator standing this week equaled a net position of -363,546 contracts in the data reported through Tuesday. This was a weekly lowering of -2,065 contracts from the previous week which had a total of -361,481 net contracts.
This week’s current strength score (the trader positioning range over the past three years, measured from 0 to 100) shows the speculators are currently Bearish with a score of 37.5 percent. The commercials are Bullish with a score of 64.2 percent and the small traders (not shown in chart) are Bullish with a score of 60.5 percent.
Price Trend-Following Model: Strong Downtrend
Our weekly trend-following model classifies the current market price position as: Strong Downtrend. The current action for the model is considered to be: Hold – Maintain Short Position.
| Ultra US Treasury Bonds Statistics | SPECULATORS | COMMERCIALS | SMALL TRADERS |
| – Percent of Open Interest Longs: | 6.0 | 82.9 | 11.0 |
| – Percent of Open Interest Shorts: | 29.3 | 61.1 | 9.4 |
| – Net Position: | -363,546 | 338,820 | 24,726 |
| – Gross Longs: | 92,655 | 1,288,162 | 170,435 |
| – Gross Shorts: | 456,201 | 949,342 | 145,709 |
| – Long to Short Ratio: | 0.2 to 1 | 1.4 to 1 | 1.2 to 1 |
| NET POSITION TREND: | |||
| – Strength Index Score (3 Year Range Pct): | 37.5 | 64.2 | 60.5 |
| – Strength Index Reading (3 Year Range): | Bearish | Bullish | Bullish |
| NET POSITION MOVEMENT INDEX: | |||
| – 6-Week Change in Strength Index: | 5.4 | -2.4 | -7.9 |
Article By InvestMacro – Receive our weekly COT Reports by Email
*COT Report: The COT data, released weekly to the public each Friday, is updated through the most recent Tuesday (data is 3 days old) and shows a quick view of how large speculators or non-commercials (for-profit traders) were positioned in the futures markets.
The CFTC categorizes trader positions according to commercial hedgers (traders who use futures contracts for hedging as part of the business), non-commercials (large traders who speculate to realize trading profits) and nonreportable traders (usually small traders/speculators) as well as their open interest (contracts open in the market at time of reporting).See CFTC criteria here.
All information and opinions on this website and contained in this article are for general informational purposes only and do not constitute investment advice.


