By InvestMacro
Here are the latest charts and statistics for the Commitment of Traders (COT) data published by the Commodities Futures Trading Commission (CFTC).
The latest COT data is updated through Tuesday March 19th and shows a quick view of how large traders (for-profit speculators and commercial entities) were positioned in the futures markets.
Weekly Speculator Bets led by Copper & Silver
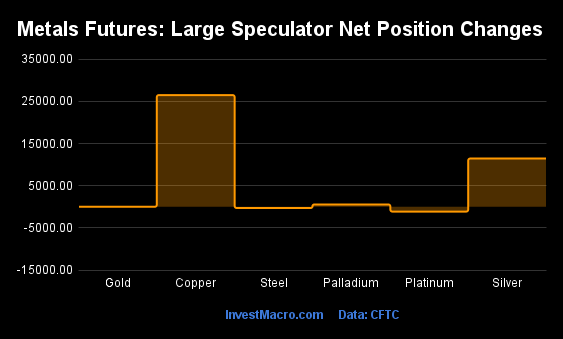
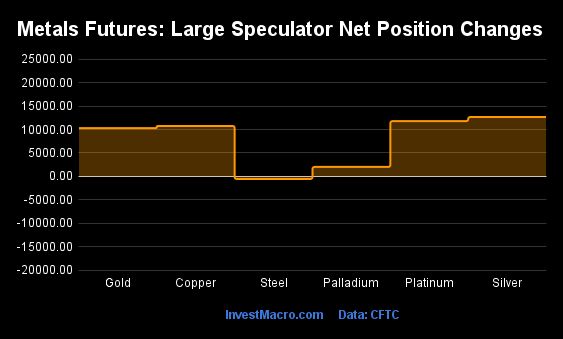
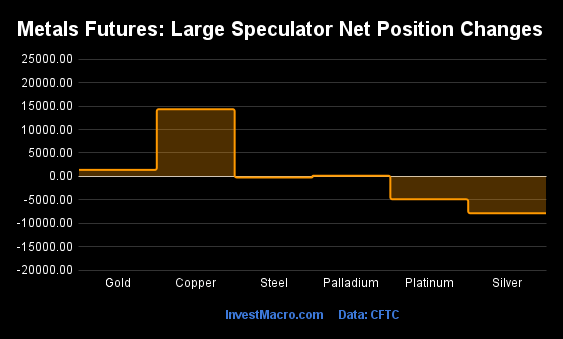
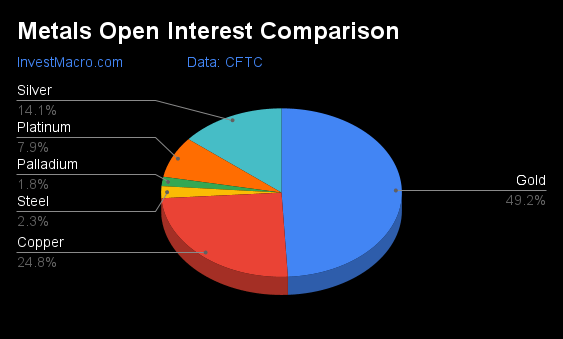
The COT metals markets speculator bets were mixed this week as three out of the six metals markets we cover had higher positioning while two markets had lower speculator contracts and one market had no change in weekly contracts.
Leading the gains for the metals was Copper (26,498 contracts) with Silver (11,457 contracts) and Palladium (562 contracts) also experiencing positive contract weeks.
The market leading the declines in speculator bets was Platinum (-1,139 contracts) with Steel (-289 contracts) also showing lower bets on the week.
Gold (0 contracts) saw a very rare unchanged position for the week, according to the CFTC data.
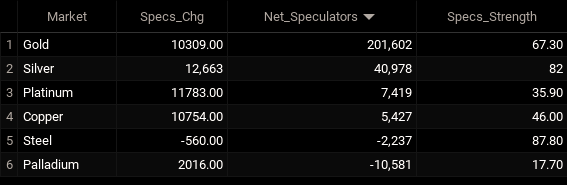
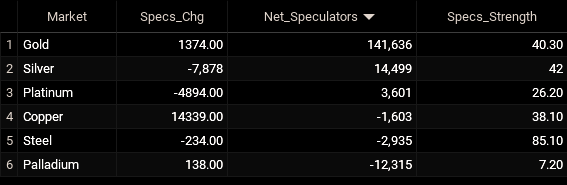
Metals Net Speculators Leaderboard
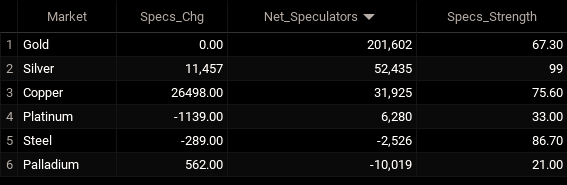
Legend: Weekly Speculators Change | Speculators Current Net Position | Speculators Strength Score compared to last 3-Years (0-100 range)
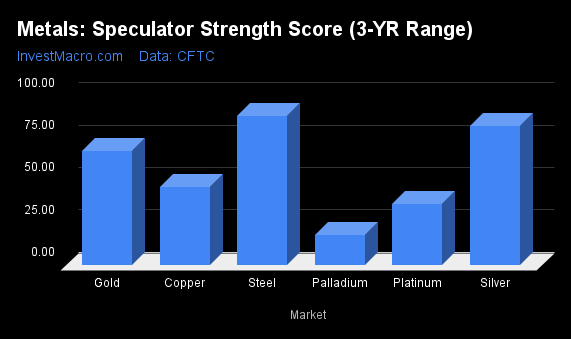
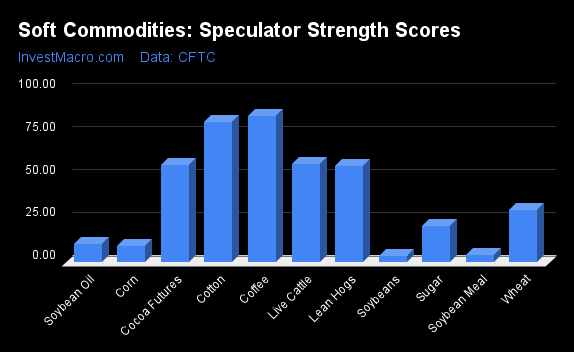
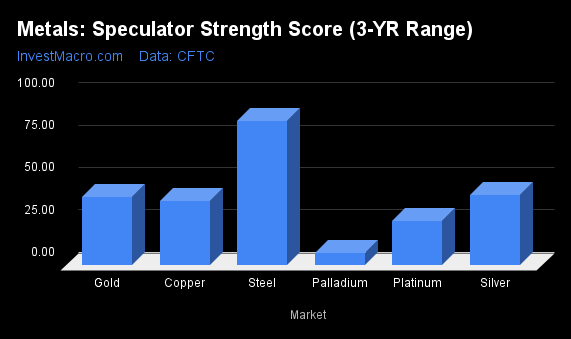
Strength Scores led by Silver & Steel
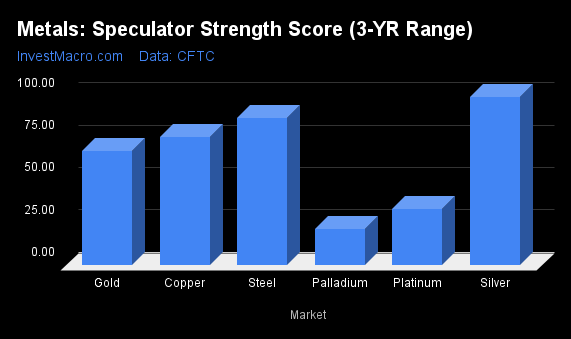
COT Strength Scores (a normalized measure of Speculator positions over a 3-Year range, from 0 to 100 where above 80 is Extreme-Bullish and below 20 is Extreme-Bearish) showed that Silver (99 percent) and Steel (87 percent) lead the metals markets this week. Copper (76 percent) comes in as the next highest in the weekly strength scores.
On the downside, Palladium (21 percent) and Platinum (33 percent) come in at the lowest strength levels currently.
Strength Statistics:
Gold (67.3 percent) vs Gold previous week (67.3 percent)
Silver (99.4 percent) vs Silver previous week (81.9 percent)
Copper (75.6 percent) vs Copper previous week (46.0 percent)
Platinum (33.0 percent) vs Platinum previous week (35.9 percent)
Palladium (21.0 percent) vs Palladium previous week (17.7 percent)
Steel (86.7 percent) vs Palladium previous week (87.8 percent)
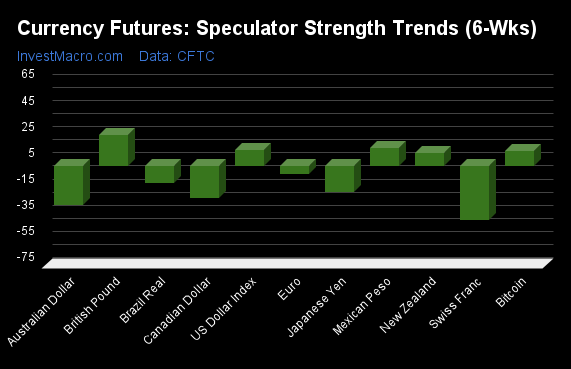
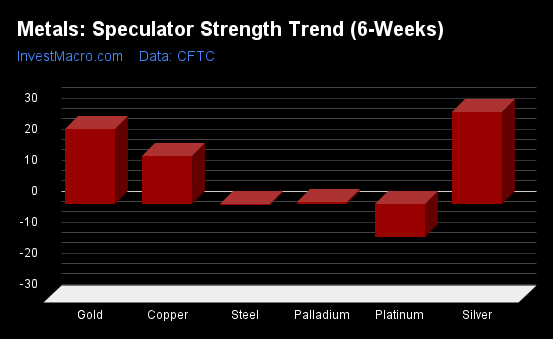
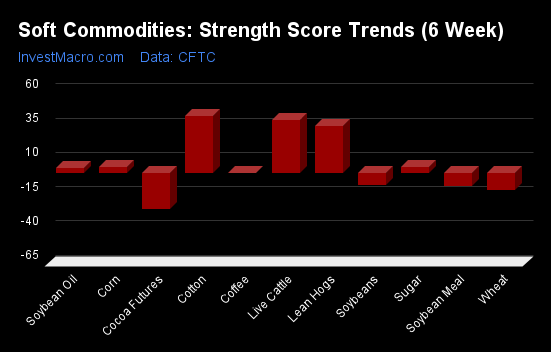
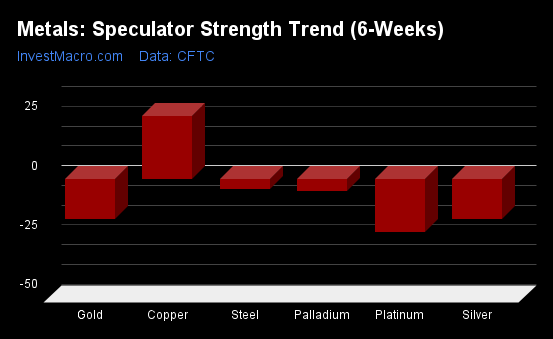
Silver & Copper top the 6-Week Strength Trends
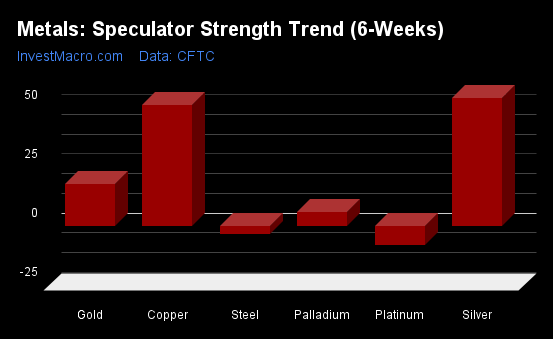
COT Strength Score Trends (or move index, calculates the 6-week changes in strength scores) showed that Silver (54 percent) and Copper (51 percent) lead the past six weeks trends for metals.
Platinum (-8 percent) leads the downside trend scores currently with Steel (-4 percent) as the next market with lower trend scores.
Move Statistics:
Gold (17.9 percent) vs Gold previous week (24.2 percent)
Silver (54.2 percent) vs Silver previous week (29.8 percent)
Copper (51.0 percent) vs Copper previous week (15.7 percent)
Platinum (-8.2 percent) vs Platinum previous week (-10.5 percent)
Palladium (5.9 percent) vs Palladium previous week (0.7 percent)
Steel (-3.5 percent) vs Steel previous week (-0.2 percent)
Individual Markets:
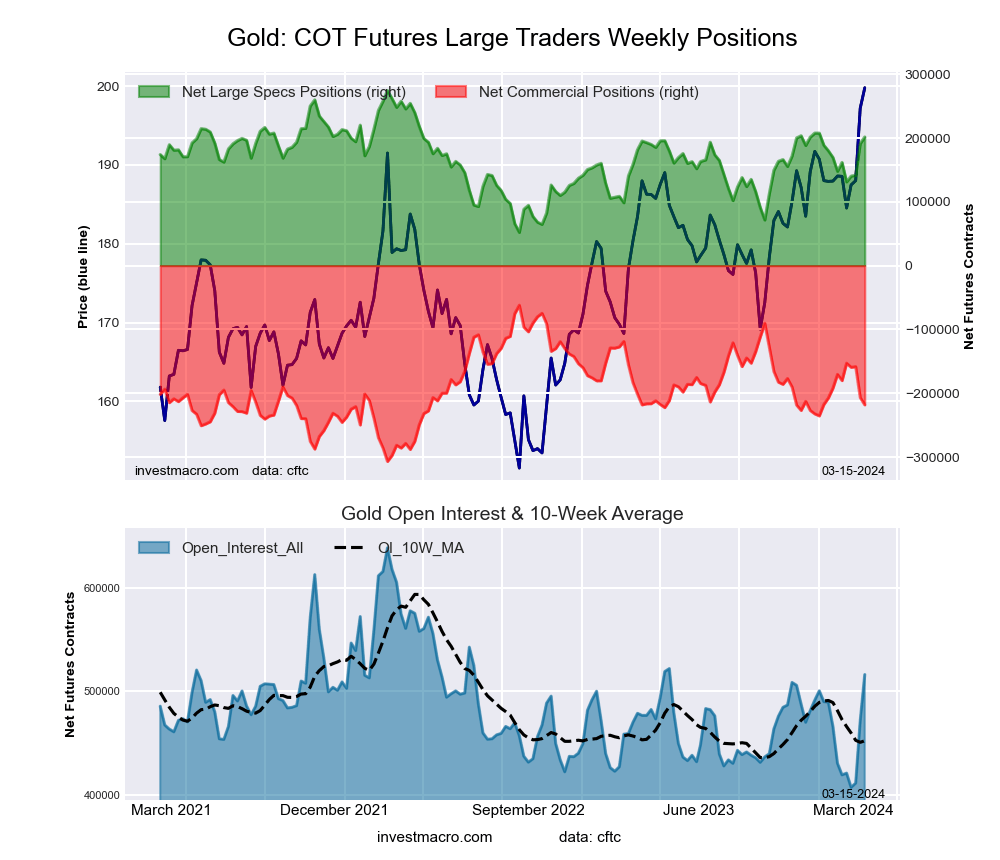
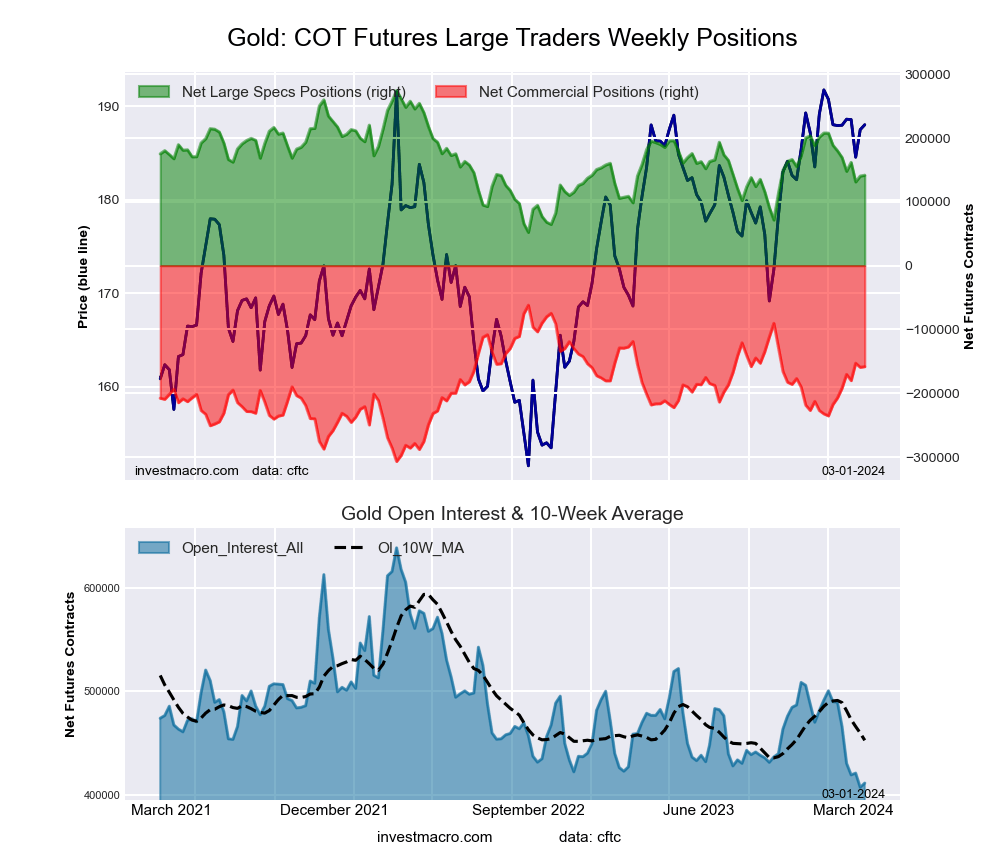
Gold Comex Futures:
 The Gold Comex Futures large speculator standing this week came in at a net position of 201,602 contracts in the data reported through Tuesday. This was a weekly fall of 0 contracts from the previous week which had a total of 201,602 net contracts.
This week’s current strength score (the trader positioning range over the past three years, measured from 0 to 100) shows the speculators are currently Bullish with a score of 67.3 percent. The commercials are Bearish with a score of 36.5 percent and the small traders (not shown in chart) are Bearish with a score of 25.3 percent.
Price Trend-Following Model: Strong Uptrend
Our weekly trend-following model classifies the current market price position as: Strong Uptrend. The current action for the model is considered to be: Hold – Maintain Long Position.
| Gold Futures Statistics | SPECULATORS | COMMERCIALS | SMALL TRADERS |
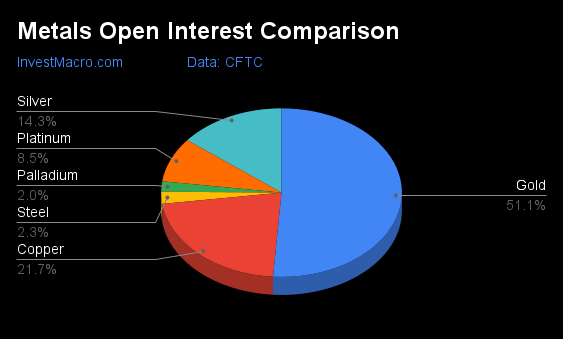
| – Percent of Open Interest Longs: | 52.1 | 25.8 | 9.2 |
| – Percent of Open Interest Shorts: | 14.4 | 66.5 | 6.2 |
| – Net Position: | 201,602 | -217,530 | 15,928 |
| – Gross Longs: | 278,732 | 138,102 | 49,131 |
| – Gross Shorts: | 77,130 | 355,632 | 33,203 |
| – Long to Short Ratio: | 3.6 to 1 | 0.4 to 1 | 1.5 to 1 |
| NET POSITION TREND: | |||
| – Strength Index Score (3 Year Range Pct): | 67.3 | 36.5 | 25.3 |
| – Strength Index Reading (3 Year Range): | Bullish | Bearish | Bearish |
| NET POSITION MOVEMENT INDEX: | |||
| – 6-Week Change in Strength Index: | 17.9 | -15.2 | -8.3 |
Silver Comex Futures:
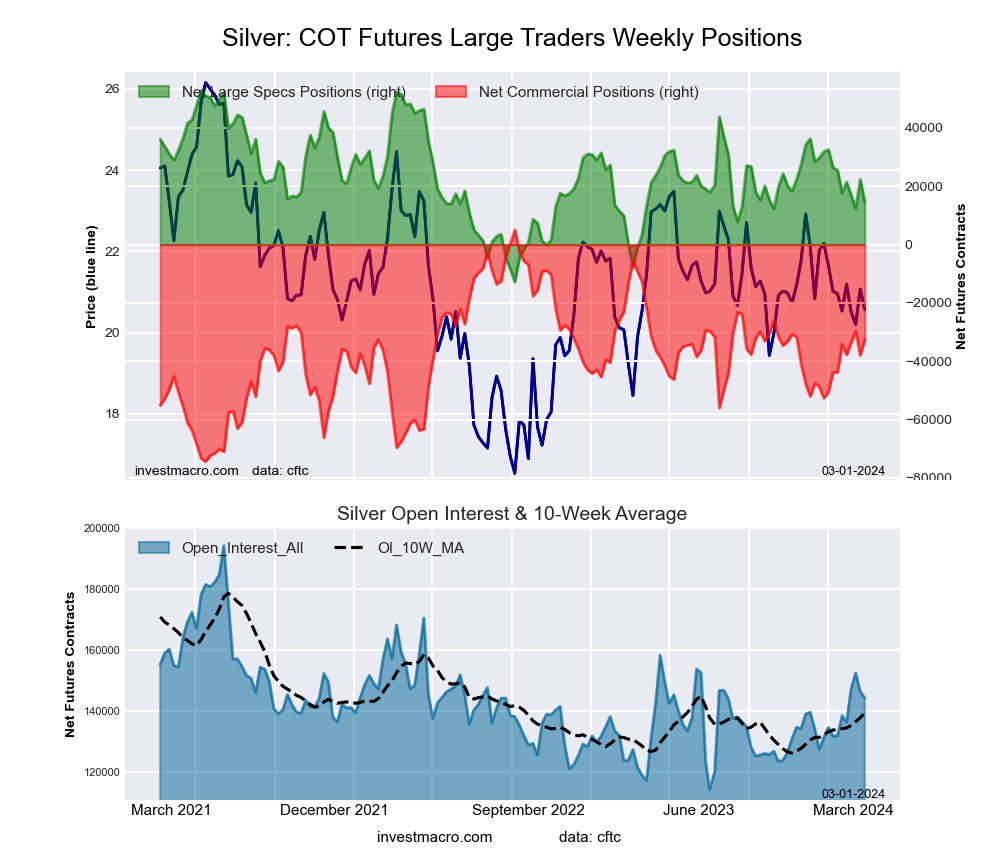
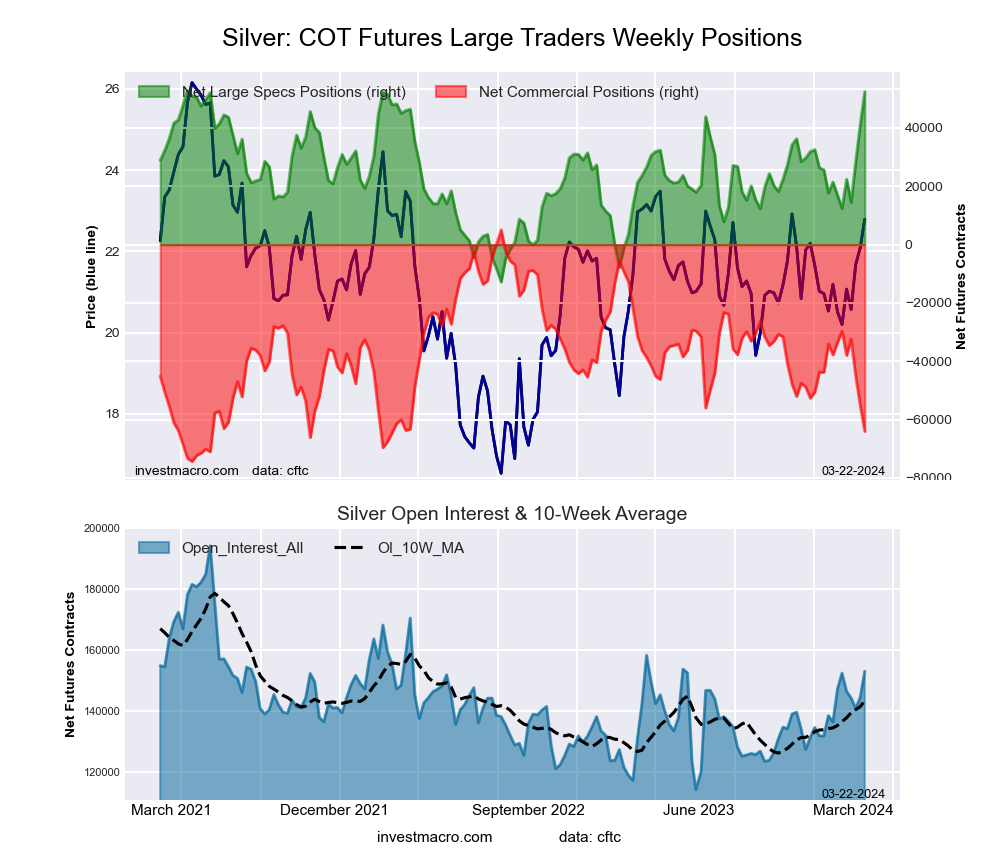 The Silver Comex Futures large speculator standing this week came in at a net position of 52,435 contracts in the data reported through Tuesday. This was a weekly rise of 11,457 contracts from the previous week which had a total of 40,978 net contracts.
This week’s current strength score (the trader positioning range over the past three years, measured from 0 to 100) shows the speculators are currently Bullish-Extreme with a score of 99.4 percent. The commercials are Bearish-Extreme with a score of 13.0 percent and the small traders (not shown in chart) are Bearish with a score of 30.7 percent.
Price Trend-Following Model: Strong Uptrend
Our weekly trend-following model classifies the current market price position as: Strong Uptrend. The current action for the model is considered to be: Hold – Maintain Long Position.
| Silver Futures Statistics | SPECULATORS | COMMERCIALS | SMALL TRADERS |
| – Percent of Open Interest Longs: | 50.7 | 26.0 | 17.5 |
| – Percent of Open Interest Shorts: | 16.5 | 67.8 | 10.0 |
| – Net Position: | 52,435 | -64,017 | 11,582 |
| – Gross Longs: | 77,632 | 39,876 | 26,859 |
| – Gross Shorts: | 25,197 | 103,893 | 15,277 |
| – Long to Short Ratio: | 3.1 to 1 | 0.4 to 1 | 1.8 to 1 |
| NET POSITION TREND: | |||
| – Strength Index Score (3 Year Range Pct): | 99.4 | 13.0 | 30.7 |
| – Strength Index Reading (3 Year Range): | Bullish-Extreme | Bearish-Extreme | Bearish |
| NET POSITION MOVEMENT INDEX: | |||
| – 6-Week Change in Strength Index: | 54.2 | -38.4 | -28.1 |
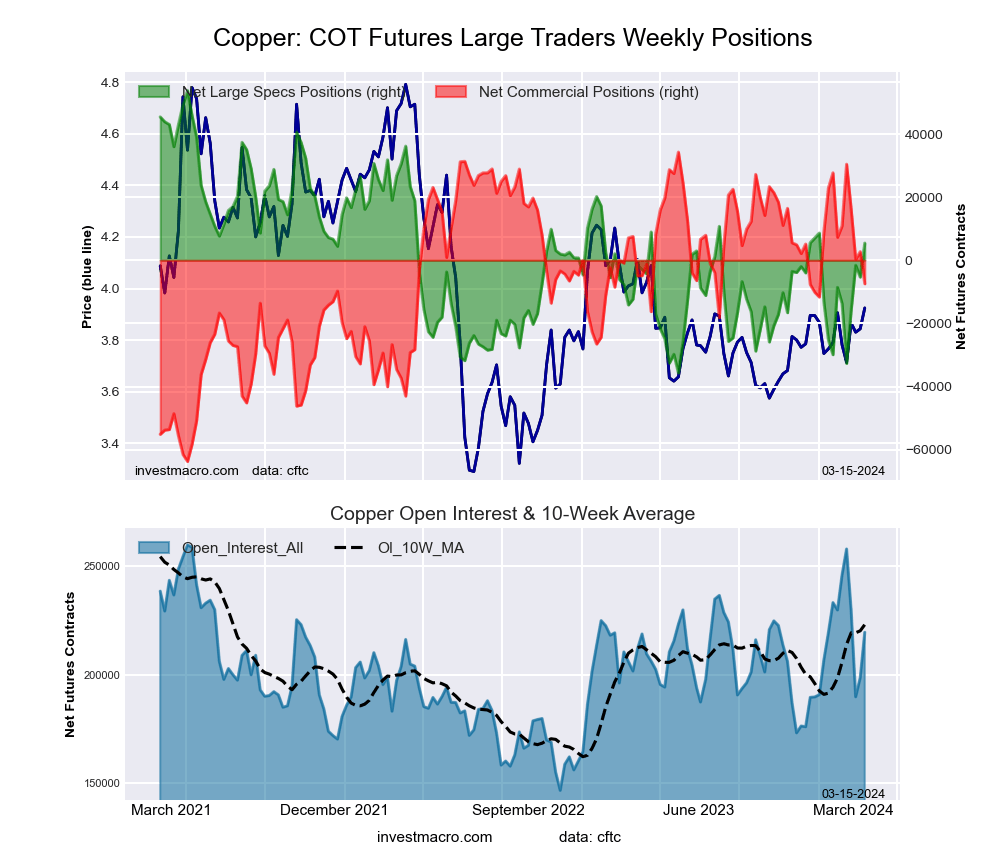
Copper Grade #1 Futures:
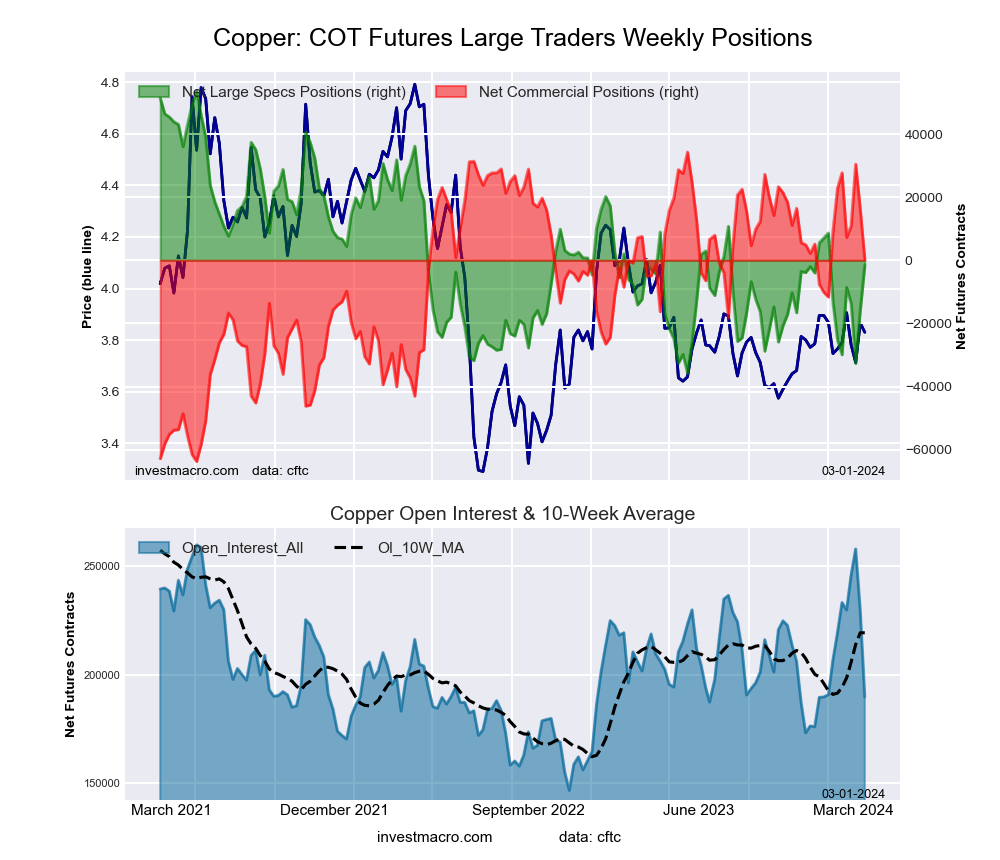
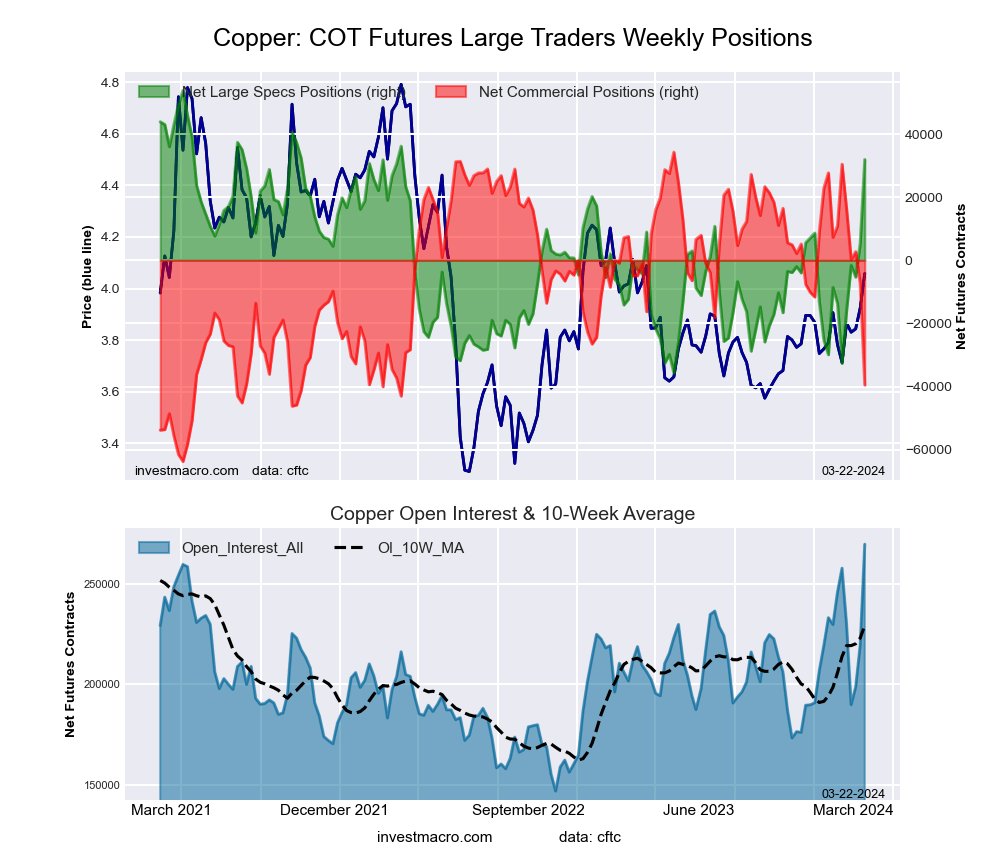 The Copper Grade #1 Futures large speculator standing this week came in at a net position of 31,925 contracts in the data reported through Tuesday. This was a weekly rise of 26,498 contracts from the previous week which had a total of 5,427 net contracts.
This week’s current strength score (the trader positioning range over the past three years, measured from 0 to 100) shows the speculators are currently Bullish with a score of 75.6 percent. The commercials are Bearish with a score of 24.7 percent and the small traders (not shown in chart) are Bullish with a score of 66.3 percent.
Price Trend-Following Model: Strong Uptrend
Our weekly trend-following model classifies the current market price position as: Strong Uptrend. The current action for the model is considered to be: Hold – Maintain Long Position.
| Copper Futures Statistics | SPECULATORS | COMMERCIALS | SMALL TRADERS |
| – Percent of Open Interest Longs: | 46.1 | 26.7 | 8.1 |
| – Percent of Open Interest Shorts: | 34.3 | 41.3 | 5.3 |
| – Net Position: | 31,925 | -39,502 | 7,577 |
| – Gross Longs: | 124,316 | 71,934 | 21,878 |
| – Gross Shorts: | 92,391 | 111,436 | 14,301 |
| – Long to Short Ratio: | 1.3 to 1 | 0.6 to 1 | 1.5 to 1 |
| NET POSITION TREND: | |||
| – Strength Index Score (3 Year Range Pct): | 75.6 | 24.7 | 66.3 |
| – Strength Index Reading (3 Year Range): | Bullish | Bearish | Bullish |
| NET POSITION MOVEMENT INDEX: | |||
| – 6-Week Change in Strength Index: | 51.0 | -51.4 | 30.0 |
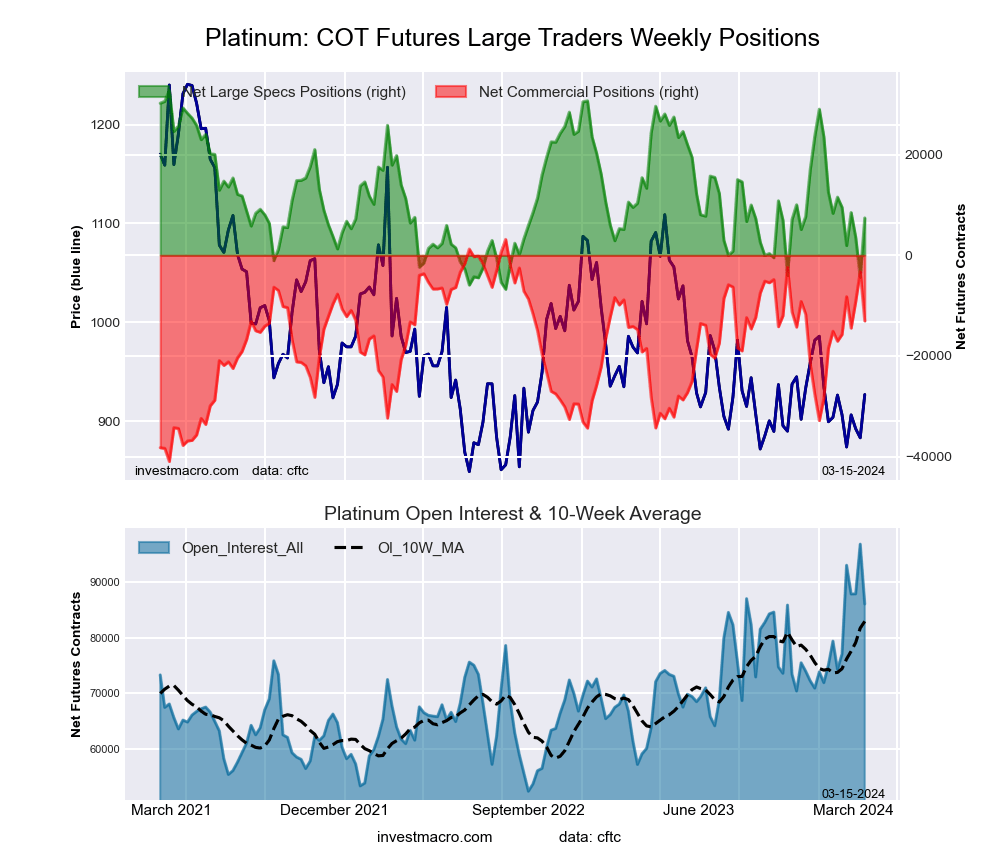
Platinum Futures:
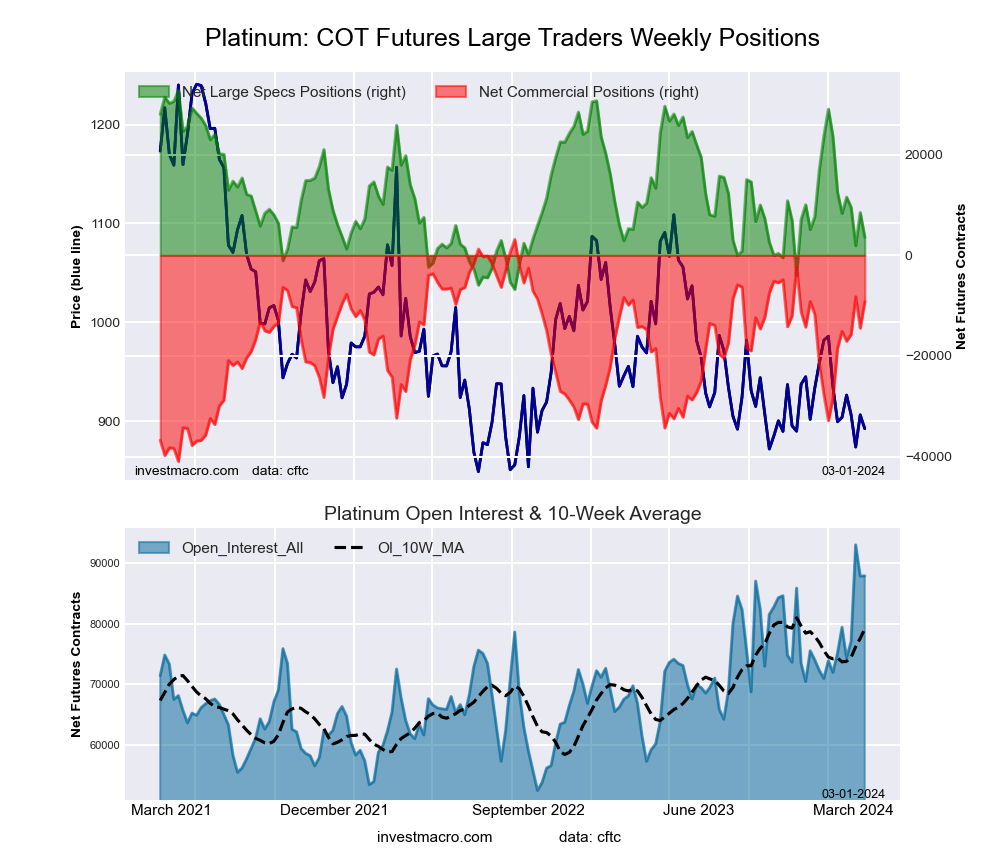
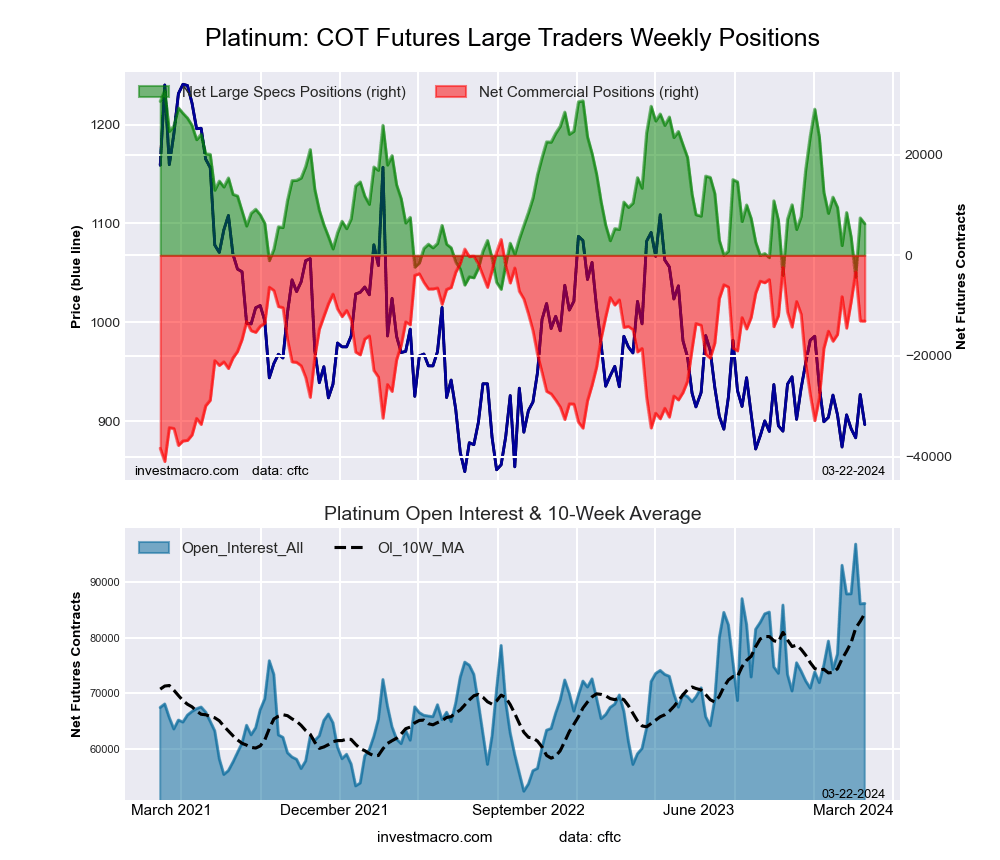 The Platinum Futures large speculator standing this week came in at a net position of 6,280 contracts in the data reported through Tuesday. This was a weekly decrease of -1,139 contracts from the previous week which had a total of 7,419 net contracts.
This week’s current strength score (the trader positioning range over the past three years, measured from 0 to 100) shows the speculators are currently Bearish with a score of 33.0 percent. The commercials are Bullish with a score of 63.2 percent and the small traders (not shown in chart) are Bullish with a score of 59.0 percent.
Price Trend-Following Model: Strong Downtrend
Our weekly trend-following model classifies the current market price position as: Strong Downtrend. The current action for the model is considered to be: Hold – Maintain Short Position.
| Platinum Futures Statistics | SPECULATORS | COMMERCIALS | SMALL TRADERS |
| – Percent of Open Interest Longs: | 49.4 | 23.7 | 12.7 |
| – Percent of Open Interest Shorts: | 42.1 | 38.9 | 4.8 |
| – Net Position: | 6,280 | -13,078 | 6,798 |
| – Gross Longs: | 42,540 | 20,413 | 10,934 |
| – Gross Shorts: | 36,260 | 33,491 | 4,136 |
| – Long to Short Ratio: | 1.2 to 1 | 0.6 to 1 | 2.6 to 1 |
| NET POSITION TREND: | |||
| – Strength Index Score (3 Year Range Pct): | 33.0 | 63.2 | 59.0 |
| – Strength Index Reading (3 Year Range): | Bearish | Bullish | Bullish |
| NET POSITION MOVEMENT INDEX: | |||
| – 6-Week Change in Strength Index: | -8.2 | 6.0 | 8.0 |
Palladium Futures:
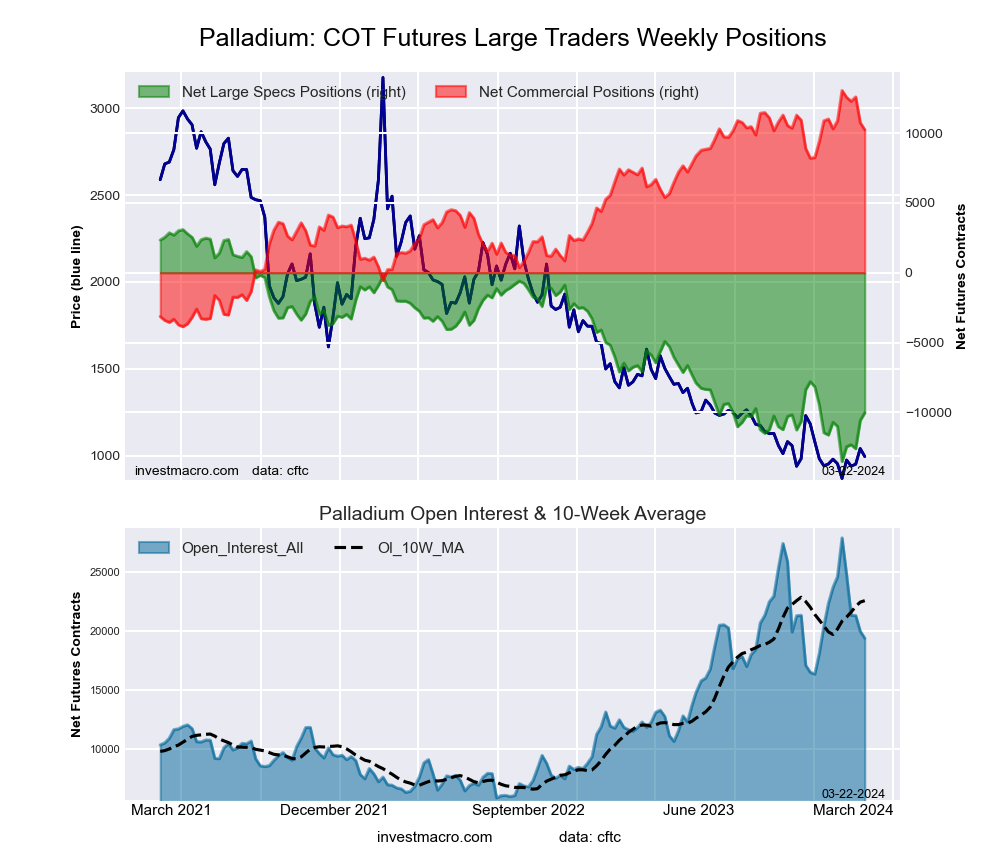 The Palladium Futures large speculator standing this week came in at a net position of -10,019 contracts in the data reported through Tuesday. This was a weekly increase of 562 contracts from the previous week which had a total of -10,581 net contracts.
This week’s current strength score (the trader positioning range over the past three years, measured from 0 to 100) shows the speculators are currently Bearish with a score of 21.0 percent. The commercials are Bullish-Extreme with a score of 83.4 percent and the small traders (not shown in chart) are Bearish with a score of 28.8 percent.
Price Trend-Following Model: Downtrend
Our weekly trend-following model classifies the current market price position as: Downtrend. The current action for the model is considered to be: Hold – Maintain Short Position.
| Palladium Futures Statistics | SPECULATORS | COMMERCIALS | SMALL TRADERS |
| – Percent of Open Interest Longs: | 22.9 | 63.5 | 7.9 |
| – Percent of Open Interest Shorts: | 74.6 | 10.6 | 9.0 |
| – Net Position: | -10,019 | 10,234 | -215 |
| – Gross Longs: | 4,427 | 12,292 | 1,528 |
| – Gross Shorts: | 14,446 | 2,058 | 1,743 |
| – Long to Short Ratio: | 0.3 to 1 | 6.0 to 1 | 0.9 to 1 |
| NET POSITION TREND: | |||
| – Strength Index Score (3 Year Range Pct): | 21.0 | 83.4 | 28.8 |
| – Strength Index Reading (3 Year Range): | Bearish | Bullish-Extreme | Bearish |
| NET POSITION MOVEMENT INDEX: | |||
| – 6-Week Change in Strength Index: | 5.9 | -3.8 | -20.3 |
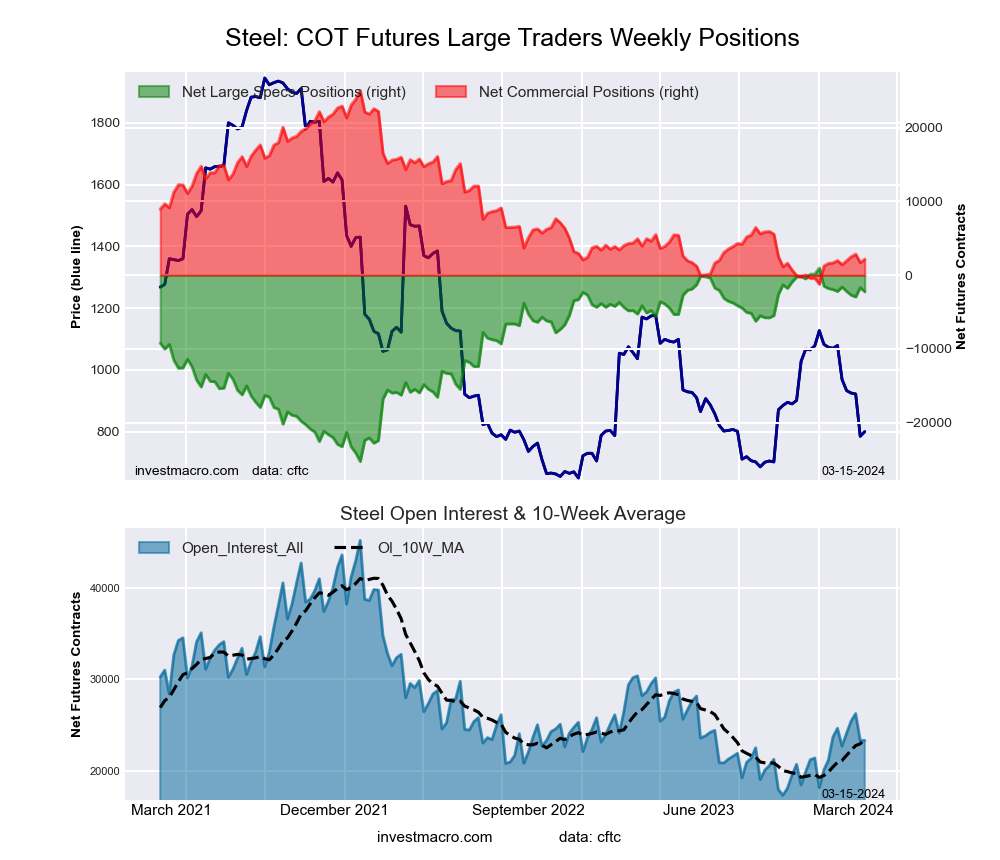
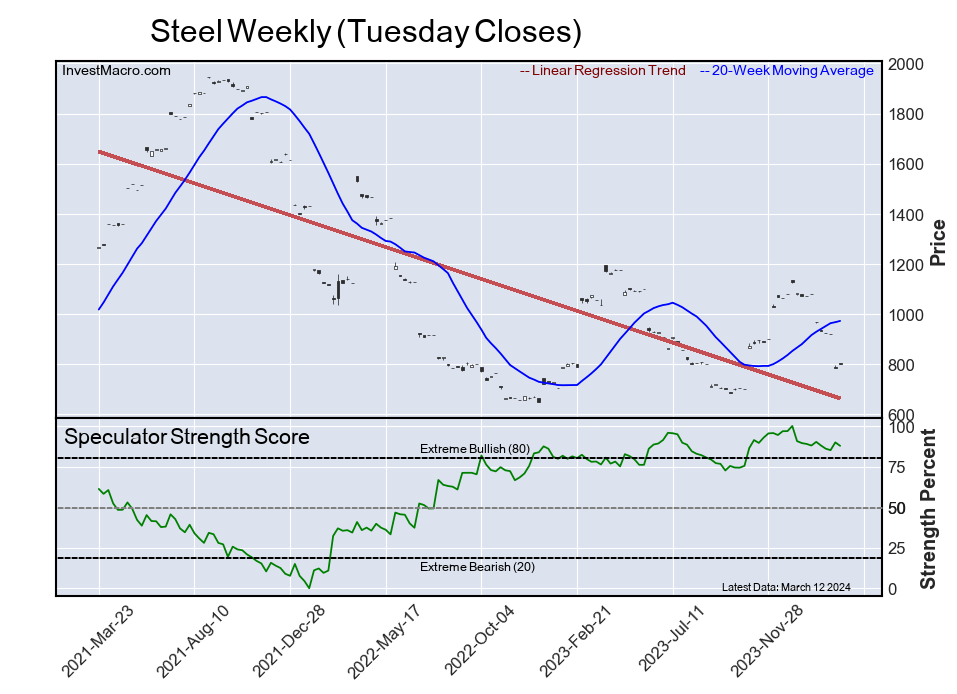
Steel Futures Futures:
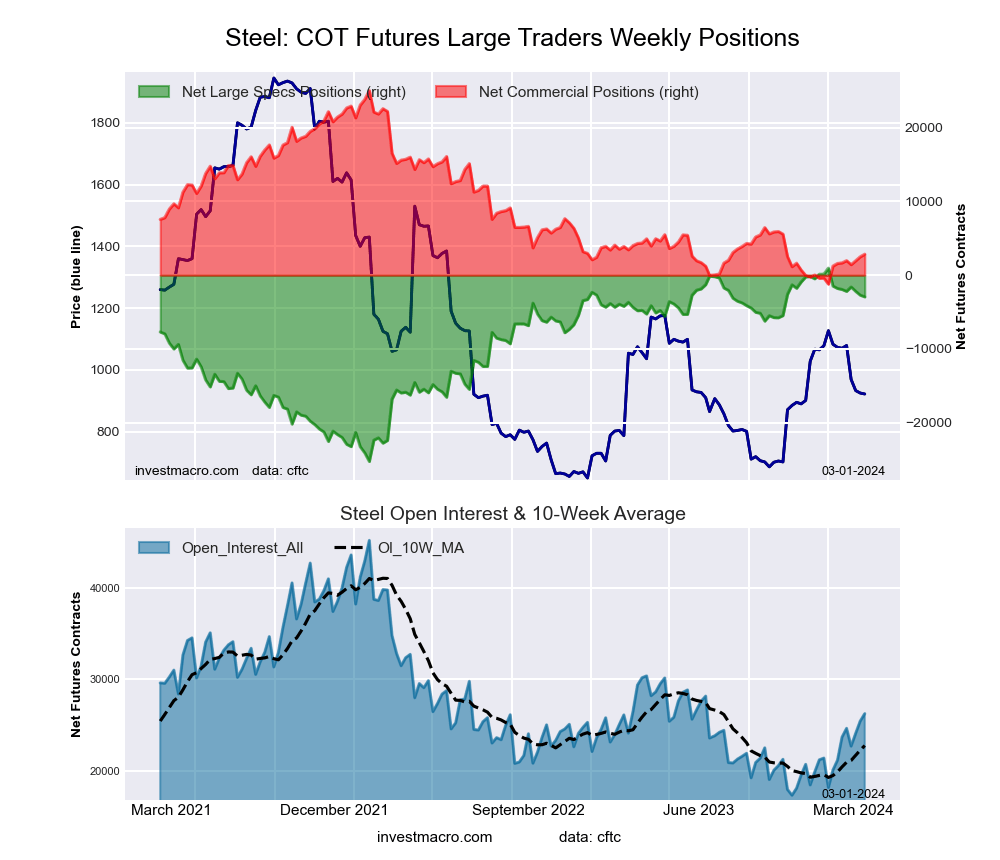
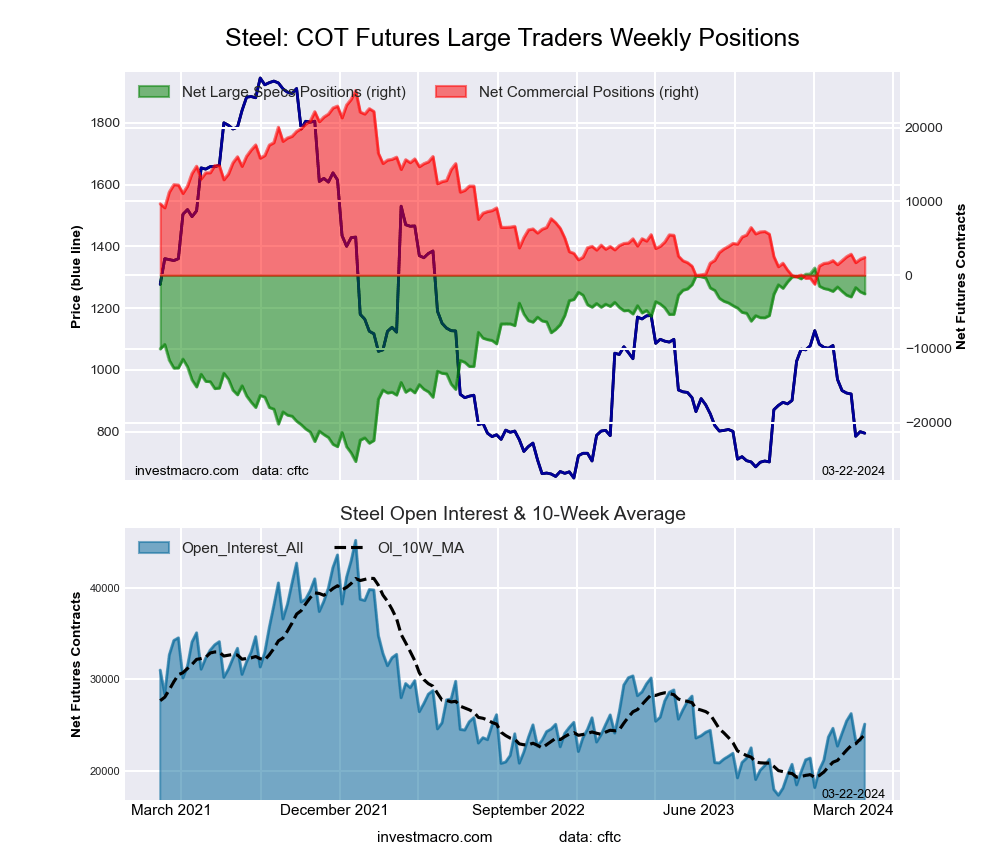 The Steel Futures large speculator standing this week came in at a net position of -2,526 contracts in the data reported through Tuesday. This was a weekly decline of -289 contracts from the previous week which had a total of -2,237 net contracts.
This week’s current strength score (the trader positioning range over the past three years, measured from 0 to 100) shows the speculators are currently Bullish-Extreme with a score of 86.7 percent. The commercials are Bearish-Extreme with a score of 13.8 percent and the small traders (not shown in chart) are Bearish with a score of 44.3 percent.
Price Trend-Following Model: Strong Downtrend
Our weekly trend-following model classifies the current market price position as: Strong Downtrend. The current action for the model is considered to be: Hold – Maintain Short Position.
| Steel Futures Statistics | SPECULATORS | COMMERCIALS | SMALL TRADERS |
| – Percent of Open Interest Longs: | 9.1 | 83.7 | 1.3 |
| – Percent of Open Interest Shorts: | 19.2 | 74.1 | 0.9 |
| – Net Position: | -2,526 | 2,417 | 109 |
| – Gross Longs: | 2,293 | 21,012 | 323 |
| – Gross Shorts: | 4,819 | 18,595 | 214 |
| – Long to Short Ratio: | 0.5 to 1 | 1.1 to 1 | 1.5 to 1 |
| NET POSITION TREND: | |||
| – Strength Index Score (3 Year Range Pct): | 86.7 | 13.8 | 44.3 |
| – Strength Index Reading (3 Year Range): | Bullish-Extreme | Bearish-Extreme | Bearish |
| NET POSITION MOVEMENT INDEX: | |||
| – 6-Week Change in Strength Index: | -3.5 | 3.8 | -6.2 |
Article By InvestMacro – Receive our weekly COT Newsletter
*COT Report: The COT data, released weekly to the public each Friday, is updated through the most recent Tuesday (data is 3 days old) and shows a quick view of how large speculators or non-commercials (for-profit traders) were positioned in the futures markets.
The CFTC categorizes trader positions according to commercial hedgers (traders who use futures contracts for hedging as part of the business), non-commercials (large traders who speculate to realize trading profits) and nonreportable traders (usually small traders/speculators) as well as their open interest (contracts open in the market at time of reporting). See CFTC criteria here.