
By InvestMacro
Here are the latest charts and statistics for the Commitment of Traders (COT) reports data published by the Commodities Futures Trading Commission (CFTC).
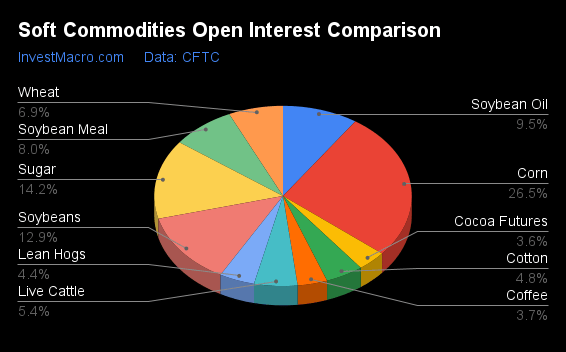
The latest COT data is updated through Tuesday March 12th and shows a quick view of how large traders (for-profit speculators and commercial entities) were positioned in the futures markets.
Weekly Speculator Changes led by Corn & Soybeans
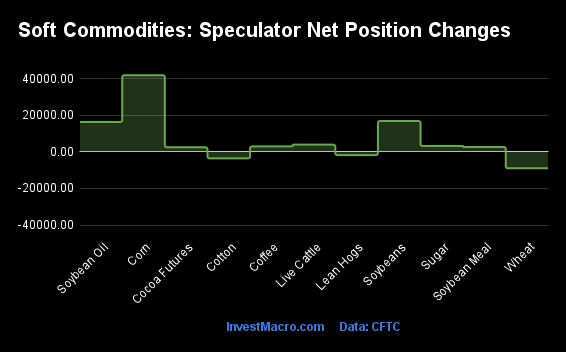
The COT soft commodities markets speculator bets were higher this week as eight out of the eleven softs markets we cover had higher positioning while the other three markets had lower speculator contracts.
Free Reports:
 Get our Weekly Commitment of Traders Reports - See where the biggest traders (Hedge Funds and Commercial Hedgers) are positioned in the futures markets on a weekly basis.
 Sign Up for Our Stock Market Newsletter – Get updated on News, Charts & Rankings of Public Companies when you join our Stocks Newsletter
Leading the gains for the softs markets was Corn (41,857 contracts) with Soybeans (16,828 contracts), Soybean Oil (16,286 contracts), Live Cattle (3,932 contracts), Sugar (3,186 contracts), Coffee (2,959 contracts), Soybean Meal (2,622 contracts) and Cocoa (2,469 contracts) also recording positive weeks.
The markets with the declines in speculator bets this week were Wheat (-8,981 contracts), Cotton (-3,599 contracts) and Lean Hogs (-1,812 contracts) also seeing lower bets on the week.
Soft Commodities Net Speculators Leaderboard
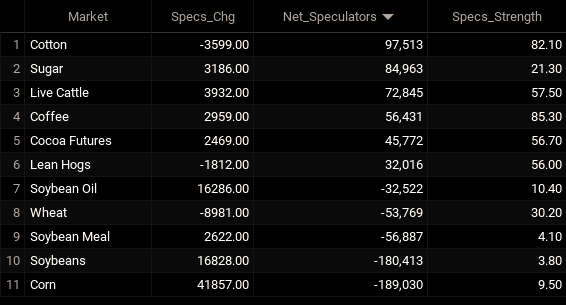
Legend: Weekly Speculators Change | Speculators Current Net Position | Speculators Strength Score compared to last 3-Years (0-100 range)
Strength Scores led by Coffee & Cotton
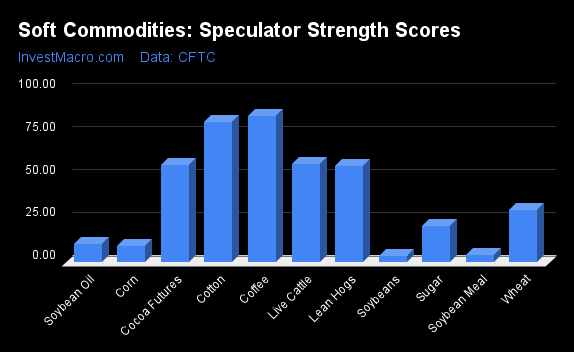
COT Strength Scores (a normalized measure of Speculator positions over a 3-Year range, from 0 to 100 where above 80 is Extreme-Bullish and below 20 is Extreme-Bearish) showed that Coffee (85 percent) and Cotton (82 percent) lead the softs markets this week. Cocoa (57 percent), Live Cattle (57 percent) and Lean Hogs (56 percent) come in as the next highest in the weekly strength scores.
On the downside, Soybean Meal (4 percent), Soybeans (4 percent), Soybean Oil (10 percent) and Corn (10 percent) come in at the lowest strength levels currently and are in Extreme-Bearish territory (below 20 percent).
Strength Statistics:
Corn (9.5 percent) vs Corn previous week (4.3 percent)
Sugar (21.3 percent) vs Sugar previous week (20.2 percent)
Coffee (85.3 percent) vs Coffee previous week (82.3 percent)
Soybeans (3.8 percent) vs Soybeans previous week (0.0 percent)
Soybean Oil (10.4 percent) vs Soybean Oil previous week (0.0 percent)
Soybean Meal (4.1 percent) vs Soybean Meal previous week (3.0 percent)
Live Cattle (57.5 percent) vs Live Cattle previous week (53.3 percent)
Lean Hogs (56.0 percent) vs Lean Hogs previous week (57.5 percent)
Cotton (82.1 percent) vs Cotton previous week (84.8 percent)
Cocoa (56.7 percent) vs Cocoa previous week (54.1 percent)
Wheat (30.2 percent) vs Wheat previous week (36.4 percent)
Cotton & Live Cattle top the 6-Week Strength Trends
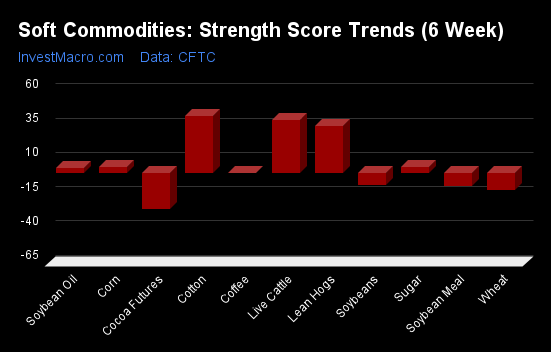
COT Strength Score Trends (or move index, calculates the 6-week changes in strength scores) showed that Cotton (42 percent), Live Cattle (38 percent) and Lean Hogs (34 percent) lead the past six weeks trends for soft commodities.
Cocoa (-26 percent) leads the downside trend scores currently with Wheat (-12 percent), Soybean Meal (-9 percent) and Soybeans (-9 percent) following next with lower trend scores.
Strength Trend Statistics:
Corn (4.4 percent) vs Corn previous week (-1.4 percent)
Sugar (4.1 percent) vs Sugar previous week (5.1 percent)
Coffee (0.3 percent) vs Coffee previous week (0.6 percent)
Soybeans (-8.9 percent) vs Soybeans previous week (-20.4 percent)
Soybean Oil (3.5 percent) vs Soybean Oil previous week (-15.0 percent)
Soybean Meal (-9.4 percent) vs Soybean Meal previous week (-16.0 percent)
Live Cattle (38.4 percent) vs Live Cattle previous week (45.9 percent)
Lean Hogs (34.4 percent) vs Lean Hogs previous week (47.4 percent)
Cotton (41.6 percent) vs Cotton previous week (47.4 percent)
Cocoa (-26.4 percent) vs Cocoa previous week (-33.1 percent)
Wheat (-12.0 percent) vs Wheat previous week (-1.4 percent)
Individual Soft Commodities Markets:
CORN Futures:
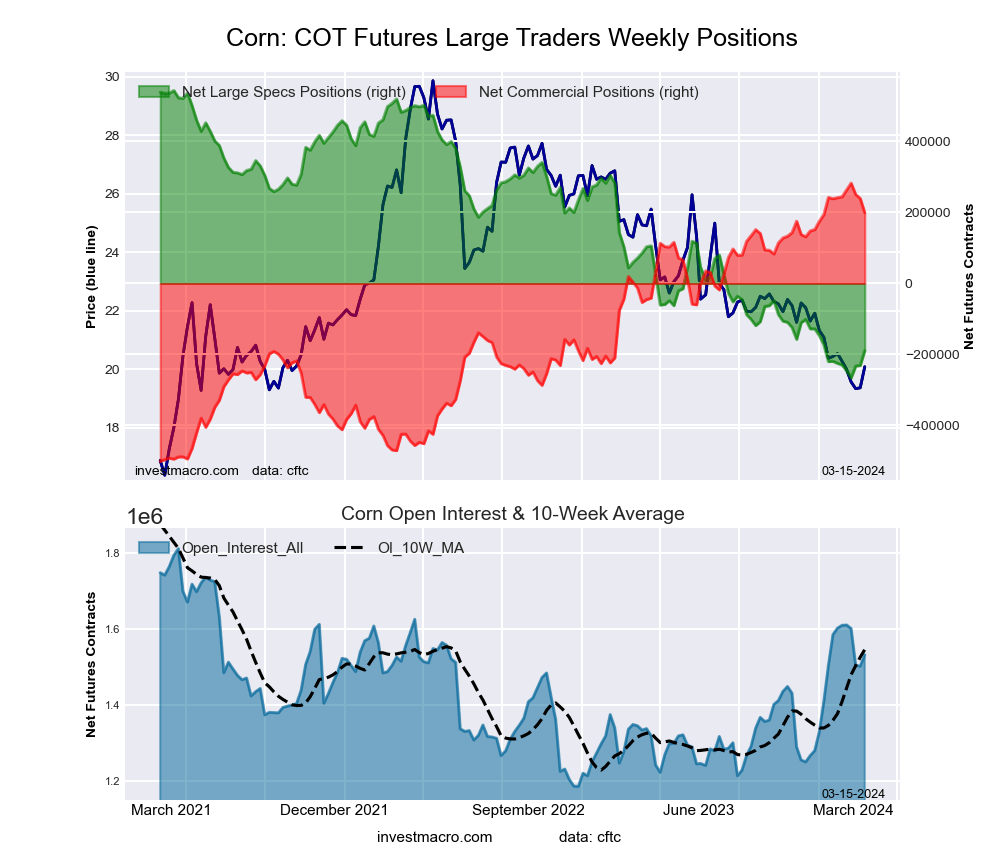 The CORN large speculator standing this week came in at a net position of -189,030 contracts in the data reported through Tuesday. This was a weekly increase of 41,857 contracts from the previous week which had a total of -230,887 net contracts.
This week’s current strength score (the trader positioning range over the past three years, measured from 0 to 100) shows the speculators are currently Bearish-Extreme with a score of 9.5 percent. The commercials are Bullish-Extreme with a score of 89.4 percent and the small traders (not shown in chart) are Bullish-Extreme with a score of 98.0 percent.
Price Trend-Following Model: Downtrend
Our weekly trend-following model classifies the current market price position as: Downtrend. The current action for the model is considered to be: Hold – Maintain Short Position.
| CORN Futures Statistics | SPECULATORS | COMMERCIALS | SMALL TRADERS |
| – Percent of Open Interest Longs: | 19.4 | 43.0 | 9.9 |
| – Percent of Open Interest Shorts: | 31.7 | 30.0 | 10.6 |
| – Net Position: | -189,030 | 199,050 | -10,020 |
| – Gross Longs: | 297,244 | 658,122 | 151,688 |
| – Gross Shorts: | 486,274 | 459,072 | 161,708 |
| – Long to Short Ratio: | 0.6 to 1 | 1.4 to 1 | 0.9 to 1 |
| NET POSITION TREND: | |||
| – Strength Index Score (3 Year Range Pct): | 9.5 | 89.4 | 98.0 |
| – Strength Index Reading (3 Year Range): | Bearish-Extreme | Bullish-Extreme | Bullish-Extreme |
| NET POSITION MOVEMENT INDEX: | |||
| – 6-Week Change in Strength Index: | 4.4 | -5.4 | 9.5 |
SUGAR Futures:
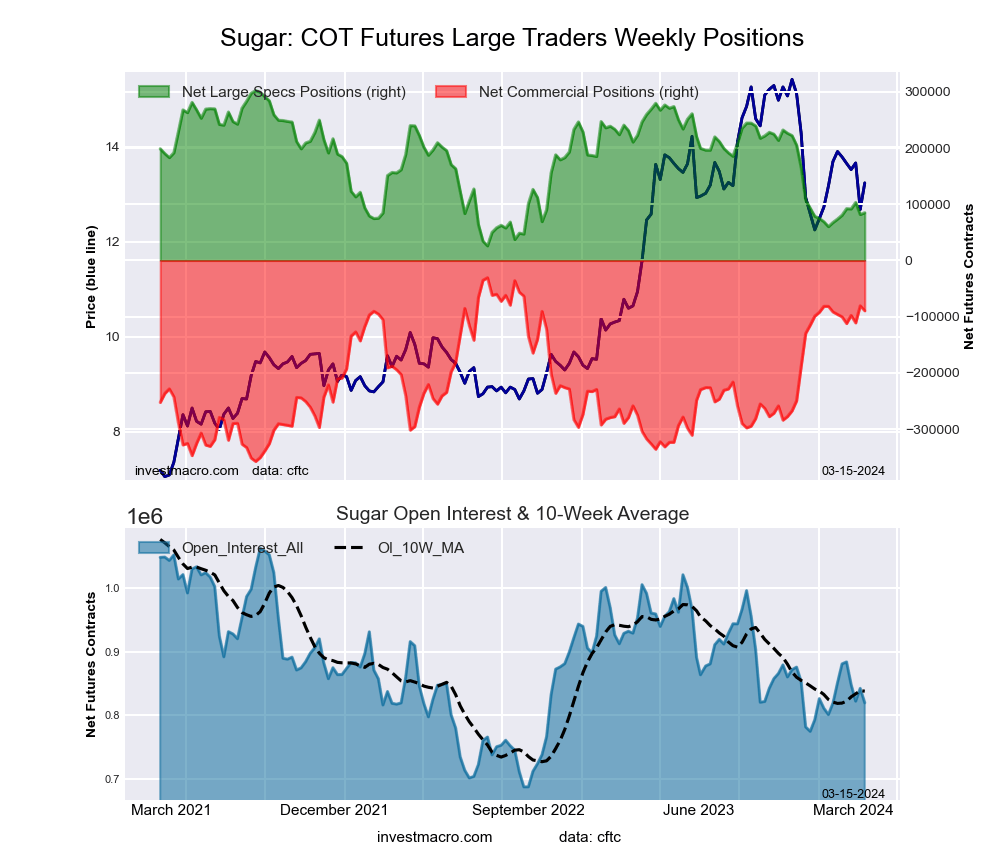 The SUGAR large speculator standing this week came in at a net position of 84,963 contracts in the data reported through Tuesday. This was a weekly boost of 3,186 contracts from the previous week which had a total of 81,777 net contracts.
This week’s current strength score (the trader positioning range over the past three years, measured from 0 to 100) shows the speculators are currently Bearish with a score of 21.3 percent. The commercials are Bullish-Extreme with a score of 82.0 percent and the small traders (not shown in chart) are Bearish-Extreme with a score of 8.9 percent.
Price Trend-Following Model: Downtrend
Our weekly trend-following model classifies the current market price position as: Downtrend. The current action for the model is considered to be: Hold – Maintain Short Position.
| SUGAR Futures Statistics | SPECULATORS | COMMERCIALS | SMALL TRADERS |
| – Percent of Open Interest Longs: | 21.7 | 52.4 | 8.5 |
| – Percent of Open Interest Shorts: | 11.3 | 63.3 | 7.9 |
| – Net Position: | 84,963 | -89,468 | 4,505 |
| – Gross Longs: | 177,558 | 429,842 | 69,383 |
| – Gross Shorts: | 92,595 | 519,310 | 64,878 |
| – Long to Short Ratio: | 1.9 to 1 | 0.8 to 1 | 1.1 to 1 |
| NET POSITION TREND: | |||
| – Strength Index Score (3 Year Range Pct): | 21.3 | 82.0 | 8.9 |
| – Strength Index Reading (3 Year Range): | Bearish | Bullish-Extreme | Bearish-Extreme |
| NET POSITION MOVEMENT INDEX: | |||
| – 6-Week Change in Strength Index: | 4.1 | 2.0 | -26.4 |
COFFEE Futures:
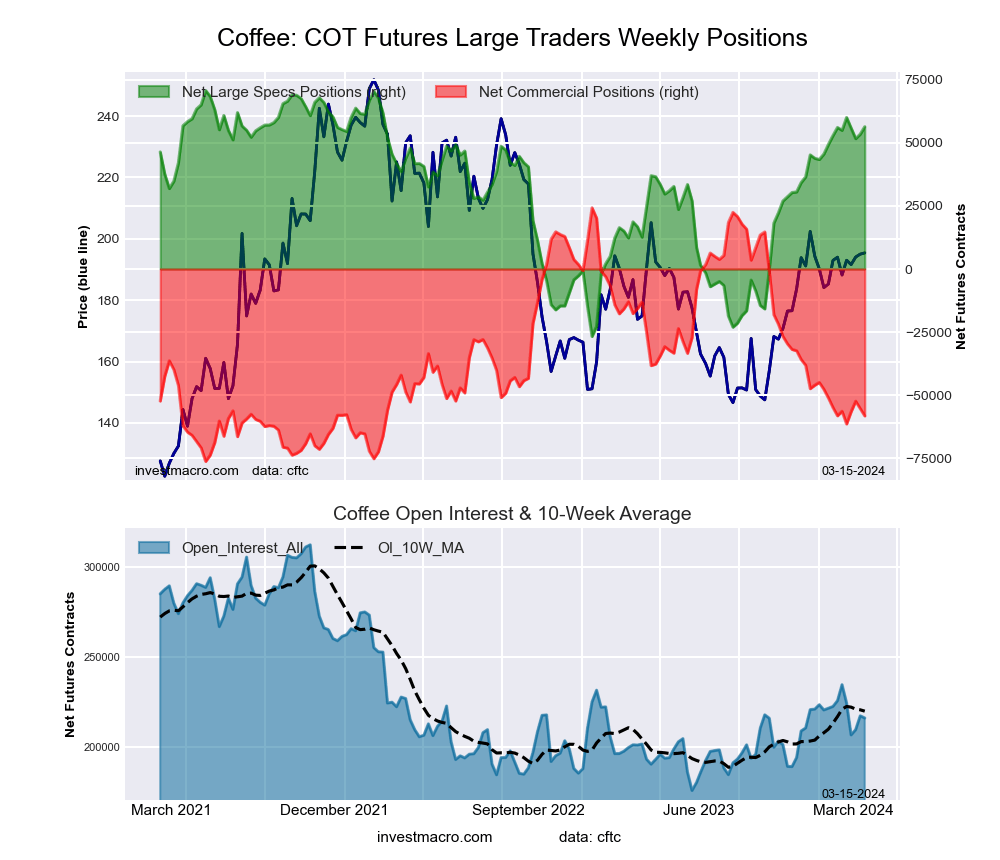 The COFFEE large speculator standing this week came in at a net position of 56,431 contracts in the data reported through Tuesday. This was a weekly rise of 2,959 contracts from the previous week which had a total of 53,472 net contracts.
This week’s current strength score (the trader positioning range over the past three years, measured from 0 to 100) shows the speculators are currently Bullish-Extreme with a score of 85.3 percent. The commercials are Bearish-Extreme with a score of 18.0 percent and the small traders (not shown in chart) are Bearish with a score of 38.8 percent.
Price Trend-Following Model: Uptrend
Our weekly trend-following model classifies the current market price position as: Uptrend. The current action for the model is considered to be: Hold – Maintain Long Position.
| COFFEE Futures Statistics | SPECULATORS | COMMERCIALS | SMALL TRADERS |
| – Percent of Open Interest Longs: | 35.9 | 37.4 | 3.9 |
| – Percent of Open Interest Shorts: | 9.8 | 64.3 | 3.1 |
| – Net Position: | 56,431 | -58,262 | 1,831 |
| – Gross Longs: | 77,576 | 80,666 | 8,435 |
| – Gross Shorts: | 21,145 | 138,928 | 6,604 |
| – Long to Short Ratio: | 3.7 to 1 | 0.6 to 1 | 1.3 to 1 |
| NET POSITION TREND: | |||
| – Strength Index Score (3 Year Range Pct): | 85.3 | 18.0 | 38.8 |
| – Strength Index Reading (3 Year Range): | Bullish-Extreme | Bearish-Extreme | Bearish |
| NET POSITION MOVEMENT INDEX: | |||
| – 6-Week Change in Strength Index: | 0.3 | -0.0 | -3.6 |
SOYBEANS Futures:
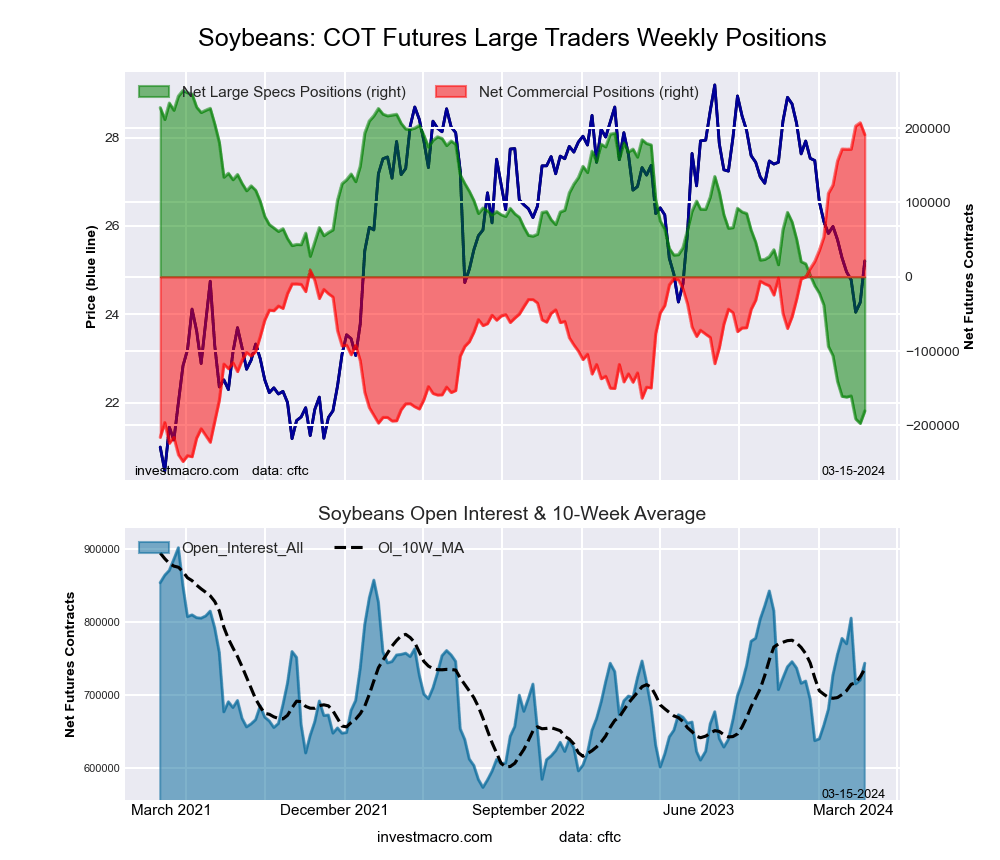 The SOYBEANS large speculator standing this week came in at a net position of -180,413 contracts in the data reported through Tuesday. This was a weekly lift of 16,828 contracts from the previous week which had a total of -197,241 net contracts.
This week’s current strength score (the trader positioning range over the past three years, measured from 0 to 100) shows the speculators are currently Bearish-Extreme with a score of 3.8 percent. The commercials are Bullish-Extreme with a score of 96.5 percent and the small traders (not shown in chart) are Bullish with a score of 78.6 percent.
Price Trend-Following Model: Downtrend
Our weekly trend-following model classifies the current market price position as: Downtrend. The current action for the model is considered to be: Hold – Maintain Short Position.
| SOYBEANS Futures Statistics | SPECULATORS | COMMERCIALS | SMALL TRADERS |
| – Percent of Open Interest Longs: | 13.4 | 60.6 | 6.9 |
| – Percent of Open Interest Shorts: | 37.6 | 34.8 | 8.4 |
| – Net Position: | -180,413 | 191,331 | -10,918 |
| – Gross Longs: | 99,347 | 450,053 | 51,545 |
| – Gross Shorts: | 279,760 | 258,722 | 62,463 |
| – Long to Short Ratio: | 0.4 to 1 | 1.7 to 1 | 0.8 to 1 |
| NET POSITION TREND: | |||
| – Strength Index Score (3 Year Range Pct): | 3.8 | 96.5 | 78.6 |
| – Strength Index Reading (3 Year Range): | Bearish-Extreme | Bullish-Extreme | Bullish |
| NET POSITION MOVEMENT INDEX: | |||
| – 6-Week Change in Strength Index: | -8.9 | 7.8 | 10.6 |
SOYBEAN OIL Futures:
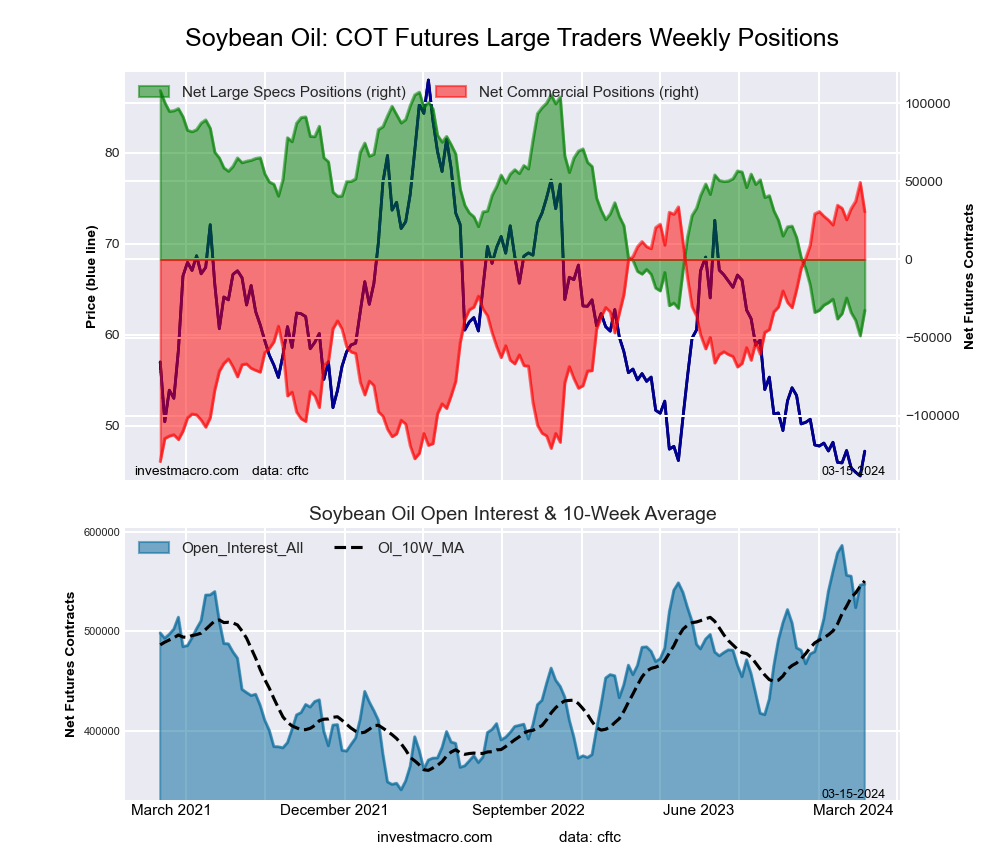 The SOYBEAN OIL large speculator standing this week came in at a net position of -32,522 contracts in the data reported through Tuesday. This was a weekly lift of 16,286 contracts from the previous week which had a total of -48,808 net contracts.
This week’s current strength score (the trader positioning range over the past three years, measured from 0 to 100) shows the speculators are currently Bearish-Extreme with a score of 10.4 percent. The commercials are Bullish-Extreme with a score of 89.5 percent and the small traders (not shown in chart) are Bearish with a score of 21.9 percent.
Price Trend-Following Model: Downtrend
Our weekly trend-following model classifies the current market price position as: Downtrend. The current action for the model is considered to be: Hold – Maintain Short Position.
| SOYBEAN OIL Futures Statistics | SPECULATORS | COMMERCIALS | SMALL TRADERS |
| – Percent of Open Interest Longs: | 20.6 | 46.4 | 5.2 |
| – Percent of Open Interest Shorts: | 26.5 | 40.8 | 4.8 |
| – Net Position: | -32,522 | 30,498 | 2,024 |
| – Gross Longs: | 112,652 | 254,151 | 28,336 |
| – Gross Shorts: | 145,174 | 223,653 | 26,312 |
| – Long to Short Ratio: | 0.8 to 1 | 1.1 to 1 | 1.1 to 1 |
| NET POSITION TREND: | |||
| – Strength Index Score (3 Year Range Pct): | 10.4 | 89.5 | 21.9 |
| – Strength Index Reading (3 Year Range): | Bearish-Extreme | Bullish-Extreme | Bearish |
| NET POSITION MOVEMENT INDEX: | |||
| – 6-Week Change in Strength Index: | 3.5 | -2.3 | -5.2 |
SOYBEAN MEAL Futures:
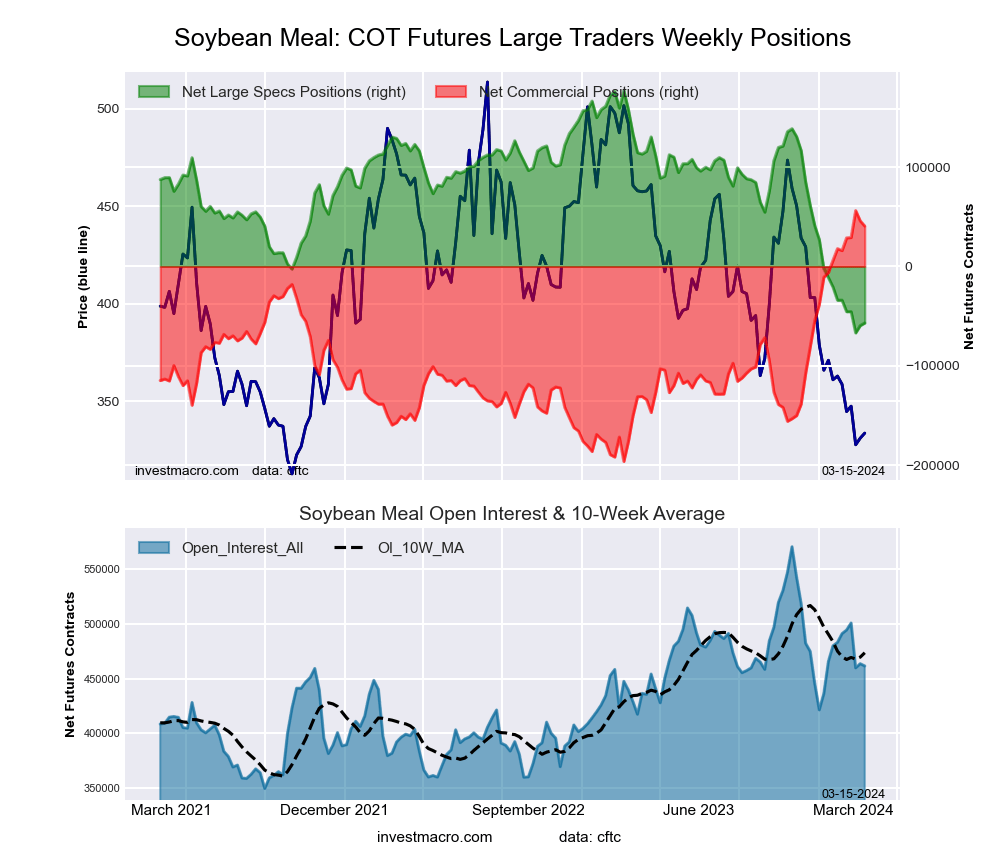 The SOYBEAN MEAL large speculator standing this week came in at a net position of -56,887 contracts in the data reported through Tuesday. This was a weekly lift of 2,622 contracts from the previous week which had a total of -59,509 net contracts.
This week’s current strength score (the trader positioning range over the past three years, measured from 0 to 100) shows the speculators are currently Bearish-Extreme with a score of 4.1 percent. The commercials are Bullish-Extreme with a score of 93.8 percent and the small traders (not shown in chart) are Bearish with a score of 29.0 percent.
Price Trend-Following Model: Downtrend
Our weekly trend-following model classifies the current market price position as: Downtrend. The current action for the model is considered to be: Hold – Maintain Short Position.
| SOYBEAN MEAL Futures Statistics | SPECULATORS | COMMERCIALS | SMALL TRADERS |
| – Percent of Open Interest Longs: | 18.5 | 50.2 | 9.8 |
| – Percent of Open Interest Shorts: | 30.8 | 41.4 | 6.3 |
| – Net Position: | -56,887 | 40,575 | 16,312 |
| – Gross Longs: | 85,247 | 231,555 | 45,244 |
| – Gross Shorts: | 142,134 | 190,980 | 28,932 |
| – Long to Short Ratio: | 0.6 to 1 | 1.2 to 1 | 1.6 to 1 |
| NET POSITION TREND: | |||
| – Strength Index Score (3 Year Range Pct): | 4.1 | 93.8 | 29.0 |
| – Strength Index Reading (3 Year Range): | Bearish-Extreme | Bullish-Extreme | Bearish |
| NET POSITION MOVEMENT INDEX: | |||
| – 6-Week Change in Strength Index: | -9.4 | 9.0 | 1.2 |
LIVE CATTLE Futures:
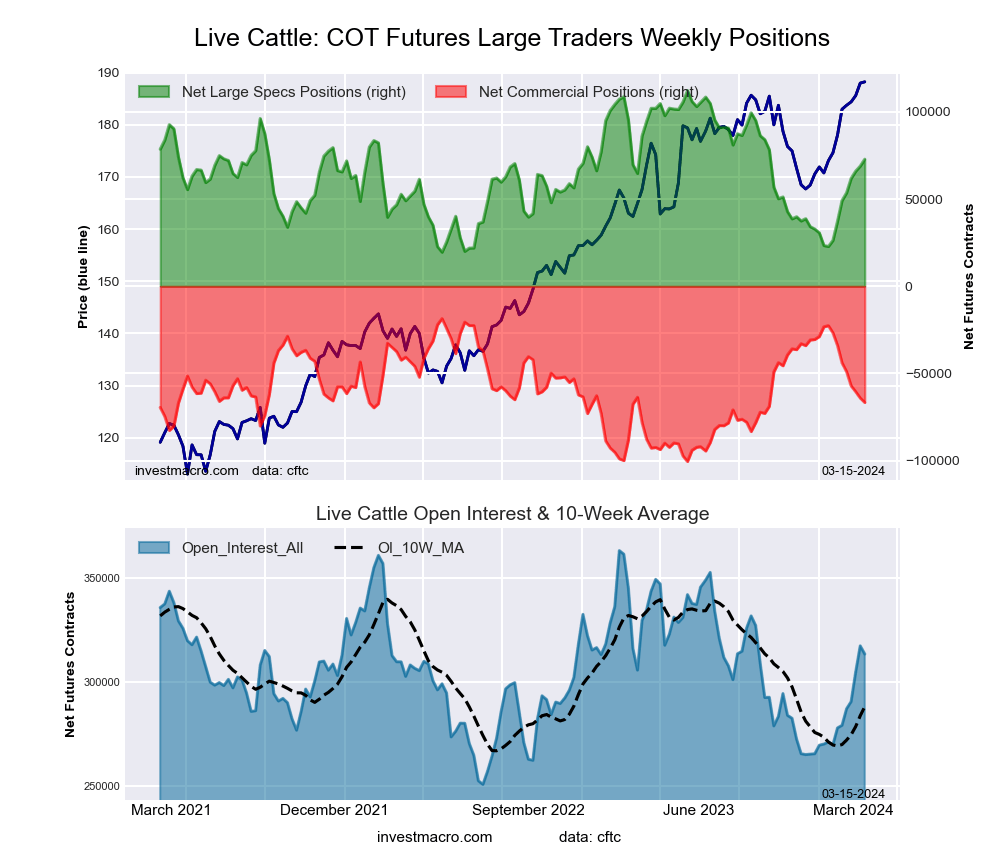 The LIVE CATTLE large speculator standing this week came in at a net position of 72,845 contracts in the data reported through Tuesday. This was a weekly advance of 3,932 contracts from the previous week which had a total of 68,913 net contracts.
This week’s current strength score (the trader positioning range over the past three years, measured from 0 to 100) shows the speculators are currently Bullish with a score of 57.5 percent. The commercials are Bearish with a score of 41.3 percent and the small traders (not shown in chart) are Bullish with a score of 56.6 percent.
Price Trend-Following Model: Strong Uptrend
Our weekly trend-following model classifies the current market price position as: Strong Uptrend. The current action for the model is considered to be: Hold – Maintain Long Position.
| LIVE CATTLE Futures Statistics | SPECULATORS | COMMERCIALS | SMALL TRADERS |
| – Percent of Open Interest Longs: | 39.3 | 32.9 | 10.6 |
| – Percent of Open Interest Shorts: | 16.1 | 54.1 | 12.6 |
| – Net Position: | 72,845 | -66,632 | -6,213 |
| – Gross Longs: | 123,232 | 103,112 | 33,174 |
| – Gross Shorts: | 50,387 | 169,744 | 39,387 |
| – Long to Short Ratio: | 2.4 to 1 | 0.6 to 1 | 0.8 to 1 |
| NET POSITION TREND: | |||
| – Strength Index Score (3 Year Range Pct): | 57.5 | 41.3 | 56.6 |
| – Strength Index Reading (3 Year Range): | Bullish | Bearish | Bullish |
| NET POSITION MOVEMENT INDEX: | |||
| – 6-Week Change in Strength Index: | 38.4 | -39.9 | -15.7 |
LEAN HOGS Futures:
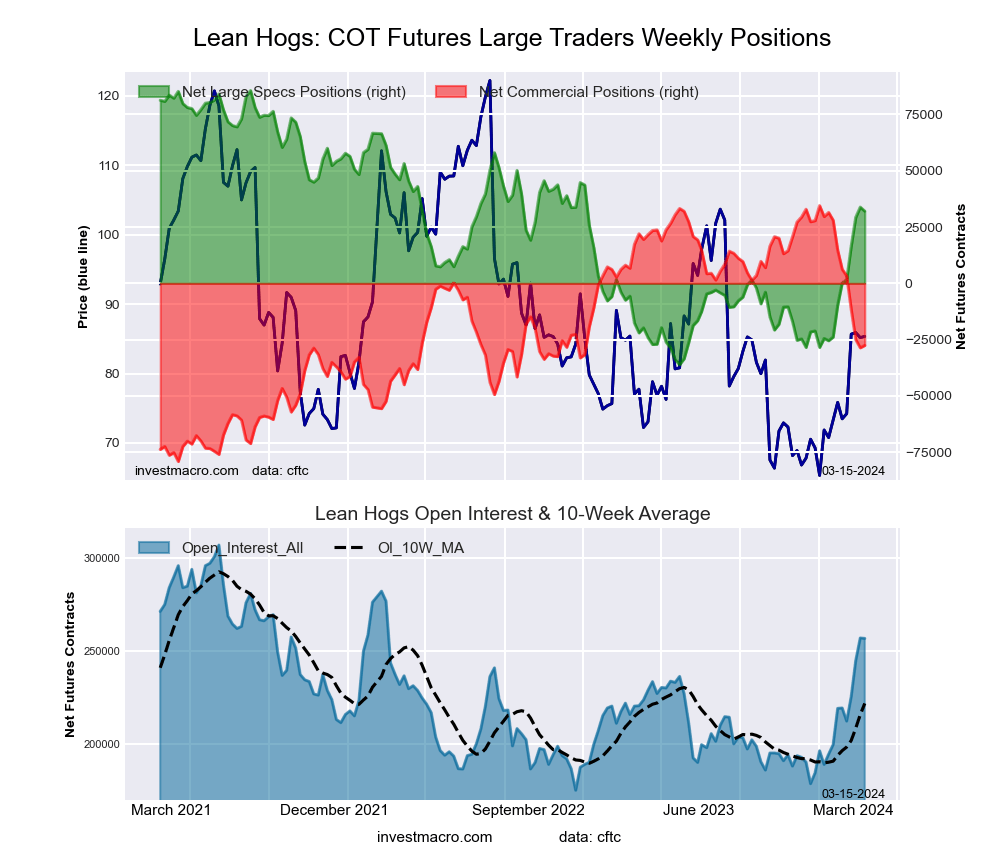 The LEAN HOGS large speculator standing this week came in at a net position of 32,016 contracts in the data reported through Tuesday. This was a weekly fall of -1,812 contracts from the previous week which had a total of 33,828 net contracts.
This week’s current strength score (the trader positioning range over the past three years, measured from 0 to 100) shows the speculators are currently Bullish with a score of 56.0 percent. The commercials are Bearish with a score of 45.4 percent and the small traders (not shown in chart) are Bullish with a score of 63.5 percent.
Price Trend-Following Model: Strong Uptrend
Our weekly trend-following model classifies the current market price position as: Strong Uptrend. The current action for the model is considered to be: Hold – Maintain Long Position.
| LEAN HOGS Futures Statistics | SPECULATORS | COMMERCIALS | SMALL TRADERS |
| – Percent of Open Interest Longs: | 34.9 | 36.1 | 8.8 |
| – Percent of Open Interest Shorts: | 22.4 | 46.8 | 10.5 |
| – Net Position: | 32,016 | -27,582 | -4,434 |
| – Gross Longs: | 89,564 | 92,597 | 22,626 |
| – Gross Shorts: | 57,548 | 120,179 | 27,060 |
| – Long to Short Ratio: | 1.6 to 1 | 0.8 to 1 | 0.8 to 1 |
| NET POSITION TREND: | |||
| – Strength Index Score (3 Year Range Pct): | 56.0 | 45.4 | 63.5 |
| – Strength Index Reading (3 Year Range): | Bullish | Bearish | Bullish |
| NET POSITION MOVEMENT INDEX: | |||
| – 6-Week Change in Strength Index: | 34.4 | -37.3 | 2.5 |
COTTON Futures:
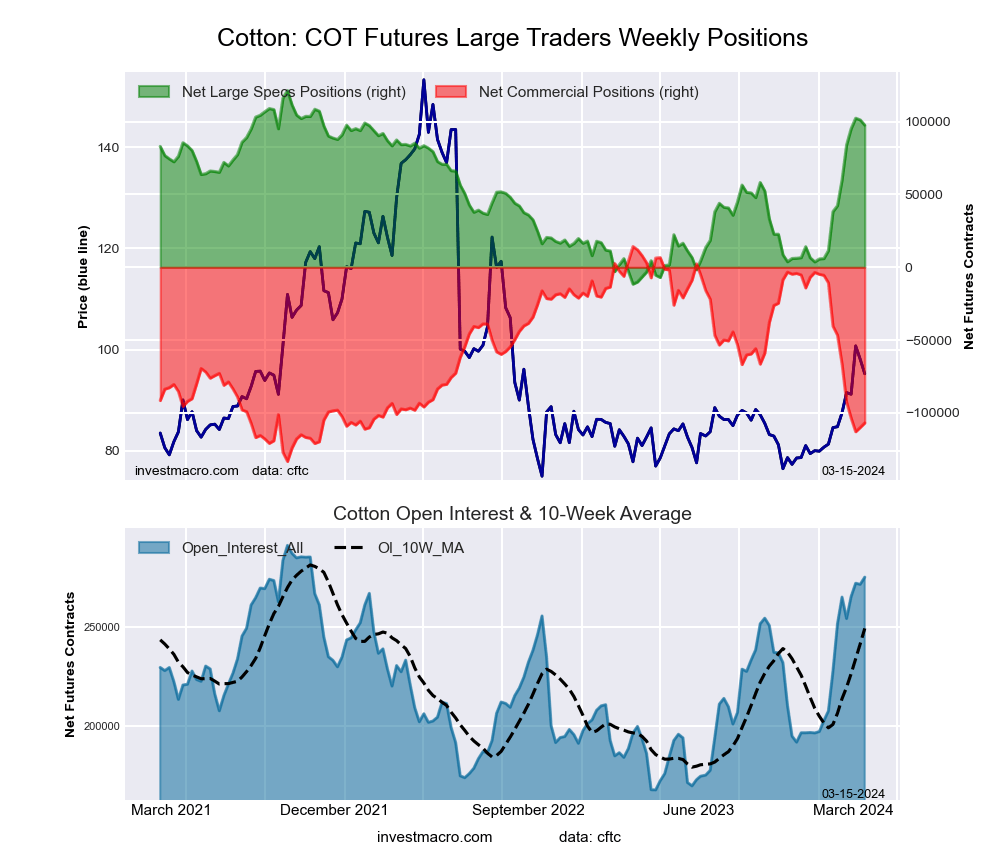 The COTTON large speculator standing this week came in at a net position of 97,513 contracts in the data reported through Tuesday. This was a weekly lowering of -3,599 contracts from the previous week which had a total of 101,112 net contracts.
This week’s current strength score (the trader positioning range over the past three years, measured from 0 to 100) shows the speculators are currently Bullish-Extreme with a score of 82.1 percent. The commercials are Bearish-Extreme with a score of 17.9 percent and the small traders (not shown in chart) are Bullish with a score of 72.8 percent.
Price Trend-Following Model: Uptrend
Our weekly trend-following model classifies the current market price position as: Uptrend. The current action for the model is considered to be: Hold – Maintain Long Position.
| COTTON Futures Statistics | SPECULATORS | COMMERCIALS | SMALL TRADERS |
| – Percent of Open Interest Longs: | 47.2 | 32.6 | 6.7 |
| – Percent of Open Interest Shorts: | 11.7 | 71.4 | 3.3 |
| – Net Position: | 97,513 | -106,880 | 9,367 |
| – Gross Longs: | 129,746 | 89,511 | 18,421 |
| – Gross Shorts: | 32,233 | 196,391 | 9,054 |
| – Long to Short Ratio: | 4.0 to 1 | 0.5 to 1 | 2.0 to 1 |
| NET POSITION TREND: | |||
| – Strength Index Score (3 Year Range Pct): | 82.1 | 17.9 | 72.8 |
| – Strength Index Reading (3 Year Range): | Bullish-Extreme | Bearish-Extreme | Bullish |
| NET POSITION MOVEMENT INDEX: | |||
| – 6-Week Change in Strength Index: | 41.6 | -40.9 | 30.7 |
COCOA Futures:
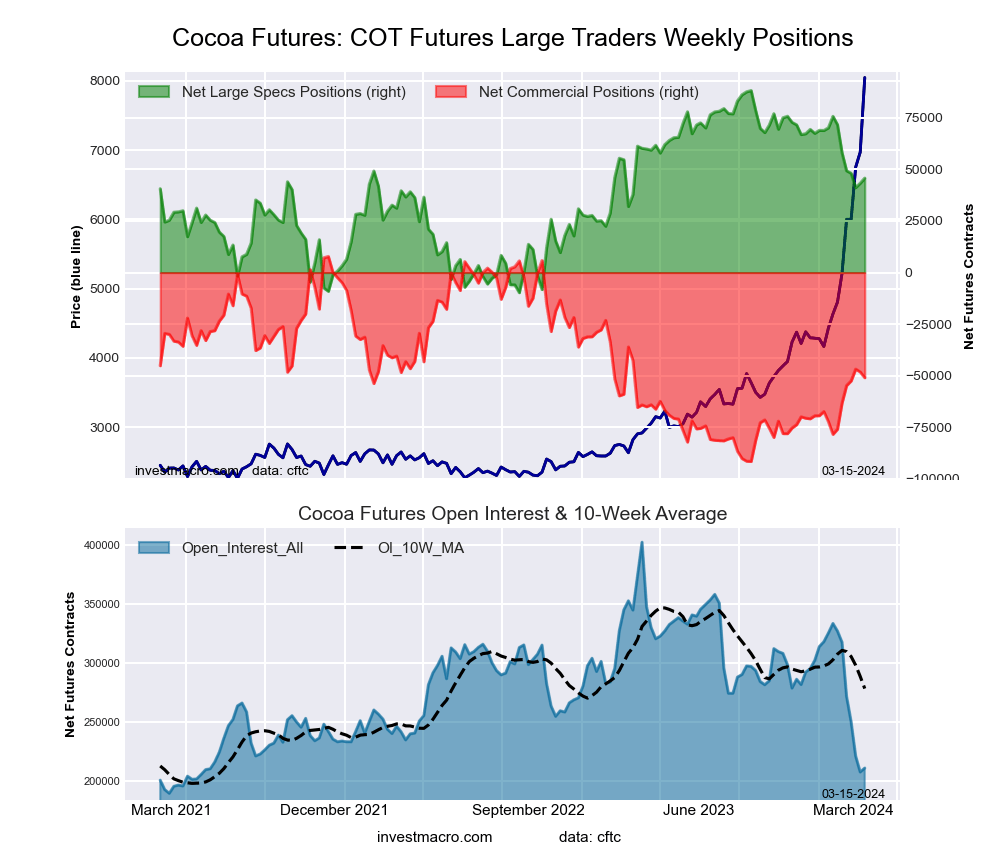 The COCOA large speculator standing this week came in at a net position of 45,772 contracts in the data reported through Tuesday. This was a weekly gain of 2,469 contracts from the previous week which had a total of 43,303 net contracts.
This week’s current strength score (the trader positioning range over the past three years, measured from 0 to 100) shows the speculators are currently Bullish with a score of 56.7 percent. The commercials are Bearish with a score of 40.8 percent and the small traders (not shown in chart) are Bullish with a score of 56.9 percent.
Price Trend-Following Model: Strong Uptrend
Our weekly trend-following model classifies the current market price position as: Strong Uptrend. The current action for the model is considered to be: Hold – Maintain Long Position.
| COCOA Futures Statistics | SPECULATORS | COMMERCIALS | SMALL TRADERS |
| – Percent of Open Interest Longs: | 35.7 | 28.1 | 7.0 |
| – Percent of Open Interest Shorts: | 14.0 | 52.3 | 4.5 |
| – Net Position: | 45,772 | -51,017 | 5,245 |
| – Gross Longs: | 75,301 | 59,269 | 14,812 |
| – Gross Shorts: | 29,529 | 110,286 | 9,567 |
| – Long to Short Ratio: | 2.6 to 1 | 0.5 to 1 | 1.5 to 1 |
| NET POSITION TREND: | |||
| – Strength Index Score (3 Year Range Pct): | 56.7 | 40.8 | 56.9 |
| – Strength Index Reading (3 Year Range): | Bullish | Bearish | Bullish |
| NET POSITION MOVEMENT INDEX: | |||
| – 6-Week Change in Strength Index: | -26.4 | 25.1 | 8.0 |
WHEAT Futures:
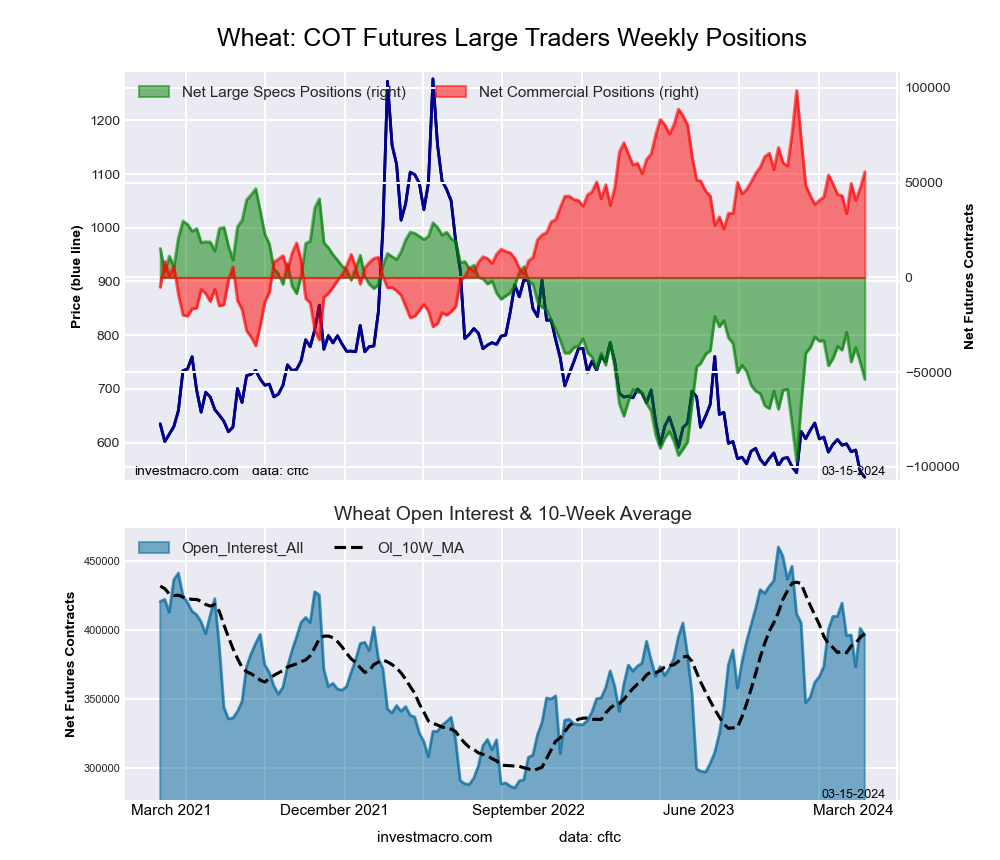 The WHEAT large speculator standing this week came in at a net position of -53,769 contracts in the data reported through Tuesday. This was a weekly decline of -8,981 contracts from the previous week which had a total of -44,788 net contracts.
This week’s current strength score (the trader positioning range over the past three years, measured from 0 to 100) shows the speculators are currently Bearish with a score of 30.2 percent. The commercials are Bullish with a score of 68.2 percent and the small traders (not shown in chart) are Bullish with a score of 57.4 percent.
Price Trend-Following Model: Strong Downtrend
Our weekly trend-following model classifies the current market price position as: Strong Downtrend. The current action for the model is considered to be: Hold – Maintain Short Position.
| WHEAT Futures Statistics | SPECULATORS | COMMERCIALS | SMALL TRADERS |
| – Percent of Open Interest Longs: | 30.4 | 36.3 | 8.1 |
| – Percent of Open Interest Shorts: | 44.0 | 22.3 | 8.6 |
| – Net Position: | -53,769 | 55,780 | -2,011 |
| – Gross Longs: | 120,577 | 143,984 | 31,984 |
| – Gross Shorts: | 174,346 | 88,204 | 33,995 |
| – Long to Short Ratio: | 0.7 to 1 | 1.6 to 1 | 0.9 to 1 |
| NET POSITION TREND: | |||
| – Strength Index Score (3 Year Range Pct): | 30.2 | 68.2 | 57.4 |
| – Strength Index Reading (3 Year Range): | Bearish | Bullish | Bullish |
| NET POSITION MOVEMENT INDEX: | |||
| – 6-Week Change in Strength Index: | -12.0 | 8.9 | 23.3 |
Article By InvestMacro – Receive our weekly COT Newsletter
*COT Report: The COT data, released weekly to the public each Friday, is updated through the most recent Tuesday (data is 3 days old) and shows a quick view of how large speculators or non-commercials (for-profit traders) were positioned in the futures markets.
The CFTC categorizes trader positions according to commercial hedgers (traders who use futures contracts for hedging as part of the business), non-commercials (large traders who speculate to realize trading profits) and nonreportable traders (usually small traders/speculators) as well as their open interest (contracts open in the market at time of reporting). See CFTC criteria here.

- COT Metals Charts: Weekly Speculator Bets see small gains for Silver & Gold Jul 12, 2026
- COT Bonds Charts: Speculator Bets led by SOFR 3-Months & 2-Year Bonds Jul 12, 2026
- COT Energy Charts: Weekly Speculator Changes led by Brent Oil Jul 12, 2026
- COT Soft Commodities Charts: Weekly Speculator Changes led by Sugar, Corn & Soybeans Jul 12, 2026
- The US and European stock indices are rising again amid renewed investor interest in the AI industry. Jul 10, 2026
- USD/JPY Falls as Yen Recovers Weekly Losses Jul 10, 2026
- Crude oil prices surged sharply by 7% in reaction to the rapid escalation of the conflict in the Middle East Jul 9, 2026
- Middle East Tensions Weigh on Gold Jul 9, 2026
- Pound Awaits Tighter Policy from Bank of England Jul 8, 2026
- The United States carried out airstrikes on Iran after Iran’s attacked tankers in the Strait of Hormuz. The RBNZ raised the interest rate to 2.5% Jul 8, 2026