By InvestMacro

Here are the latest charts and statistics for the Commitment of Traders (COT) data published by the Commodities Futures Trading Commission (CFTC).
The latest COT data is updated through Tuesday January 27th and shows a quick view of how large market participants (for-profit speculators and commercial traders) were positioned in the futures markets. All currency positions are in direct relation to the US dollar where, for example, a bet for the euro is a bet that the euro will rise versus the dollar while a bet against the euro will be a bet that the euro will decline versus the dollar.
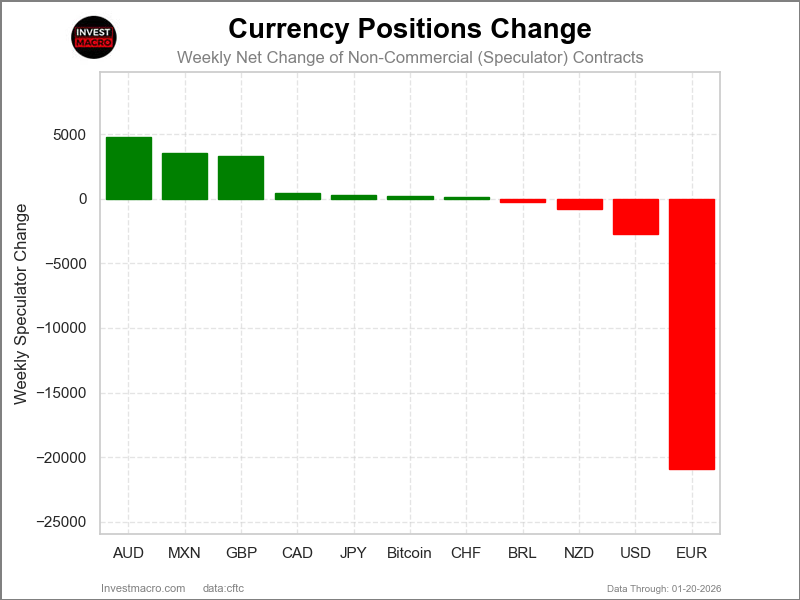
Weekly Speculator Changes led by Canadian Dollar, Australian Dollar & Euro
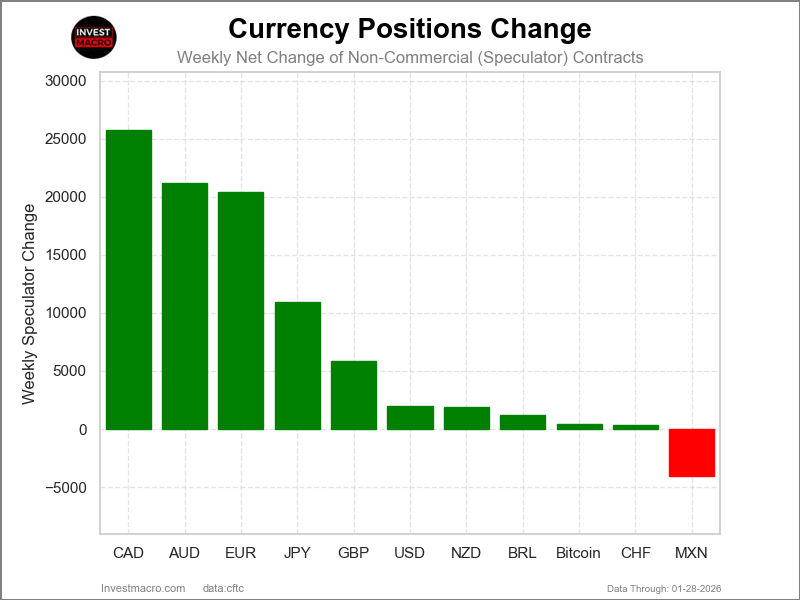
The COT currency market speculator bets were overall decisively higher this week as ten out of the eleven currency markets we cover had higher positioning while the other one markets had lower speculator contracts.
Leading the gains for the currency markets was the Canadian Dollar (25,739 contracts) with the Australian Dollar (21,157 contracts), the EuroFX (20,439 contracts), the Japanese Yen (10,896 contracts), the British Pound (5,818 contracts), the US Dollar Index (2,013 contracts), the New Zealand Dollar (1,865 contracts), the Brazilian Real (1,204 contracts), Bitcoin (392 contracts), and with the Swiss Franc (314 contracts) also showing positive weeks.
The only currency seeing a decline in speculator bets on the week was the Mexican Peso with a decrease of -4,039 contracts.
NZD leads Price Performance Returns for FX this week
In the currency markets this week, the New Zealand Dollar saw the biggest rise on the week with a 1.25% gain in the past five days. The Swiss Franc was higher by 1.12%, followed by the Australian Dollar which rose by 1.01%. The Japanese Yen came in next with a 0.67% rise, followed by the Canadian Dollar which increased by 0.60% on the week, while the Brazilian Real was up by 0.59%. The British Pound also saw a small gain this week with a 0.34% rise, and the Euro rounds out the gainers with a 0.27% increase.
On the downside, the US Dollar Index was virtually unchanged with a small decline of -0.22%, followed by the Mexican Peso which fell by -0.59%. Bitcoin was the biggest loser on the week with a -6.27% drop.
FX COT Data Roundup: Australian Dollar Speculator bets go bullish for 1st time in 59 Weeks
Highlighting this week’s currency speculated data was strong rises in speculative bets for the Canadian Dollar, the Australian Dollar and the Euro.
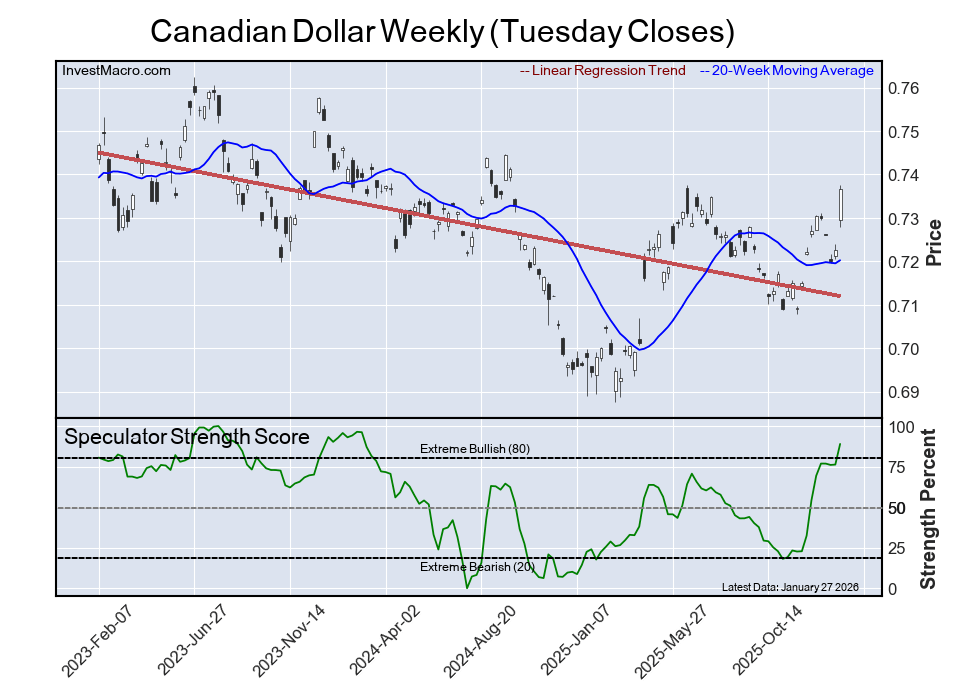
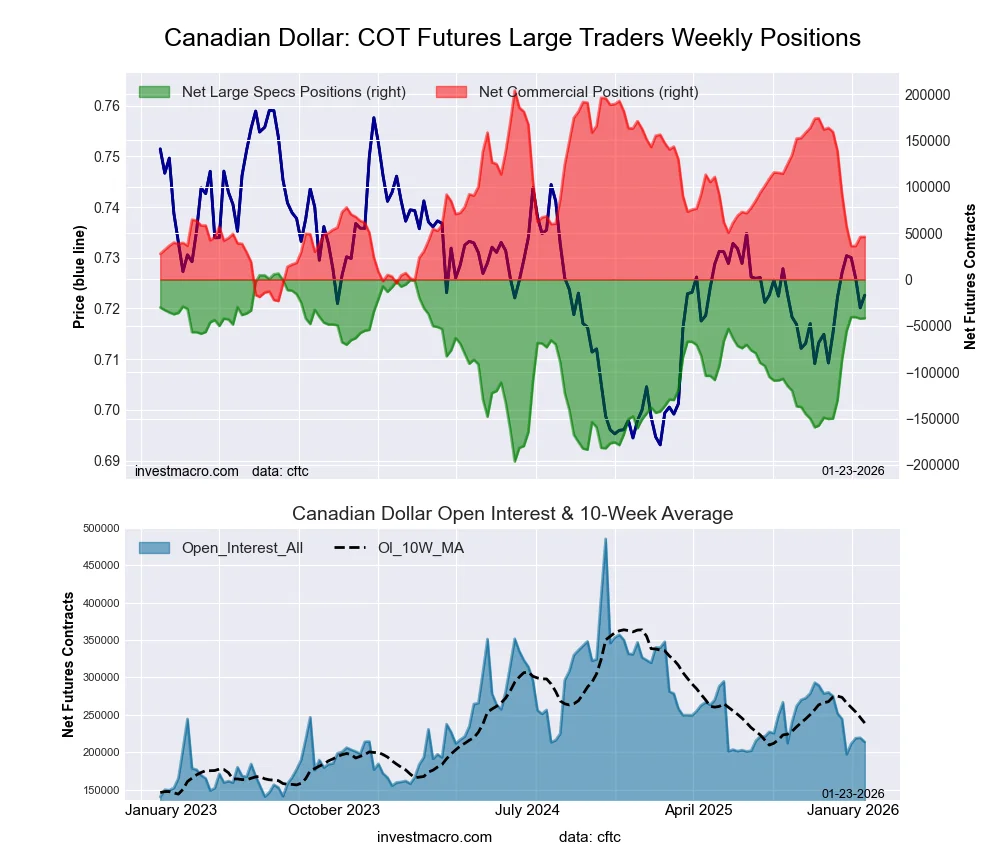
– The Canadian Dollar speculative bets surged the most this week by over 25,000 contracts. This is the second straight week of increases, as well as the seventh time out of the last nine weeks that bets have improved. Overall, the CAD speculator data have been highly negative, with bets being in bearish territory for the past 130 consecutive weeks, dating back to August 1st of 2023. But there has been a sharp turnaround since the end of 2025 as the bearish bets have fallen from a -130,600 on December 9th to this week’s speculative standing at just -16,046 contracts. This is the least bearish position for the Canadian Dollar speculators since February of 2024. In the exchange rate markets, the CAD trades right around the exchange rate of 0.7373 to close out this week. This roughly coincides with the 200-weekly moving average and a close above the 200-weekly moving average would be the first time the Canadian Dollar has been above this measure since August of 2022.
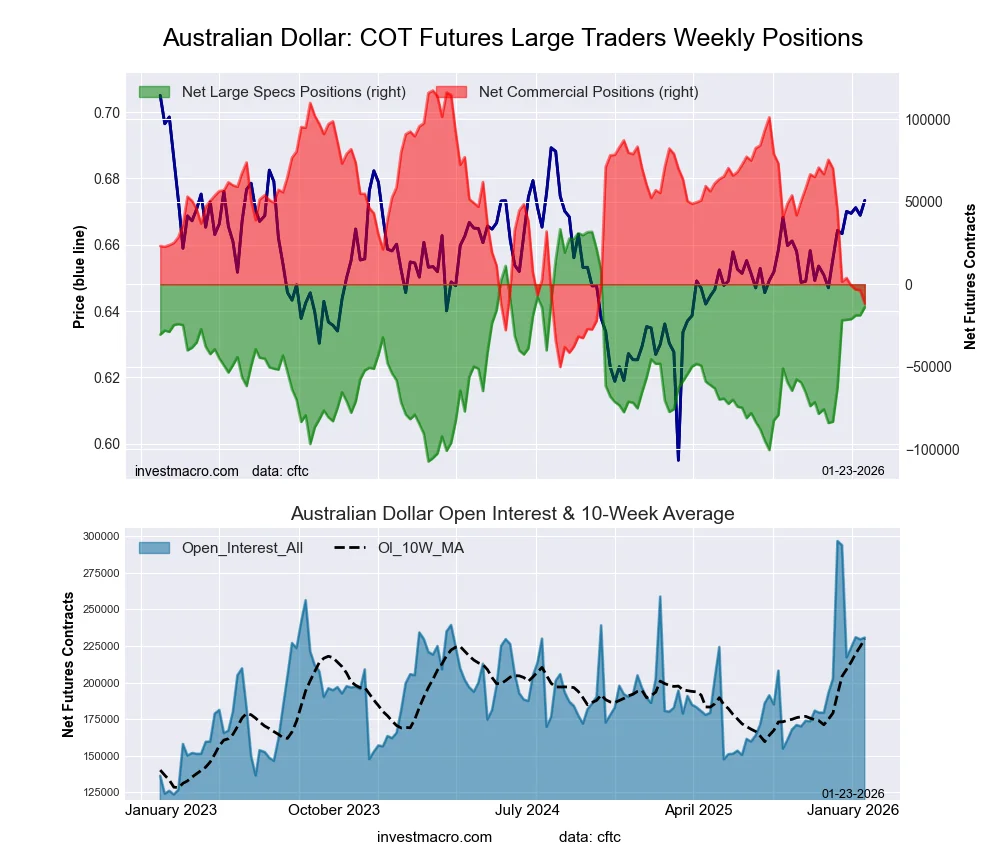
– The Australian Dollar speculative bets jumped by over 21,000 contracts this week and rose for the ninth consecutive week. In these past nine weeks, the speculator bets have increased by a total of 91,322 net contracts. The positive trend in speculator bets has now pushed the Australian Dollar net standing into a bullish position at 7,146 net contracts which marks the first bullish level for the Australian Dollar in the past 59 weeks, dating back to December 10th of 2024. In the exchange rate markets, the Australian Dollar has had two strong consecutive weekly gains, and this week the AUD touched its highest level (vs the USD) since January of 2023. Overall, the Australian Dollar exchange rate versus the USD has now been above its 200-weekly moving average for the past six weeks, which is the first time it has been multiple weeks over the 200-moving average since 2022.
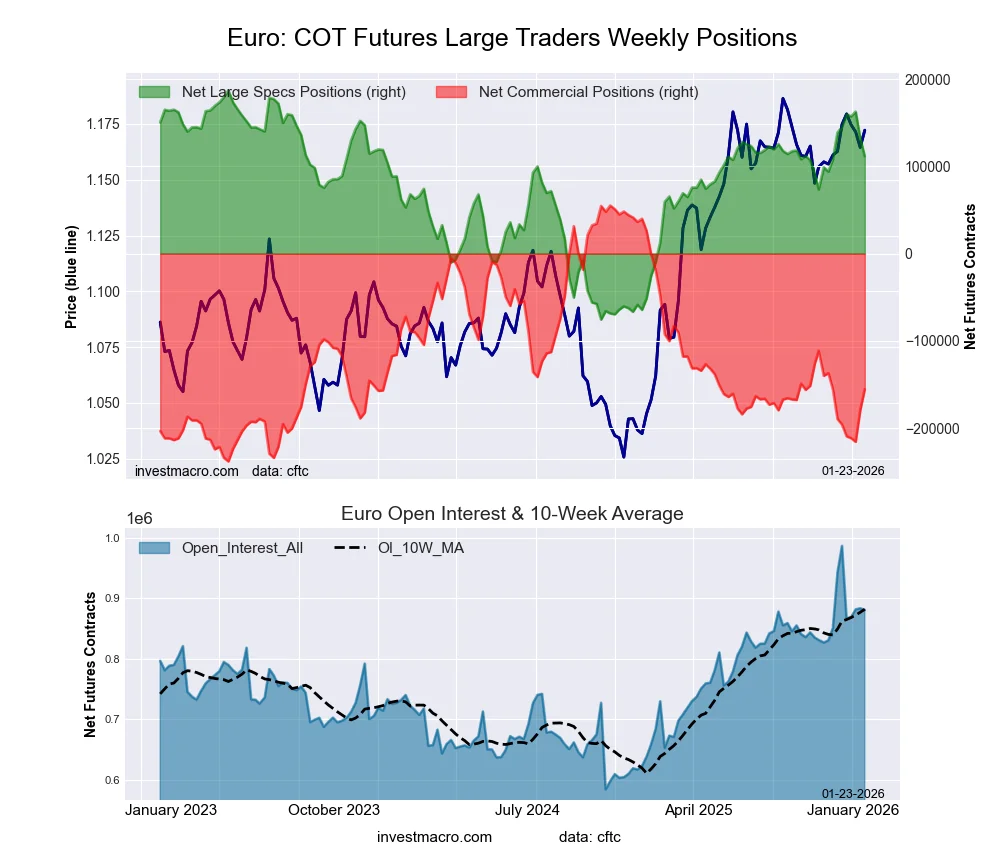
– The Euro currency speculator position saw a rebound by over 20,000 net contracts this week after falling sharply in the previous two weeks. This week’s gain brings the overall net position level back to 132,134 net contracts, which is right around the average of the past 10 weeks. Overall, this is a strong, bullish position for speculators looking for the euro currency to continue to rise higher. Euro bets have now been in a consecutive net bullish position for 47 straight weeks, dating back to March 11th of 2025. And to illustrate the strength of the speculator sentiment, the Euro position has now been over the +100,000 net contract level for 29 out of the last 33 weeks. In the foreign exchange markets this week, the Euro briefly touched its highest level since June of 2021 at over the 1.2100 exchange rate. However, the Euro faltered to end the week with a few down days in a row and closed out trading at the 1.1893 exchange rate versus the US Dollar. Since the beginning of 2025, the Euro was now higher by approximately 16.5% and is up by just about 1% this month, ending January 31st.
– The US Dollar Index speculative bets rose this week after a decline last week, and have actually been higher in eight out of the last nine weeks. Overall, the US Dollar Index speculative positions have now been in a negative net standing for 33 consecutive weeks, dating back to June of 2025. In the exchange rate markets, the Dollar fell by a modest amount this week. And despite touching its lowest level since 2022 around the 95.36 exchange rate, the Dollar Index rallied at the end of the week to close out around the 96.86 price level. Likely helping the US Dollar strength on Friday was a steep sell-off in the precious metals markets to close out the week while also affecting the USD (and going forward) was the announcement of a nomination of a new Federal Reserve Chairman in Kevin Warsh.
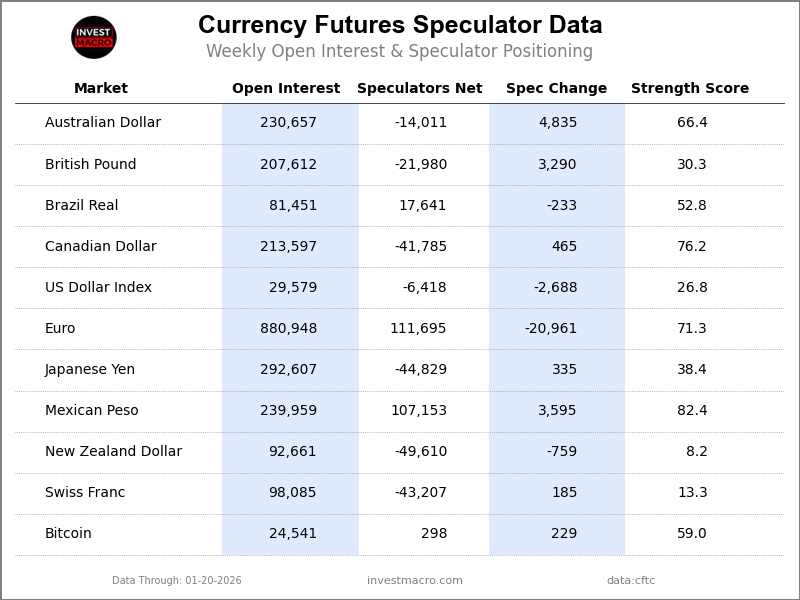
Currencies Data:
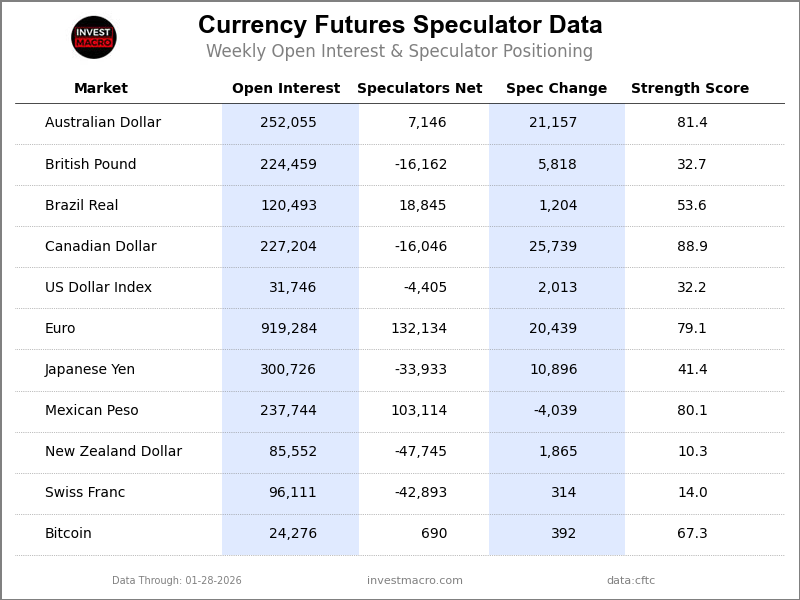
Legend: Open Interest | Speculators Current Net Position | Weekly Specs Change | Specs Strength Score compared to last 3-Years (0-100 range)
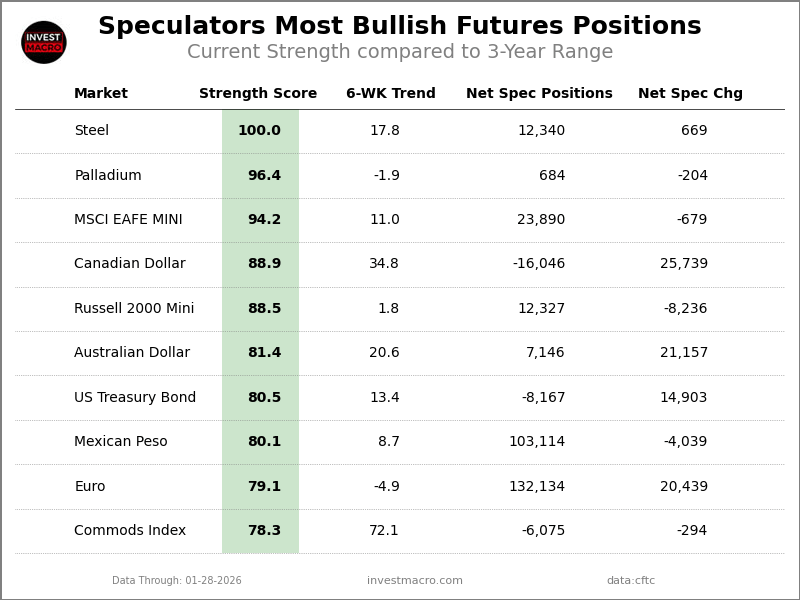
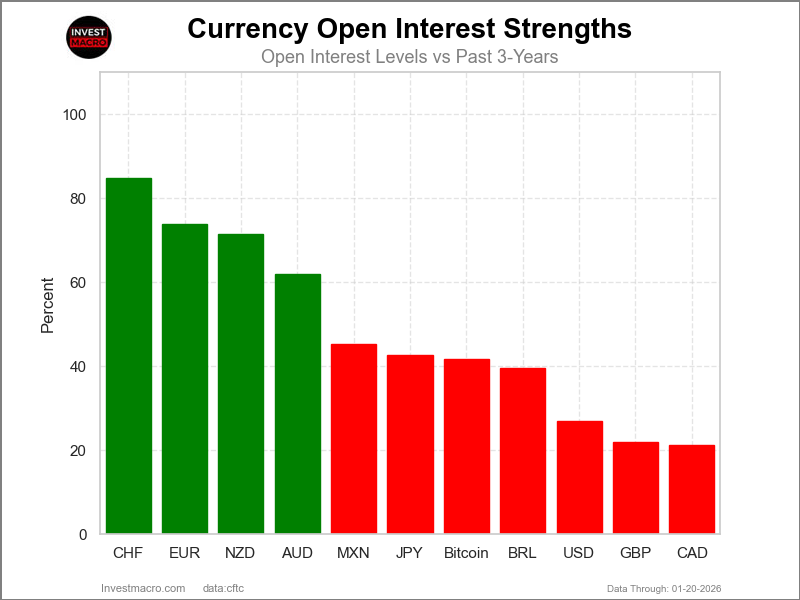
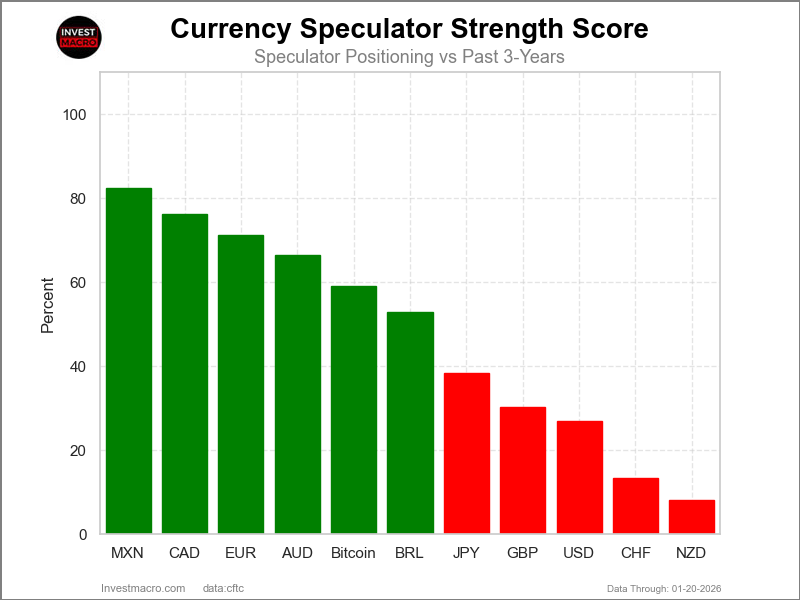
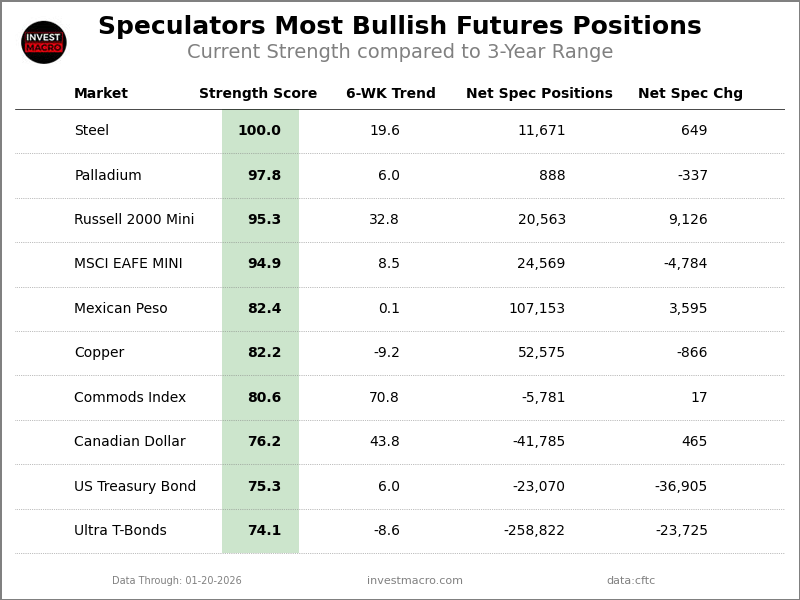
Strength Scores led by Canadian Dollar & Australian Dollar
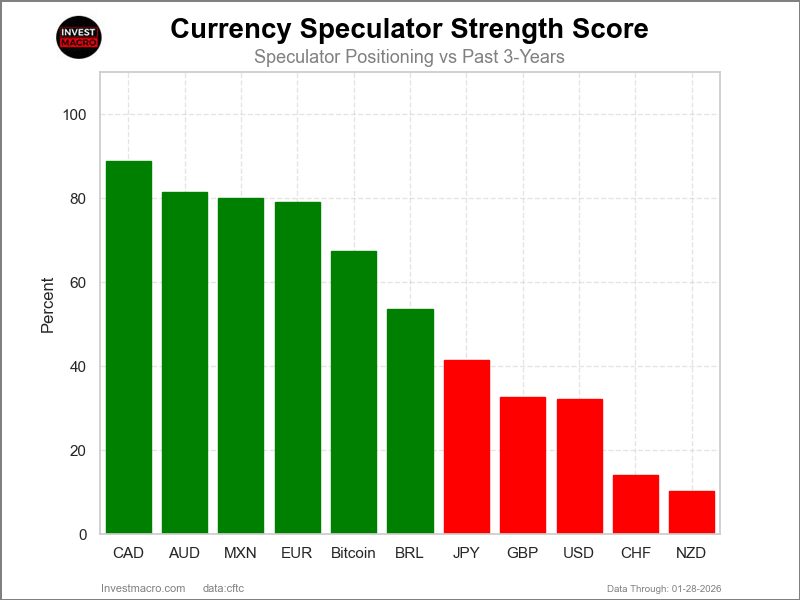
COT Strength Scores (a normalized measure of Speculator positions over a 3-Year range, from 0 to 100 where above 80 is Extreme-Bullish and below 20 is Extreme-Bearish) showed that the Canadian Dollar (89 percent) and the Australian Dollar (81 percent) lead the currency markets this week. The Mexican Peso (80 percent), EuroFX (79 percent) and Bitcoin (67 percent) come in as the next highest in the weekly strength scores.
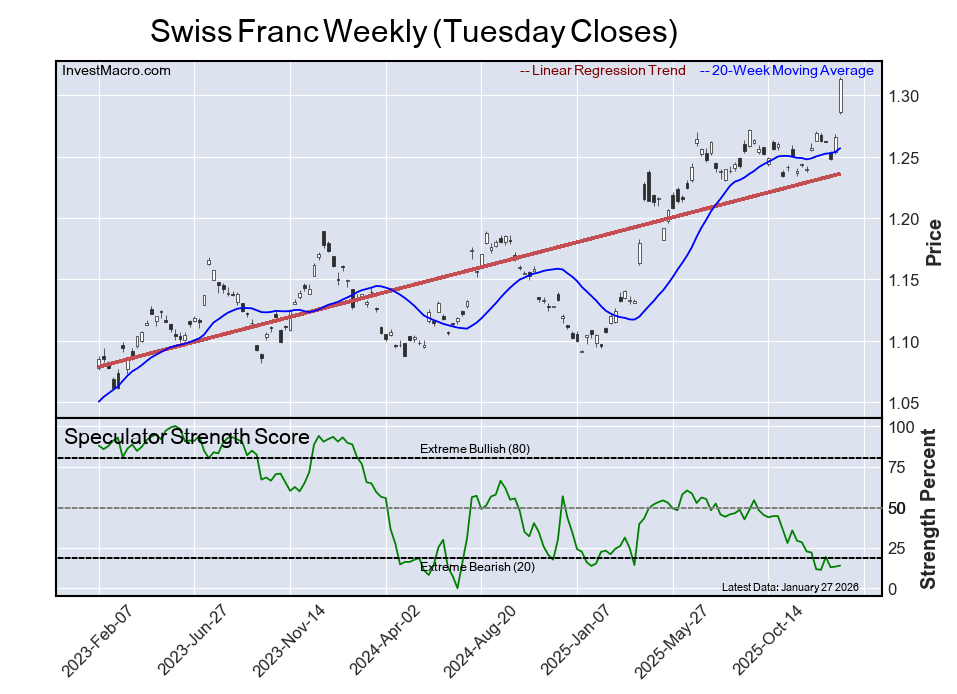
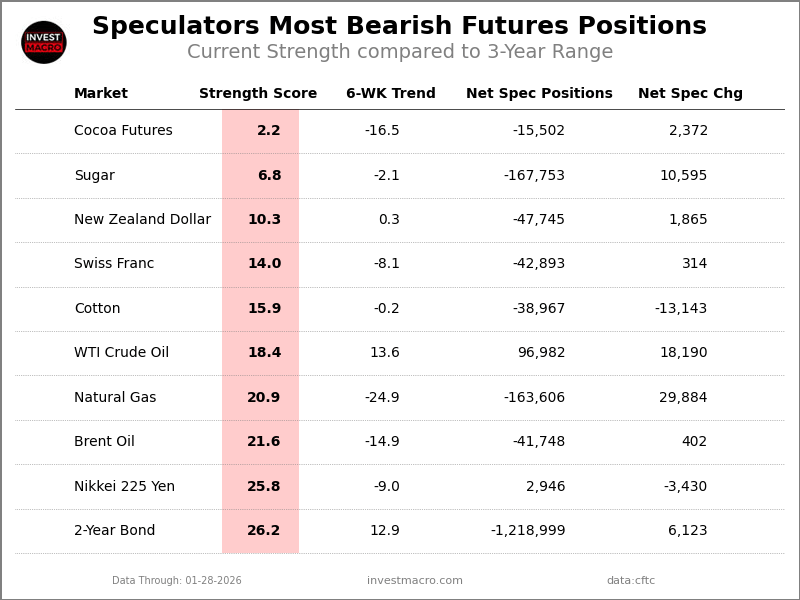
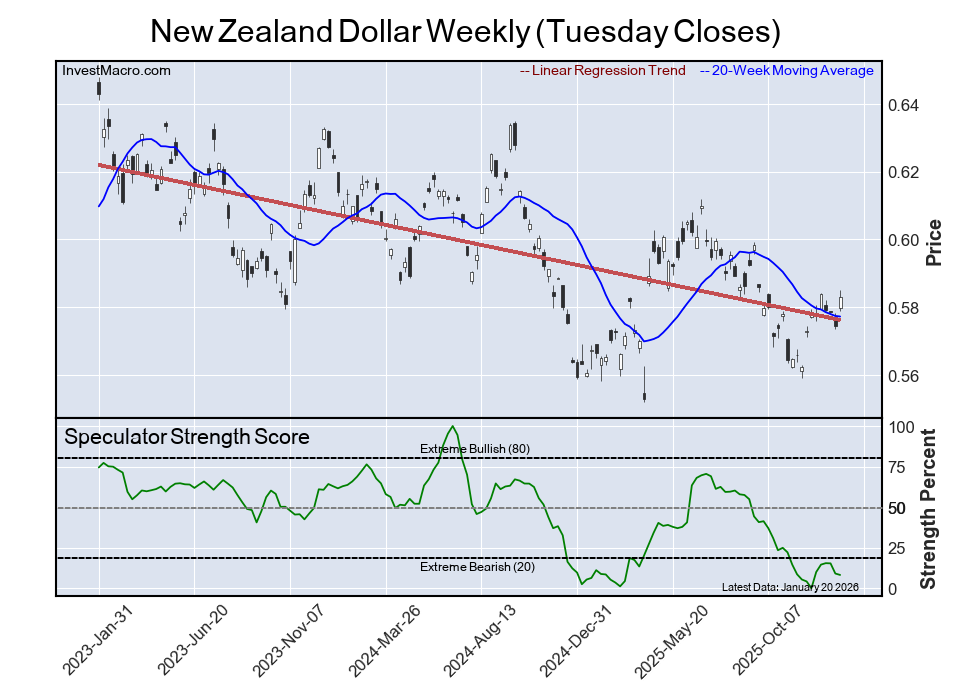
On the downside, the New Zealand Dollar (10 percent) and the Swiss Franc (14 percent) come in at the lowest strength levels currently and are in Extreme-Bearish territory (below 20 percent). The next lowest strength scores are the US Dollar Index (32 percent) and the British Pound (33 percent).
3-Year Strength Statistics:
US Dollar Index (32.2 percent) vs US Dollar Index previous week (26.8 percent)
EuroFX (79.1 percent) vs EuroFX previous week (71.3 percent)
British Pound Sterling (32.7 percent) vs British Pound Sterling previous week (30.3 percent)
Japanese Yen (41.4 percent) vs Japanese Yen previous week (38.4 percent)
Swiss Franc (14.0 percent) vs Swiss Franc previous week (13.3 percent)
Canadian Dollar (88.9 percent) vs Canadian Dollar previous week (76.2 percent)
Australian Dollar (81.4 percent) vs Australian Dollar previous week (66.4 percent)
New Zealand Dollar (10.3 percent) vs New Zealand Dollar previous week (8.2 percent)
Mexican Peso (80.1 percent) vs Mexican Peso previous week (82.3 percent)
Brazilian Real (53.6 percent) vs Brazilian Real previous week (52.8 percent)
Bitcoin (67.3 percent) vs Bitcoin previous week (59.0 percent)
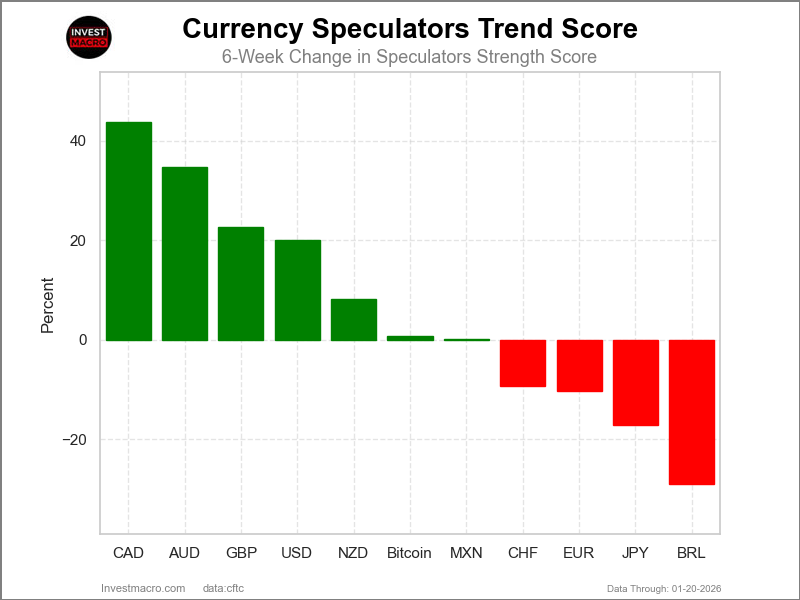
Canadian Dollar & Australian Dollar top the 6-Week Strength Trends
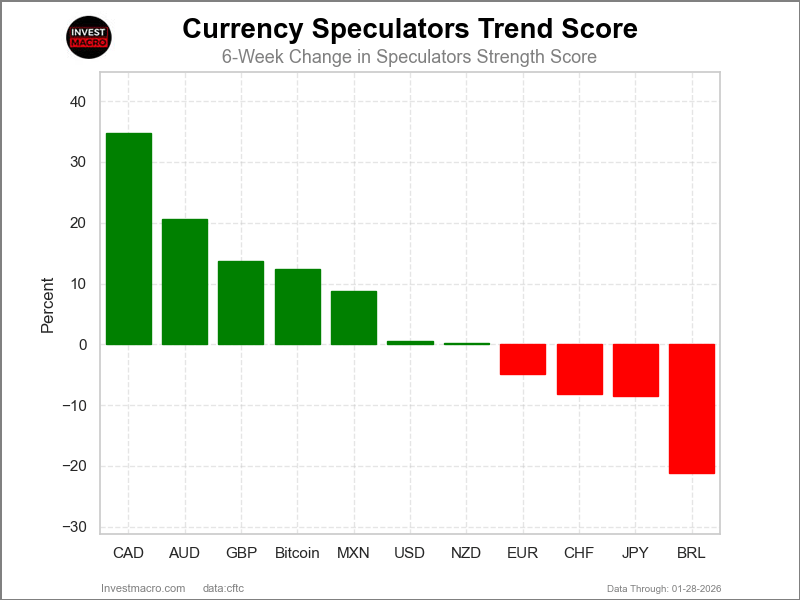
COT Strength Score Trends (or move index, calculates the 6-week changes in strength scores) showed that the Canadian Dollar (35 percent) and the Australian Dollar (21 percent) lead the past six weeks trends for the currencies. The British Pound (14 percent), Bitcoin (12 percent) and the Mexican Peso (9 percent) are the next highest positive movers in the 3-Year trends data.
The Brazilian Real (-21 percent) leads the downside trend scores currently with the Japanese Yen (-9 percent), Swiss Franc (-8 percent) and the EuroFX (-5 percent) following next with lower trend scores.
3-Year Strength Trends:
US Dollar Index (0.5 percent) vs US Dollar Index previous week (20.1 percent)
EuroFX (-4.9 percent) vs EuroFX previous week (-10.3 percent)
British Pound Sterling (13.7 percent) vs British Pound Sterling previous week (22.7 percent)
Japanese Yen (-8.5 percent) vs Japanese Yen previous week (-17.1 percent)
Swiss Franc (-8.1 percent) vs Swiss Franc previous week (-9.3 percent)
Canadian Dollar (34.8 percent) vs Canadian Dollar previous week (43.8 percent)
Australian Dollar (20.6 percent) vs Australian Dollar previous week (34.7 percent)
New Zealand Dollar (0.3 percent) vs New Zealand Dollar previous week (8.2 percent)
Mexican Peso (8.7 percent) vs Mexican Peso previous week (0.1 percent)
Brazilian Real (-21.2 percent) vs Brazilian Real previous week (-29.0 percent)
Bitcoin (12.4 percent) vs Bitcoin previous week (0.7 percent)
Individual COT Forex Markets:
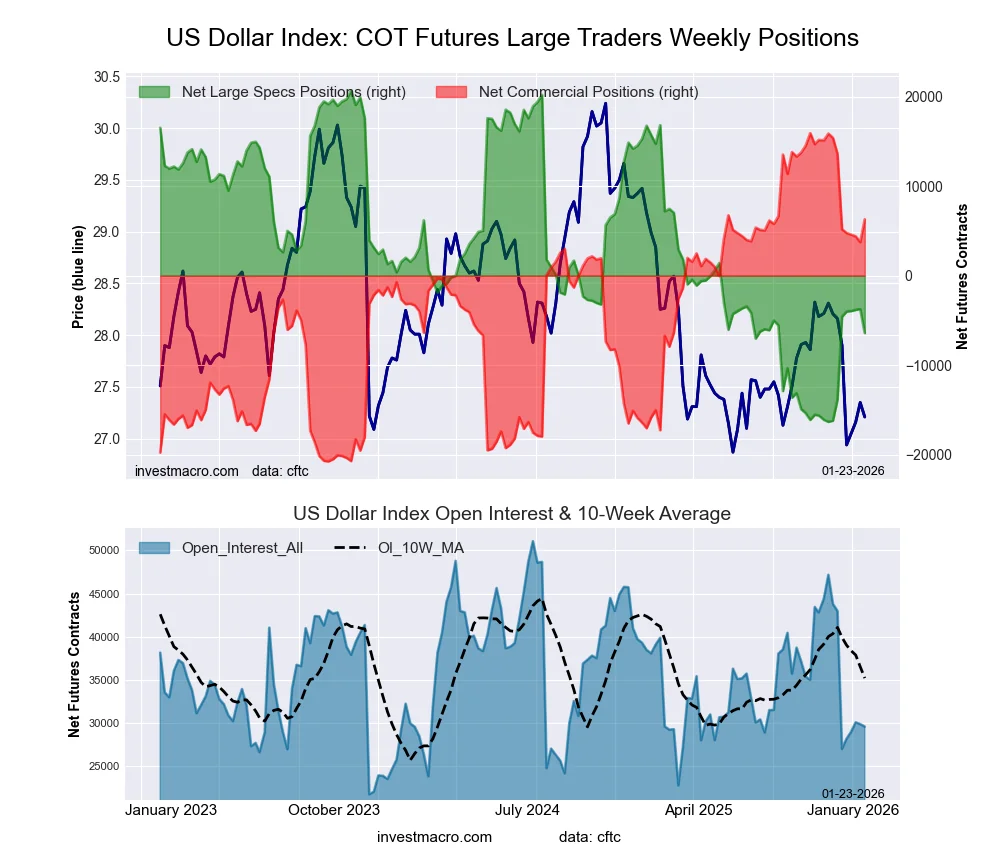
US Dollar Index Futures:
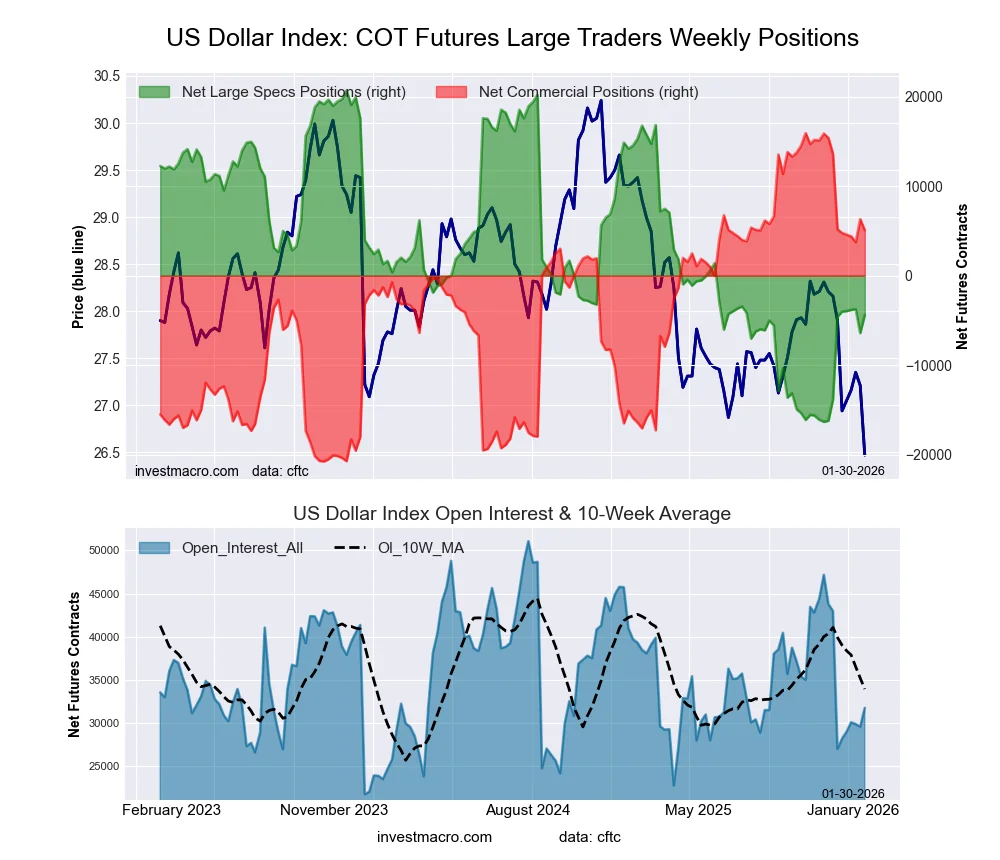 The US Dollar Index large speculator standing this week equaled a net position of -4,405 contracts in the data reported through Tuesday. This was a weekly lift of 2,013 contracts from the previous week which had a total of -6,418 net contracts.
This week’s current strength score (the trader positioning range over the past three years, measured from 0 to 100) shows the speculators are currently Bearish with a score of 32.2 percent. The commercials are Bullish with a score of 70.4 percent and the small traders (not shown in chart) are Bearish with a score of 23.2 percent.
Price Trend-Following Model: Strong Downtrend
Our weekly trend-following model classifies the current market price position as: Strong Downtrend.
| US DOLLAR INDEX Statistics | SPECULATORS | COMMERCIALS | SMALL TRADERS |
| – Percent of Open Interest Longs: | 56.5 | 28.9 | 8.9 |
| – Percent of Open Interest Shorts: | 70.4 | 12.8 | 11.1 |
| – Net Position: | -4,405 | 5,087 | -682 |
| – Gross Longs: | 17,945 | 9,163 | 2,838 |
| – Gross Shorts: | 22,350 | 4,076 | 3,520 |
| – Long to Short Ratio: | 0.8 to 1 | 2.2 to 1 | 0.8 to 1 |
| NET POSITION TREND: | |||
| – Strength Index Score (3 Year Range Pct): | 32.2 | 70.4 | 23.2 |
| – Strength Index Reading (3 Year Range): | Bearish | Bullish | Bearish |
| NET POSITION MOVEMENT INDEX: | |||
| – 6-Week Change in Strength Index: | 0.5 | -0.3 | -1.3 |
Euro Currency Futures:
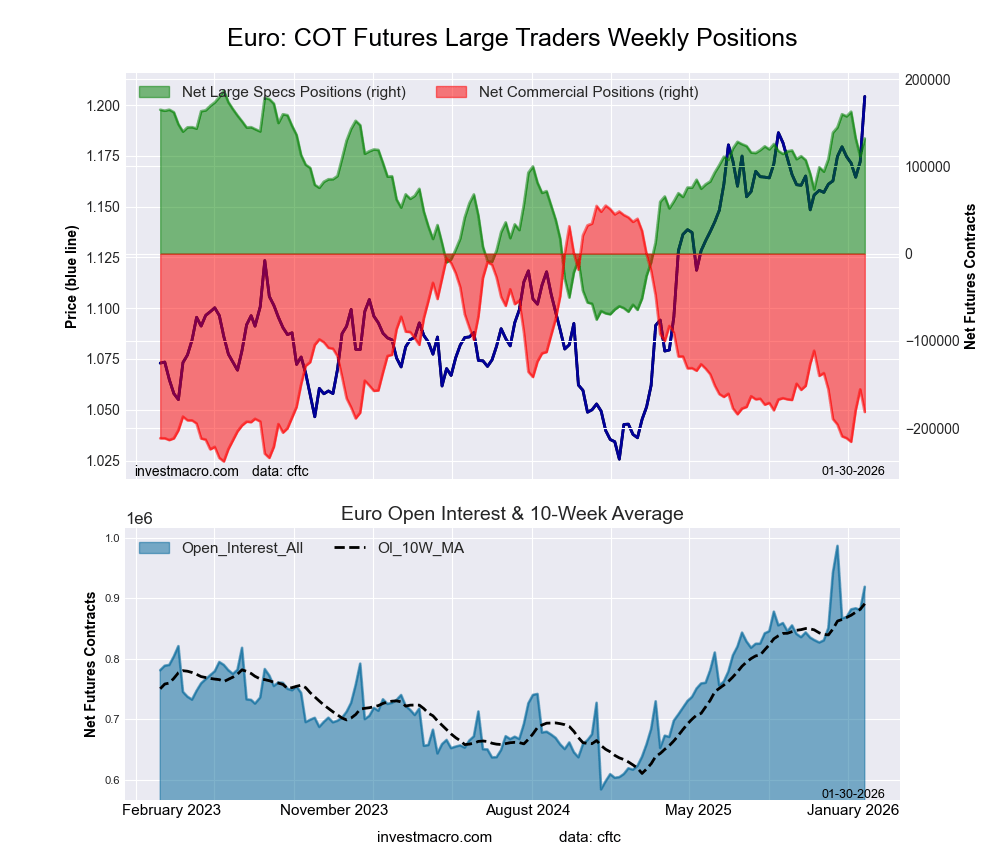 The Euro Currency large speculator standing this week equaled a net position of 132,134 contracts in the data reported through Tuesday. This was a weekly gain of 20,439 contracts from the previous week which had a total of 111,695 net contracts.
This week’s current strength score (the trader positioning range over the past three years, measured from 0 to 100) shows the speculators are currently Bullish with a score of 79.1 percent. The commercials are Bearish-Extreme with a score of 19.3 percent and the small traders (not shown in chart) are Bullish with a score of 78.9 percent.
Price Trend-Following Model: Strong Uptrend
Our weekly trend-following model classifies the current market price position as: Strong Uptrend.
| EURO Currency Statistics | SPECULATORS | COMMERCIALS | SMALL TRADERS |
| – Percent of Open Interest Longs: | 31.6 | 54.4 | 10.2 |
| – Percent of Open Interest Shorts: | 17.2 | 74.1 | 4.9 |
| – Net Position: | 132,134 | -181,604 | 49,470 |
| – Gross Longs: | 290,336 | 499,732 | 94,116 |
| – Gross Shorts: | 158,202 | 681,336 | 44,646 |
| – Long to Short Ratio: | 1.8 to 1 | 0.7 to 1 | 2.1 to 1 |
| NET POSITION TREND: | |||
| – Strength Index Score (3 Year Range Pct): | 79.1 | 19.3 | 78.9 |
| – Strength Index Reading (3 Year Range): | Bullish | Bearish-Extreme | Bullish |
| NET POSITION MOVEMENT INDEX: | |||
| – 6-Week Change in Strength Index: | -4.9 | 4.9 | -3.6 |
British Pound Sterling Futures:
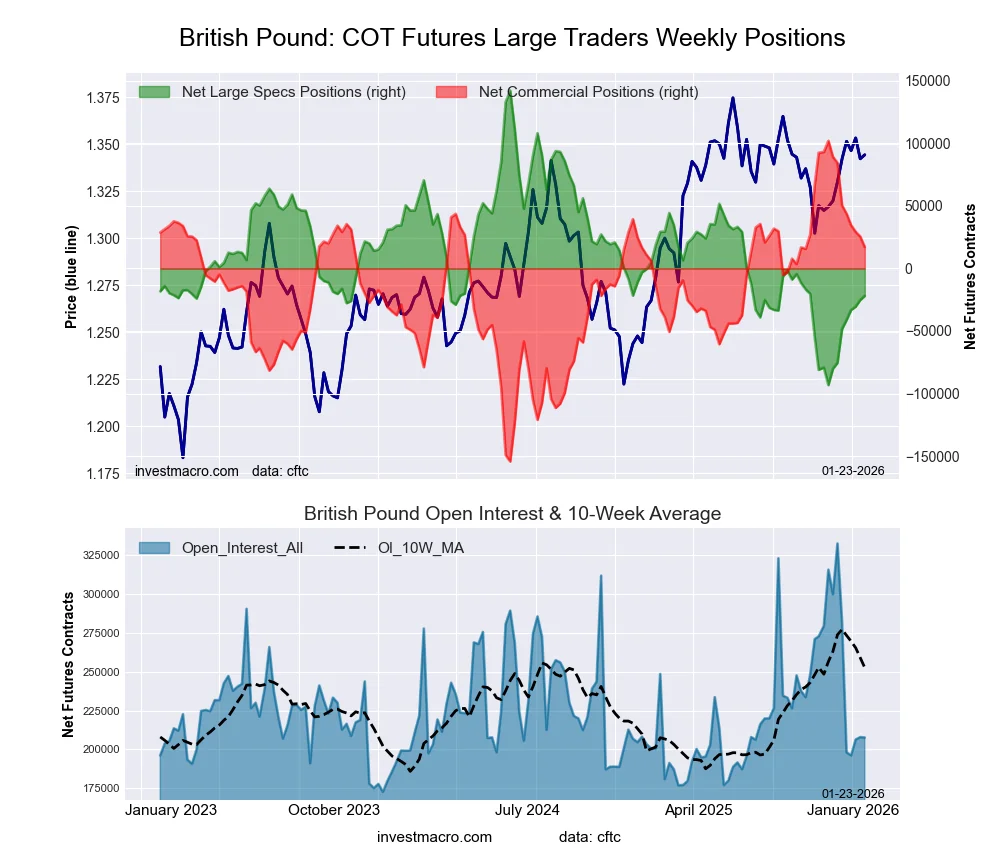
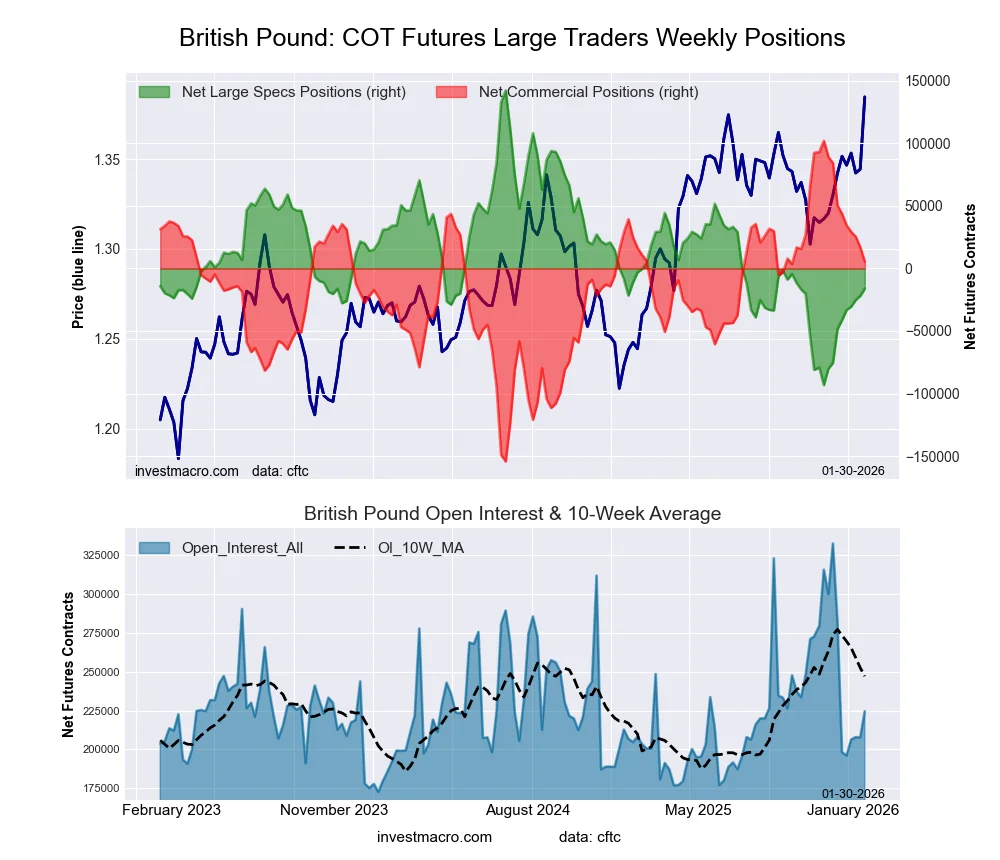 The British Pound Sterling large speculator standing this week equaled a net position of -16,162 contracts in the data reported through Tuesday. This was a weekly rise of 5,818 contracts from the previous week which had a total of -21,980 net contracts.
This week’s current strength score (the trader positioning range over the past three years, measured from 0 to 100) shows the speculators are currently Bearish with a score of 32.7 percent. The commercials are Bullish with a score of 62.3 percent and the small traders (not shown in chart) are Bullish-Extreme with a score of 81.1 percent.
Price Trend-Following Model: Strong Uptrend
Our weekly trend-following model classifies the current market price position as: Strong Uptrend.
| BRITISH POUND Statistics | SPECULATORS | COMMERCIALS | SMALL TRADERS |
| – Percent of Open Interest Longs: | 39.1 | 43.3 | 16.3 |
| – Percent of Open Interest Shorts: | 46.3 | 40.9 | 11.5 |
| – Net Position: | -16,162 | 5,464 | 10,698 |
| – Gross Longs: | 87,786 | 97,216 | 36,620 |
| – Gross Shorts: | 103,948 | 91,752 | 25,922 |
| – Long to Short Ratio: | 0.8 to 1 | 1.1 to 1 | 1.4 to 1 |
| NET POSITION TREND: | |||
| – Strength Index Score (3 Year Range Pct): | 32.7 | 62.3 | 81.1 |
| – Strength Index Reading (3 Year Range): | Bearish | Bullish | Bullish-Extreme |
| NET POSITION MOVEMENT INDEX: | |||
| – 6-Week Change in Strength Index: | 13.7 | -17.5 | 32.8 |
Japanese Yen Futures:
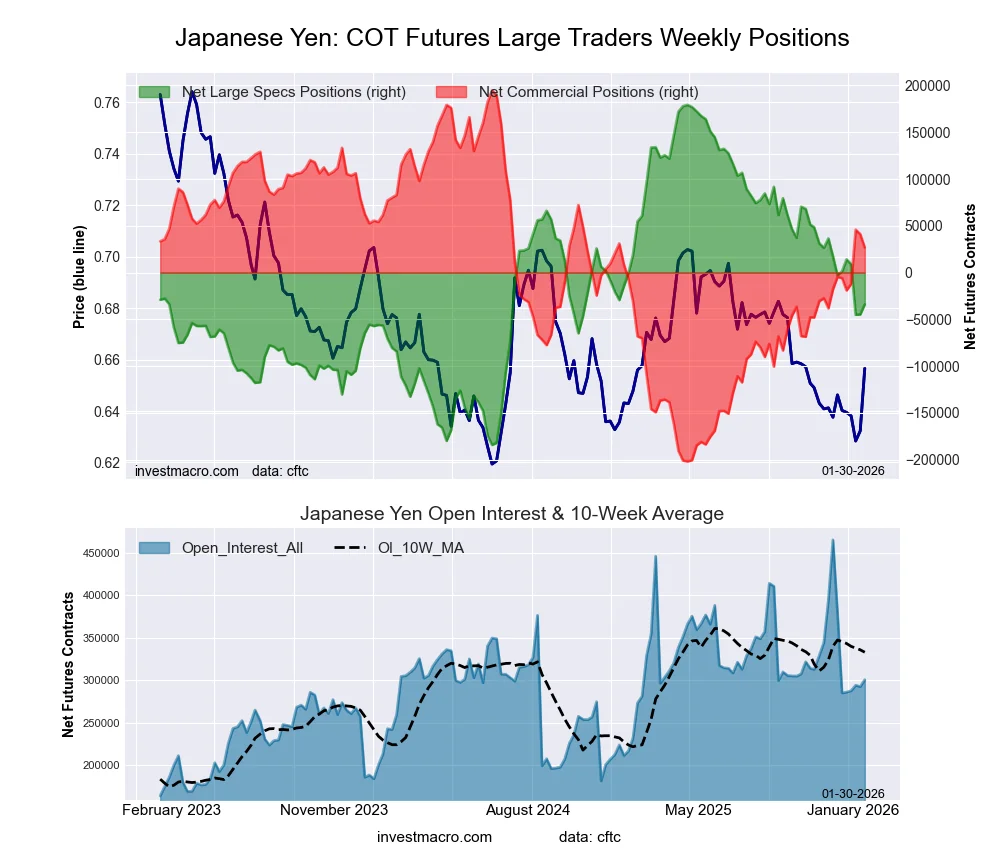 The Japanese Yen large speculator standing this week equaled a net position of -33,933 contracts in the data reported through Tuesday. This was a weekly boost of 10,896 contracts from the previous week which had a total of -44,829 net contracts.
This week’s current strength score (the trader positioning range over the past three years, measured from 0 to 100) shows the speculators are currently Bearish with a score of 41.4 percent. The commercials are Bullish with a score of 57.7 percent and the small traders (not shown in chart) are Bullish with a score of 55.5 percent.
Price Trend-Following Model: Downtrend
Our weekly trend-following model classifies the current market price position as: Downtrend.
| JAPANESE YEN Statistics | SPECULATORS | COMMERCIALS | SMALL TRADERS |
| – Percent of Open Interest Longs: | 34.7 | 41.6 | 14.2 |
| – Percent of Open Interest Shorts: | 46.0 | 32.7 | 11.8 |
| – Net Position: | -33,933 | 26,709 | 7,224 |
| – Gross Longs: | 104,460 | 125,157 | 42,786 |
| – Gross Shorts: | 138,393 | 98,448 | 35,562 |
| – Long to Short Ratio: | 0.8 to 1 | 1.3 to 1 | 1.2 to 1 |
| NET POSITION TREND: | |||
| – Strength Index Score (3 Year Range Pct): | 41.4 | 57.7 | 55.5 |
| – Strength Index Reading (3 Year Range): | Bearish | Bullish | Bullish |
| NET POSITION MOVEMENT INDEX: | |||
| – 6-Week Change in Strength Index: | -8.5 | 7.9 | -1.2 |
Swiss Franc Futures:
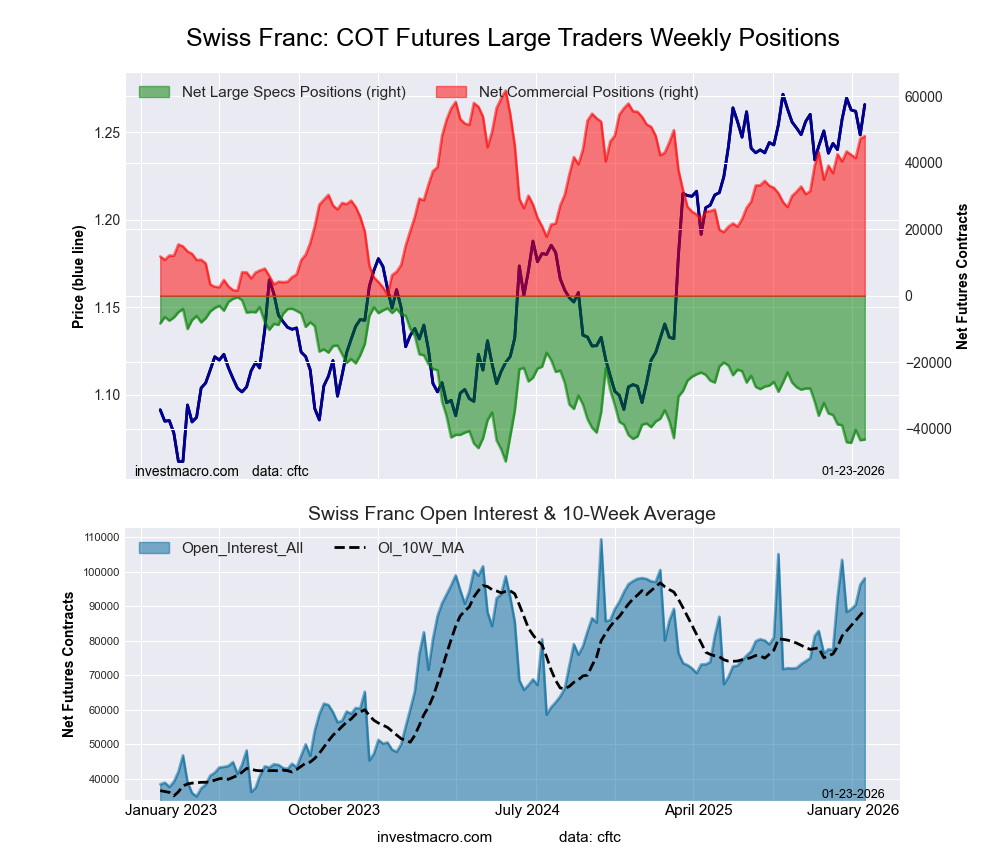
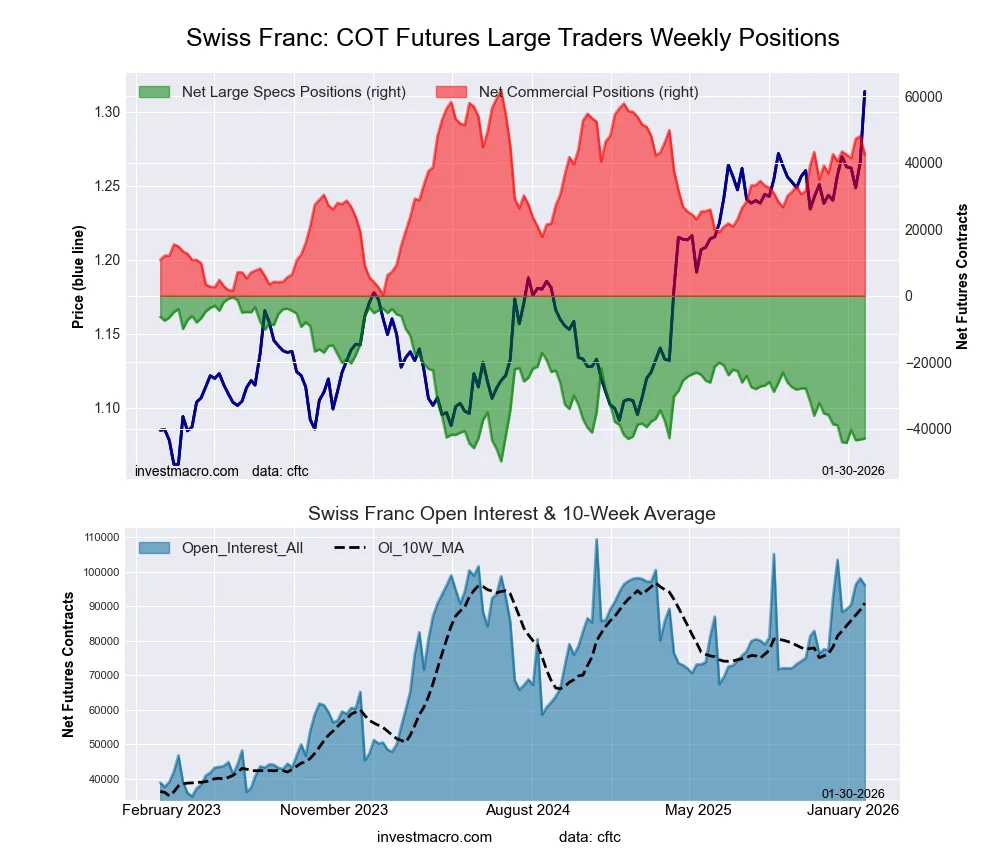 The Swiss Franc large speculator standing this week equaled a net position of -42,893 contracts in the data reported through Tuesday. This was a weekly lift of 314 contracts from the previous week which had a total of -43,207 net contracts.
This week’s current strength score (the trader positioning range over the past three years, measured from 0 to 100) shows the speculators are currently Bearish-Extreme with a score of 14.0 percent. The commercials are Bullish with a score of 68.6 percent and the small traders (not shown in chart) are Bullish-Extreme with a score of 80.8 percent.
Price Trend-Following Model: Strong Uptrend
Our weekly trend-following model classifies the current market price position as: Strong Uptrend.
| SWISS FRANC Statistics | SPECULATORS | COMMERCIALS | SMALL TRADERS |
| – Percent of Open Interest Longs: | 10.1 | 70.5 | 19.3 |
| – Percent of Open Interest Shorts: | 54.7 | 26.4 | 18.8 |
| – Net Position: | -42,893 | 42,406 | 487 |
| – Gross Longs: | 9,724 | 67,805 | 18,510 |
| – Gross Shorts: | 52,617 | 25,399 | 18,023 |
| – Long to Short Ratio: | 0.2 to 1 | 2.7 to 1 | 1.0 to 1 |
| NET POSITION TREND: | |||
| – Strength Index Score (3 Year Range Pct): | 14.0 | 68.6 | 80.8 |
| – Strength Index Reading (3 Year Range): | Bearish-Extreme | Bullish | Bullish-Extreme |
| NET POSITION MOVEMENT INDEX: | |||
| – 6-Week Change in Strength Index: | -8.1 | 3.3 | 8.3 |
Canadian Dollar Futures:
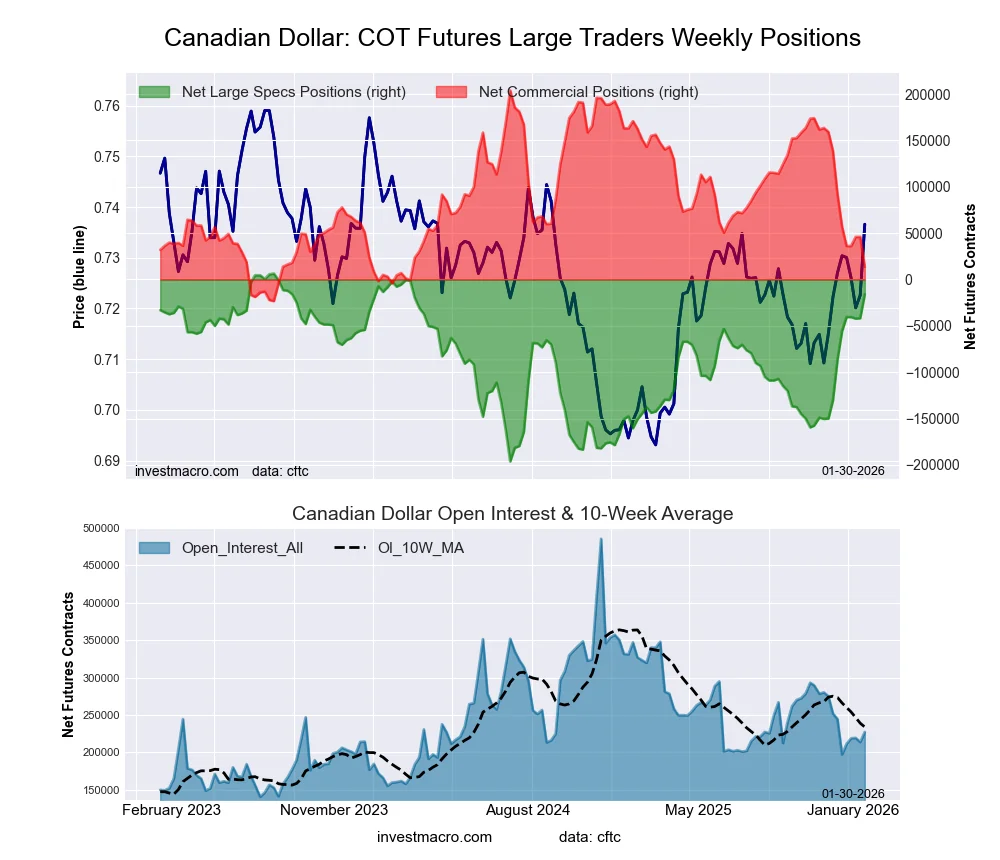 The Canadian Dollar large speculator standing this week equaled a net position of -16,046 contracts in the data reported through Tuesday. This was a weekly advance of 25,739 contracts from the previous week which had a total of -41,785 net contracts.
This week’s current strength score (the trader positioning range over the past three years, measured from 0 to 100) shows the speculators are currently Bullish-Extreme with a score of 88.9 percent. The commercials are Bearish-Extreme with a score of 16.3 percent and the small traders (not shown in chart) are Bullish with a score of 51.8 percent.
Price Trend-Following Model: Strong Uptrend
Our weekly trend-following model classifies the current market price position as: Strong Uptrend.
| CANADIAN DOLLAR Statistics | SPECULATORS | COMMERCIALS | SMALL TRADERS |
| – Percent of Open Interest Longs: | 34.0 | 52.2 | 12.6 |
| – Percent of Open Interest Shorts: | 41.0 | 46.1 | 11.5 |
| – Net Position: | -16,046 | 13,734 | 2,312 |
| – Gross Longs: | 77,169 | 118,539 | 28,551 |
| – Gross Shorts: | 93,215 | 104,805 | 26,239 |
| – Long to Short Ratio: | 0.8 to 1 | 1.1 to 1 | 1.1 to 1 |
| NET POSITION TREND: | |||
| – Strength Index Score (3 Year Range Pct): | 88.9 | 16.3 | 51.8 |
| – Strength Index Reading (3 Year Range): | Bullish-Extreme | Bearish-Extreme | Bullish |
| NET POSITION MOVEMENT INDEX: | |||
| – 6-Week Change in Strength Index: | 34.8 | -34.6 | 22.1 |
Australian Dollar Futures:
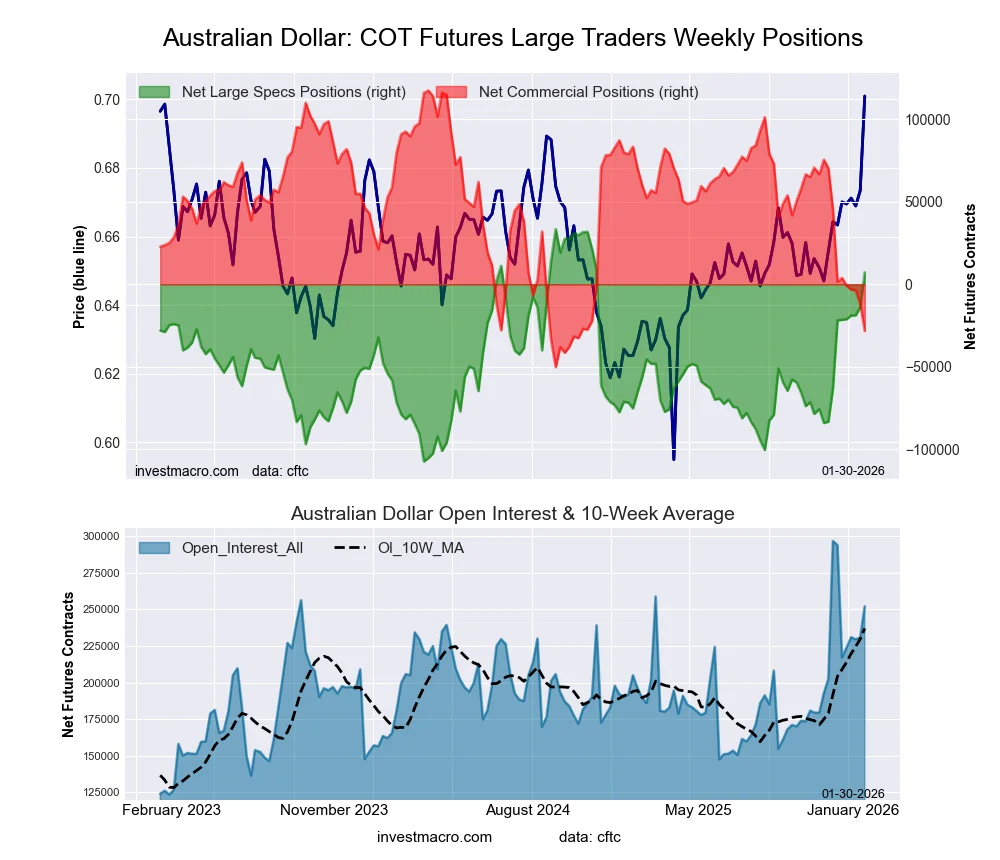 The Australian Dollar large speculator standing this week equaled a net position of 7,146 contracts in the data reported through Tuesday. This was a weekly boost of 21,157 contracts from the previous week which had a total of -14,011 net contracts.
This week’s current strength score (the trader positioning range over the past three years, measured from 0 to 100) shows the speculators are currently Bullish-Extreme with a score of 81.4 percent. The commercials are Bearish-Extreme with a score of 13.1 percent and the small traders (not shown in chart) are Bullish-Extreme with a score of 89.6 percent.
Price Trend-Following Model: Strong Uptrend
Our weekly trend-following model classifies the current market price position as: Strong Uptrend.
| AUSTRALIAN DOLLAR Statistics | SPECULATORS | COMMERCIALS | SMALL TRADERS |
| – Percent of Open Interest Longs: | 43.6 | 39.7 | 16.1 |
| – Percent of Open Interest Shorts: | 40.7 | 50.9 | 7.7 |
| – Net Position: | 7,146 | -28,309 | 21,163 |
| – Gross Longs: | 109,806 | 100,026 | 40,630 |
| – Gross Shorts: | 102,660 | 128,335 | 19,467 |
| – Long to Short Ratio: | 1.1 to 1 | 0.8 to 1 | 2.1 to 1 |
| NET POSITION TREND: | |||
| – Strength Index Score (3 Year Range Pct): | 81.4 | 13.1 | 89.6 |
| – Strength Index Reading (3 Year Range): | Bullish-Extreme | Bearish-Extreme | Bullish-Extreme |
| NET POSITION MOVEMENT INDEX: | |||
| – 6-Week Change in Strength Index: | 20.6 | -17.8 | 1.9 |
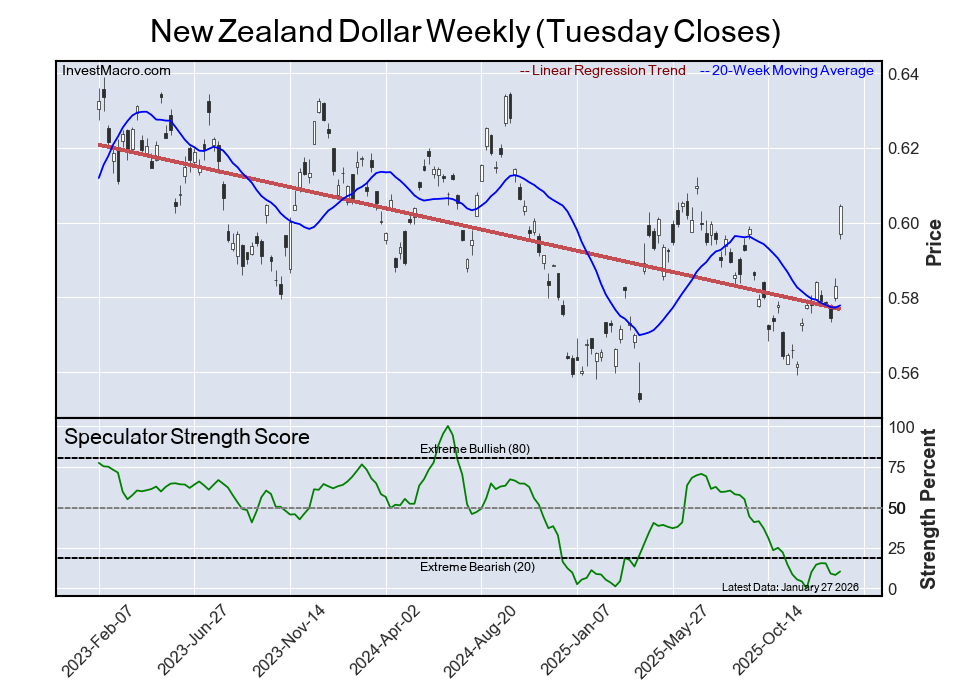
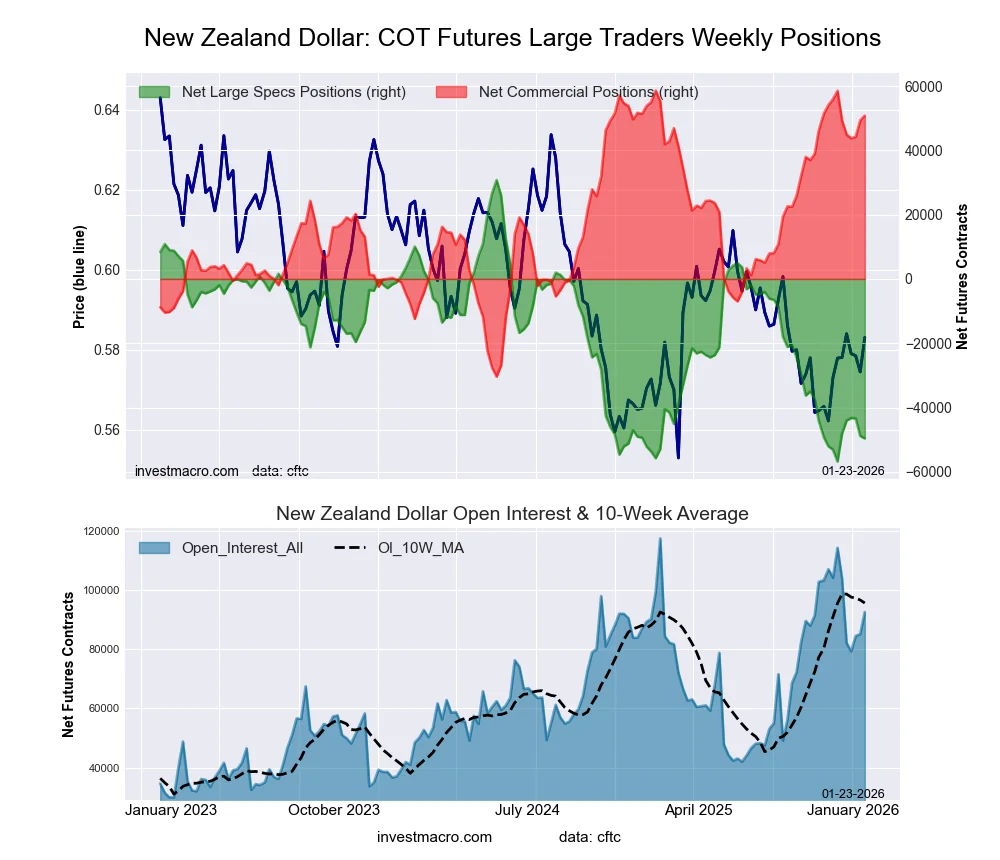
New Zealand Dollar Futures:
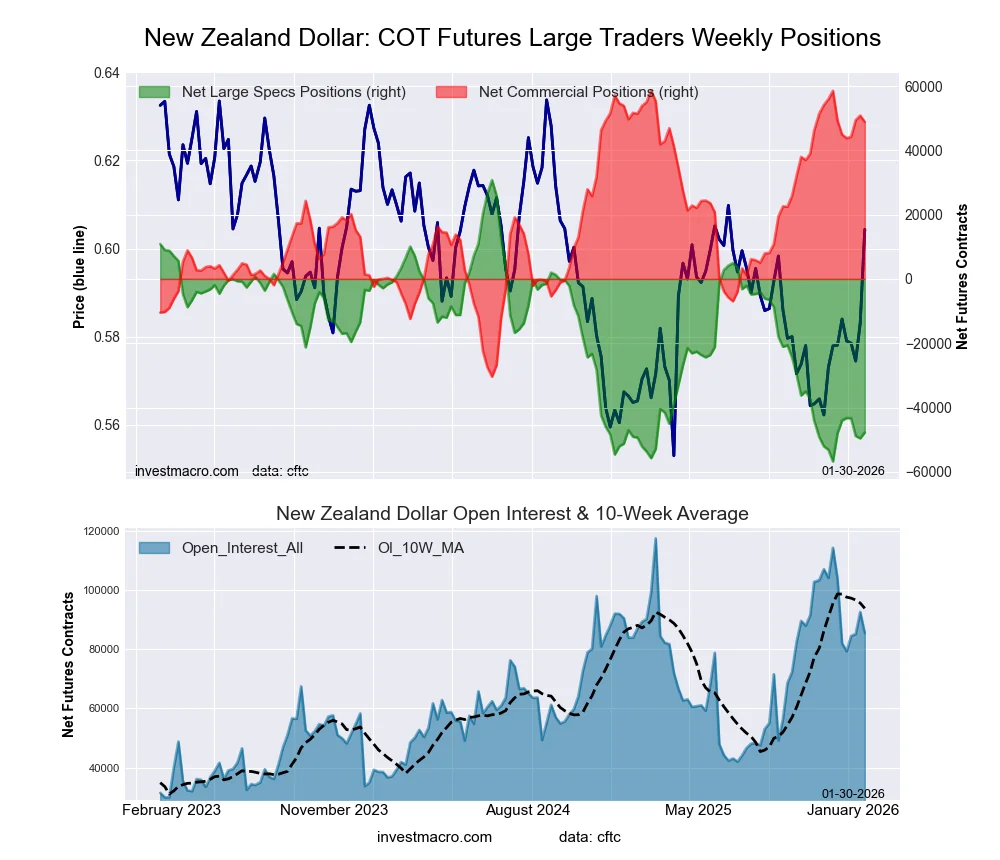 The New Zealand Dollar large speculator standing this week equaled a net position of -47,745 contracts in the data reported through Tuesday. This was a weekly increase of 1,865 contracts from the previous week which had a total of -49,610 net contracts.
This week’s current strength score (the trader positioning range over the past three years, measured from 0 to 100) shows the speculators are currently Bearish-Extreme with a score of 10.3 percent. The commercials are Bullish-Extreme with a score of 89.1 percent and the small traders (not shown in chart) are Bearish with a score of 37.7 percent.
Price Trend-Following Model: Strong Uptrend
Our weekly trend-following model classifies the current market price position as: Strong Uptrend.
| NEW ZEALAND DOLLAR Statistics | SPECULATORS | COMMERCIALS | SMALL TRADERS |
| – Percent of Open Interest Longs: | 14.1 | 80.8 | 4.3 |
| – Percent of Open Interest Shorts: | 69.9 | 23.6 | 5.6 |
| – Net Position: | -47,745 | 48,868 | -1,123 |
| – Gross Longs: | 12,074 | 69,085 | 3,655 |
| – Gross Shorts: | 59,819 | 20,217 | 4,778 |
| – Long to Short Ratio: | 0.2 to 1 | 3.4 to 1 | 0.8 to 1 |
| NET POSITION TREND: | |||
| – Strength Index Score (3 Year Range Pct): | 10.3 | 89.1 | 37.7 |
| – Strength Index Reading (3 Year Range): | Bearish-Extreme | Bullish-Extreme | Bearish |
| NET POSITION MOVEMENT INDEX: | |||
| – 6-Week Change in Strength Index: | 0.3 | -0.4 | 1.2 |
Mexican Peso Futures:
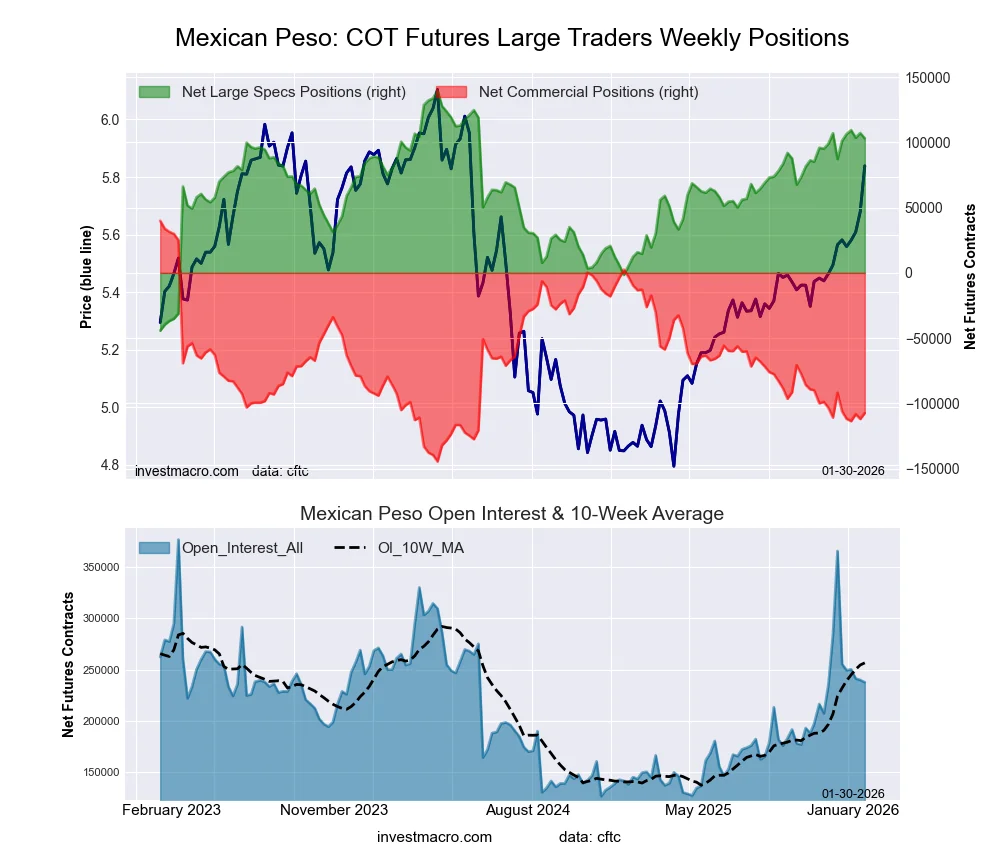 The Mexican Peso large speculator standing this week equaled a net position of 103,114 contracts in the data reported through Tuesday. This was a weekly fall of -4,039 contracts from the previous week which had a total of 107,153 net contracts.
This week’s current strength score (the trader positioning range over the past three years, measured from 0 to 100) shows the speculators are currently Bullish-Extreme with a score of 80.1 percent. The commercials are Bearish with a score of 20.1 percent and the small traders (not shown in chart) are Bearish with a score of 46.2 percent.
Price Trend-Following Model: Strong Uptrend
Our weekly trend-following model classifies the current market price position as: Strong Uptrend.
| MEXICAN PESO Statistics | SPECULATORS | COMMERCIALS | SMALL TRADERS |
| – Percent of Open Interest Longs: | 62.7 | 33.6 | 3.1 |
| – Percent of Open Interest Shorts: | 19.3 | 78.7 | 1.3 |
| – Net Position: | 103,114 | -107,349 | 4,235 |
| – Gross Longs: | 149,094 | 79,827 | 7,389 |
| – Gross Shorts: | 45,980 | 187,176 | 3,154 |
| – Long to Short Ratio: | 3.2 to 1 | 0.4 to 1 | 2.3 to 1 |
| NET POSITION TREND: | |||
| – Strength Index Score (3 Year Range Pct): | 80.1 | 20.1 | 46.2 |
| – Strength Index Reading (3 Year Range): | Bullish-Extreme | Bearish | Bearish |
| NET POSITION MOVEMENT INDEX: | |||
| – 6-Week Change in Strength Index: | 8.7 | -8.5 | -2.2 |
Brazilian Real Futures:
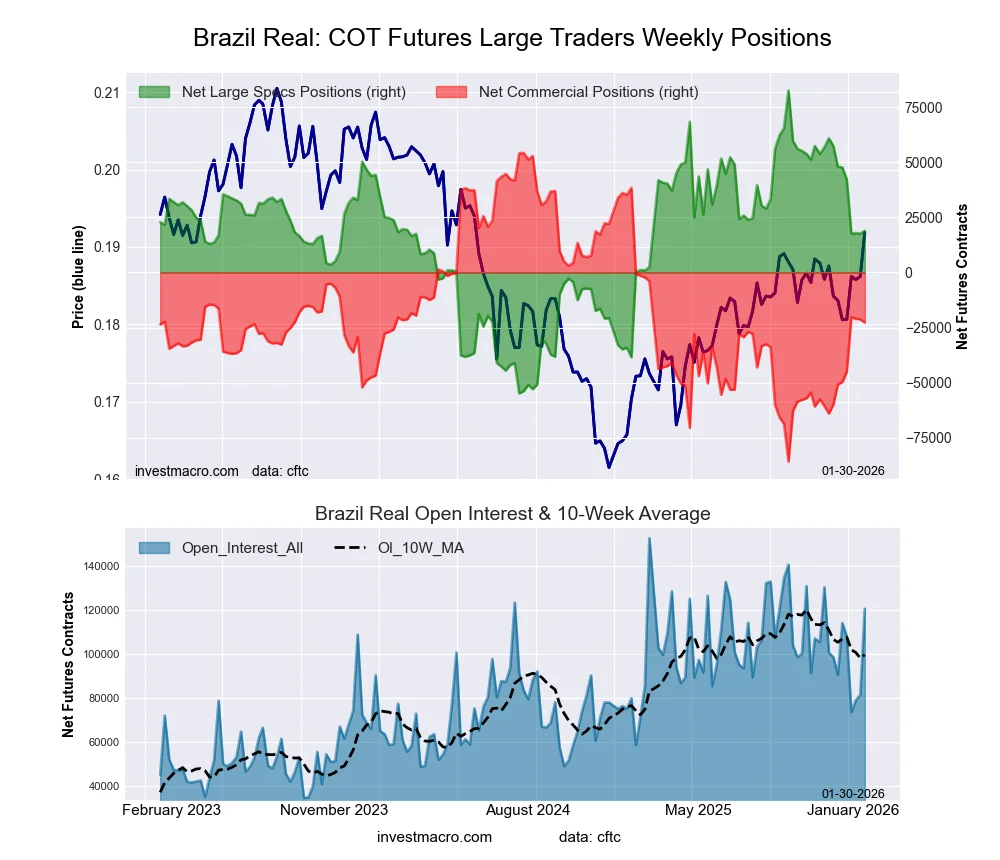 The Brazilian Real large speculator standing this week equaled a net position of 18,845 contracts in the data reported through Tuesday. This was a weekly advance of 1,204 contracts from the previous week which had a total of 17,641 net contracts.
This week’s current strength score (the trader positioning range over the past three years, measured from 0 to 100) shows the speculators are currently Bullish with a score of 53.6 percent. The commercials are Bearish with a score of 45.0 percent and the small traders (not shown in chart) are Bearish with a score of 42.7 percent.
Price Trend-Following Model: Weak Downtrend
Our weekly trend-following model classifies the current market price position as: Weak Downtrend.
| BRAZIL REAL Statistics | SPECULATORS | COMMERCIALS | SMALL TRADERS |
| – Percent of Open Interest Longs: | 46.5 | 41.9 | 4.1 |
| – Percent of Open Interest Shorts: | 30.9 | 60.7 | 0.9 |
| – Net Position: | 18,845 | -22,726 | 3,881 |
| – Gross Longs: | 56,027 | 50,435 | 4,917 |
| – Gross Shorts: | 37,182 | 73,161 | 1,036 |
| – Long to Short Ratio: | 1.5 to 1 | 0.7 to 1 | 4.7 to 1 |
| NET POSITION TREND: | |||
| – Strength Index Score (3 Year Range Pct): | 53.6 | 45.0 | 42.7 |
| – Strength Index Reading (3 Year Range): | Bullish | Bearish | Bearish |
| NET POSITION MOVEMENT INDEX: | |||
| – 6-Week Change in Strength Index: | -21.2 | 20.1 | 5.9 |
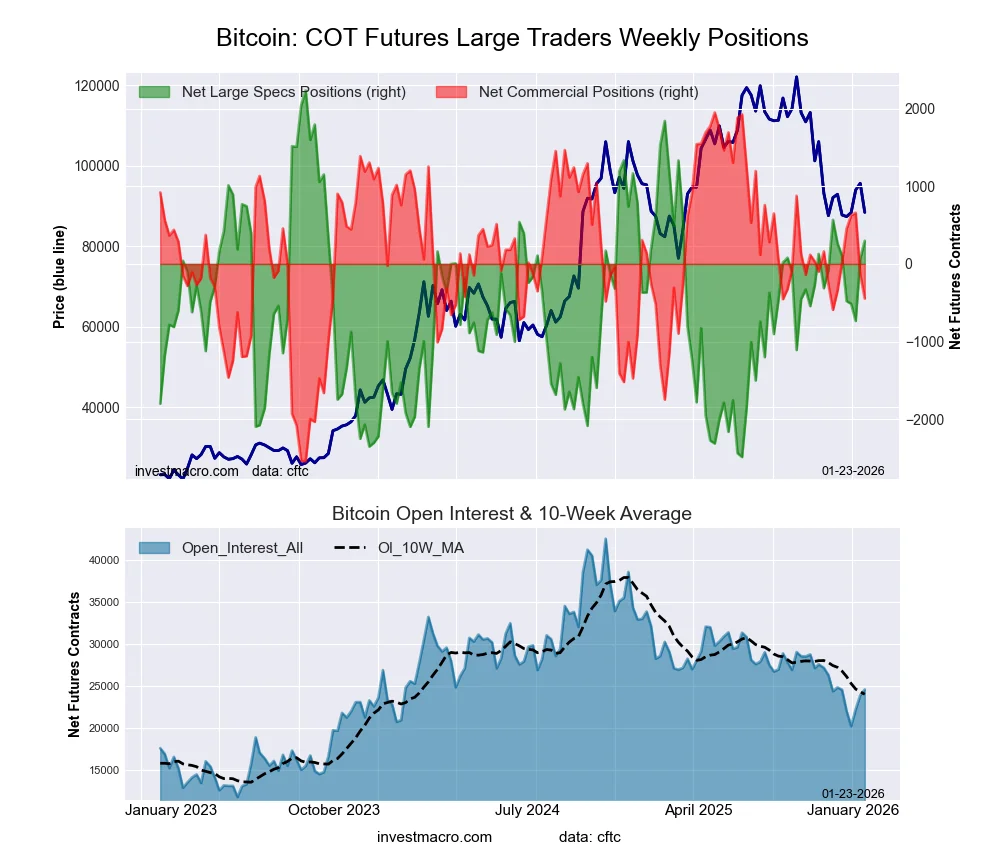
Bitcoin Futures:
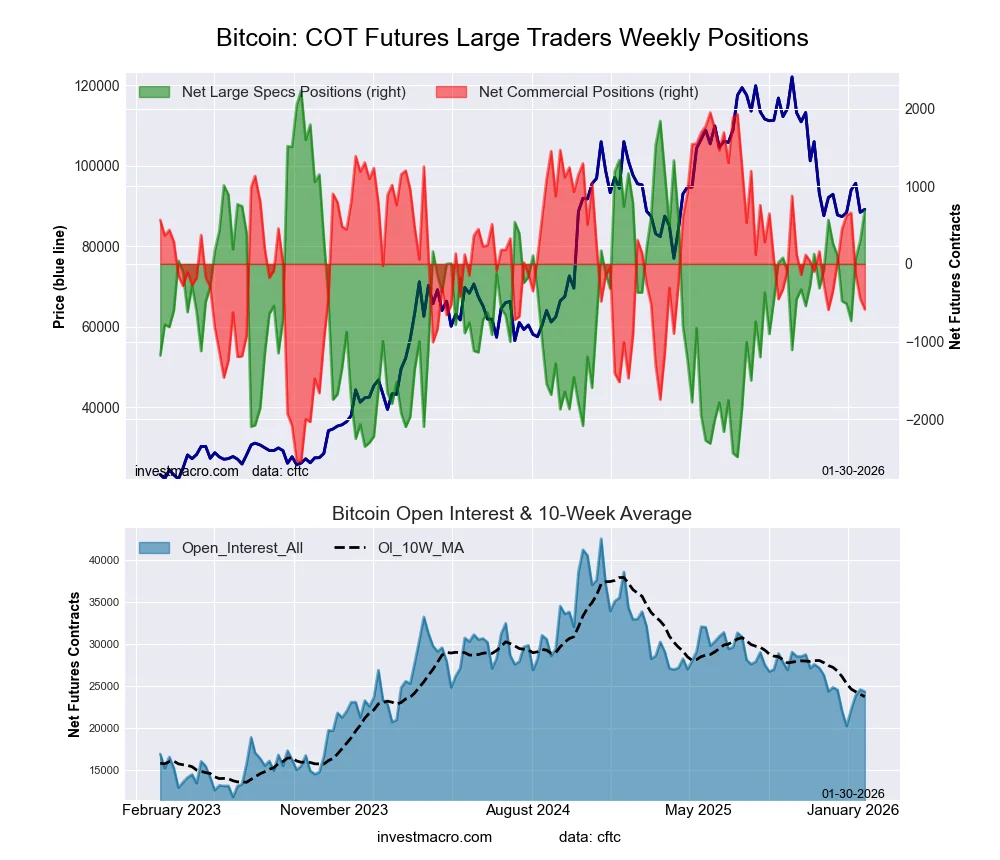 The Bitcoin large speculator standing this week equaled a net position of 690 contracts in the data reported through Tuesday. This was a weekly lift of 392 contracts from the previous week which had a total of 298 net contracts.
This week’s current strength score (the trader positioning range over the past three years, measured from 0 to 100) shows the speculators are currently Bullish with a score of 67.3 percent. The commercials are Bearish with a score of 43.6 percent and the small traders (not shown in chart) are Bearish with a score of 31.9 percent.
Price Trend-Following Model: Downtrend
Our weekly trend-following model classifies the current market price position as: Downtrend.
| BITCOIN Statistics | SPECULATORS | COMMERCIALS | SMALL TRADERS |
| – Percent of Open Interest Longs: | 74.4 | 3.6 | 5.0 |
| – Percent of Open Interest Shorts: | 71.5 | 6.0 | 5.4 |
| – Net Position: | 690 | -585 | -105 |
| – Gross Longs: | 18,054 | 875 | 1,206 |
| – Gross Shorts: | 17,364 | 1,460 | 1,311 |
| – Long to Short Ratio: | 1.0 to 1 | 0.6 to 1 | 0.9 to 1 |
| NET POSITION TREND: | |||
| – Strength Index Score (3 Year Range Pct): | 67.3 | 43.6 | 31.9 |
| – Strength Index Reading (3 Year Range): | Bullish | Bearish | Bearish |
| NET POSITION MOVEMENT INDEX: | |||
| – 6-Week Change in Strength Index: | 12.4 | -13.4 | 1.0 |
Article By InvestMacro – Receive our weekly COT Newsletter
*COT Report: The COT data, released weekly to the public each Friday, is updated through the most recent Tuesday (data is 3 days old) and shows a quick view of how large speculators or non-commercials (for-profit traders) were positioned in the futures markets.
The CFTC categorizes trader positions according to commercial hedgers (traders who use futures contracts for hedging as part of the business), non-commercials (large traders who speculate to realize trading profits) and nonreportable traders (usually small traders/speculators) as well as their open interest (contracts open in the market at time of reporting). See CFTC criteria here.