By InvestMacro
Here are the latest charts and statistics for the Commitment of Traders (COT) data published by the Commodities Futures Trading Commission (CFTC).
The latest COT data is updated through Tuesday January 14th and shows a quick view of how large market participants (for-profit speculators and commercial traders) were positioned in the futures markets. All currency positions are in direct relation to the US dollar where, for example, a bet for the euro is a bet that the euro will rise versus the dollar while a bet against the euro will be a bet that the euro will decline versus the dollar.
Weekly Speculator Changes led by Canadian Dollar & US Dollar Index
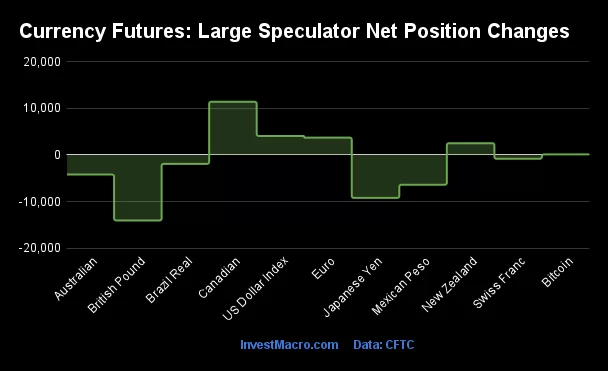
The COT currency market speculator bets were just slightly lower this week as five out of the eleven currency markets we cover had higher positioning while the other six markets had lower speculator contracts.
Leading the gains for the currency markets was the Canadian Dollar (11,436 contracts) with the US Dollar Index (4,084 contracts), the EuroFX (3,727 contracts), the New Zealand Dollar (2,535 contracts) and Bitcoin (145 contracts) also showing positive weeks.
The currencies seeing declines in speculator bets on the week were the British Pound (-14,068 contracts), the Japanese Yen (-9,222 contracts), the Australian Dollar (-4,198 contracts), the Mexican Peso (-6,394 contracts), the Brazilian Real (-1,897 contracts) and the Swiss Franc (-813 contracts) also registering lower bets on the week.
Speculators continue to raise US Dollar Index Bets into 2025
Highlighting the COT currency’s data this week is the increase in the speculator’s positioning for the US Dollar Index that’s carried over from December into the new year. The large speculative US Dollar Index positions rose this week by over 4,000+ contracts and have now gained for five consecutive weeks. This recent rise in speculator sentiment has been carried over each week from December 17th to January 14th for a total +15,953 net contract boost over the 5-week period.
This has pushed the overall bullish speculator position above the +10,000 contract threshold for the first time since September 10th. The Dollar Index bets, previously, had spent a total of seven weeks in October, November and early December in bearish or negative contract territory before finally turning around in mid-December.
The Dollar Index futures price (DX) was slightly lower to close this week but overall the trend has been higher for the DX. Since the last short-term bottom on the weekly charts in September – the DX has advanced by over 9 percent and broken through previous resistance areas from 107.50 to 109.00. Currently, the Dollar Index price is sitting right around the 109.40 level with the weekly RSI signaling a slightly overbought level of 70.10.
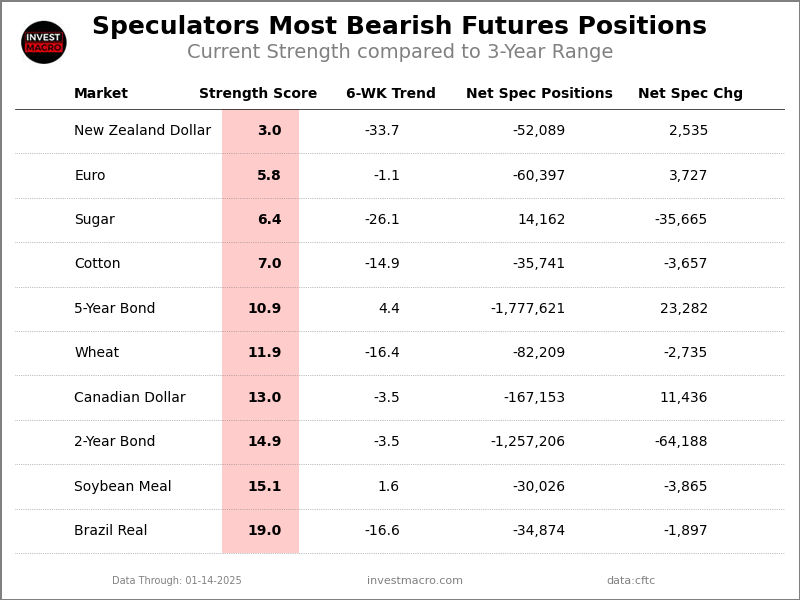
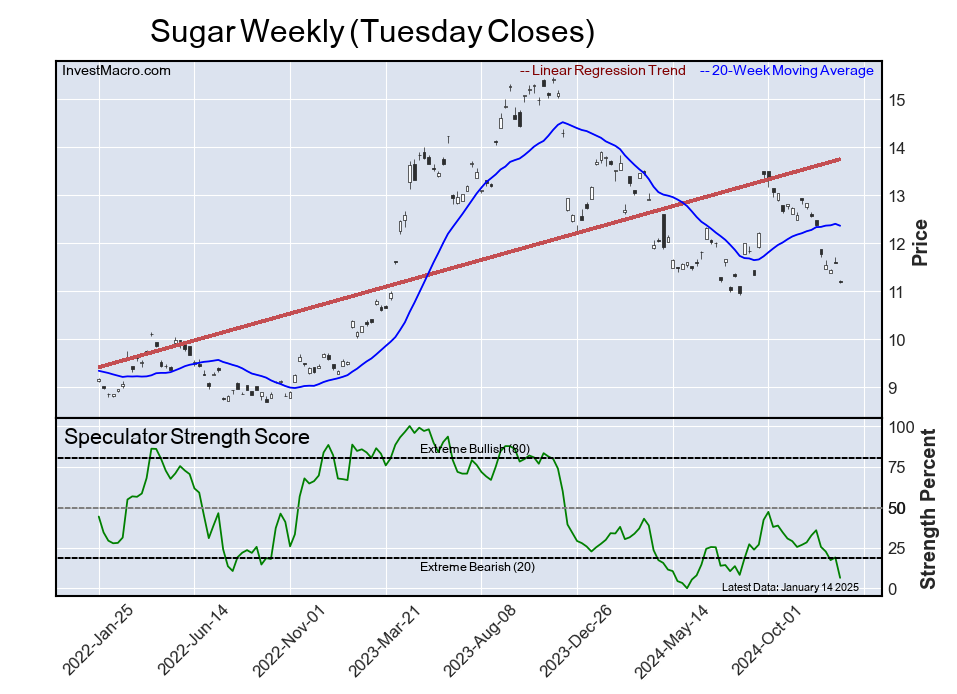
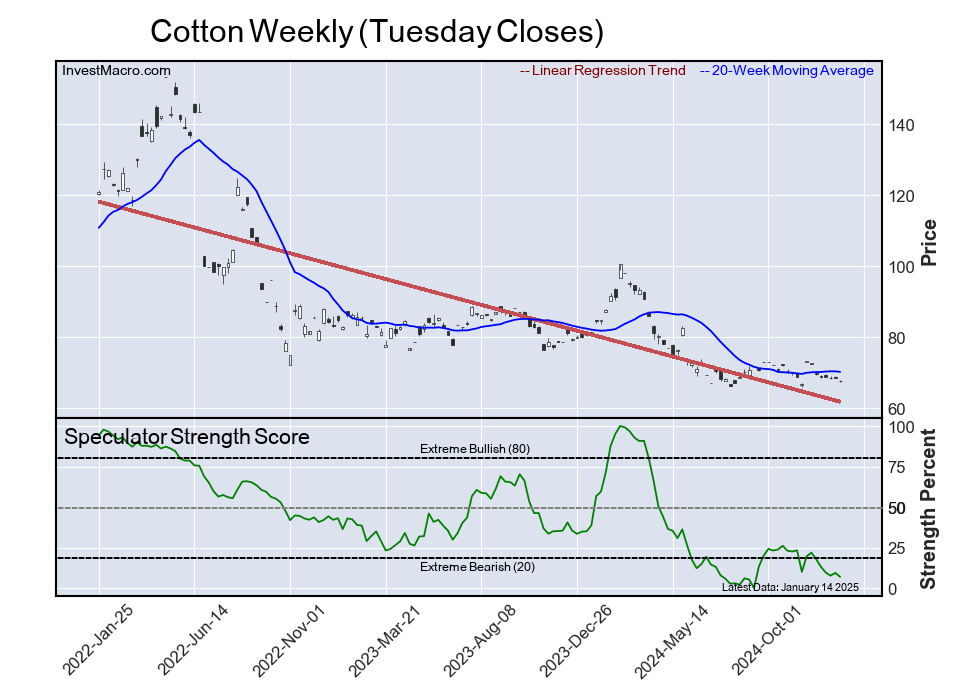
Currencies Net Speculators Leaderboard
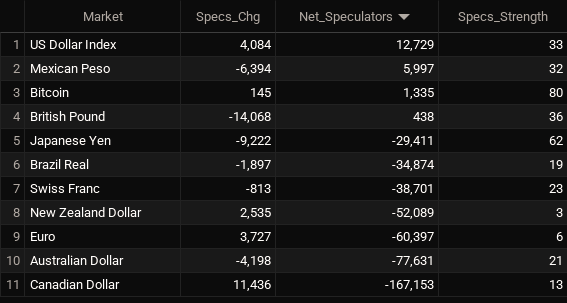
Legend: Weekly Speculators Change | Speculators Current Net Position | Speculators Strength Score compared to last 3-Years (0-100 range)
Strength Scores led by Bitcoin & Japanese Yen
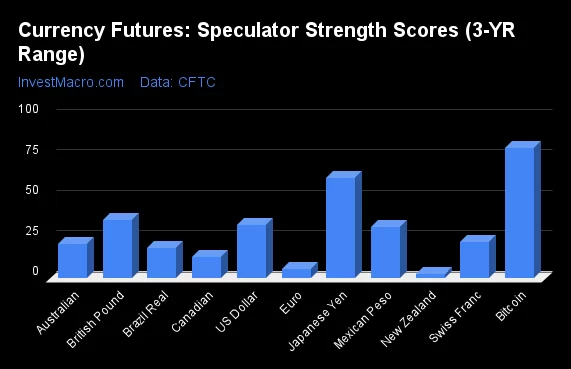
COT Strength Scores (a normalized measure of Speculator positions over a 3-Year range, from 0 to 100 where above 80 is Extreme-Bullish and below 20 is Extreme-Bearish) showed that the Bitcoin (80 percent) and the Japanese Yen (62 percent) lead the currency markets this week.
On the downside, the New Zealand Dollar (3 percent), the EuroFX (6 percent), the Canadian Dollar (13 percent) and the Brazilian Real (19 percent) come in at the lowest strength levels currently and are in Extreme-Bearish territory (below 20 percent).
3-Year Strength Statistics:
US Dollar Index (33.1 percent) vs US Dollar Index previous week (24.6 percent)
EuroFX (5.8 percent) vs EuroFX previous week (4.4 percent)
British Pound Sterling (36.3 percent) vs British Pound Sterling previous week (42.6 percent)
Japanese Yen (61.9 percent) vs Japanese Yen previous week (65.6 percent)
Swiss Franc (22.5 percent) vs Swiss Franc previous week (24.1 percent)
Canadian Dollar (13.0 percent) vs Canadian Dollar previous week (7.9 percent)
Australian Dollar (21.2 percent) vs Australian Dollar previous week (24.2 percent)
New Zealand Dollar (3.0 percent) vs New Zealand Dollar previous week (0.0 percent)
Mexican Peso (31.8 percent) vs Mexican Peso previous week (35.1 percent)
Brazilian Real (19.0 percent) vs Brazilian Real previous week (20.8 percent)
Bitcoin (80.4 percent) vs Bitcoin previous week (77.3 percent)
Bitcoin & US Dollar Index top the 6-Week Strength Trends
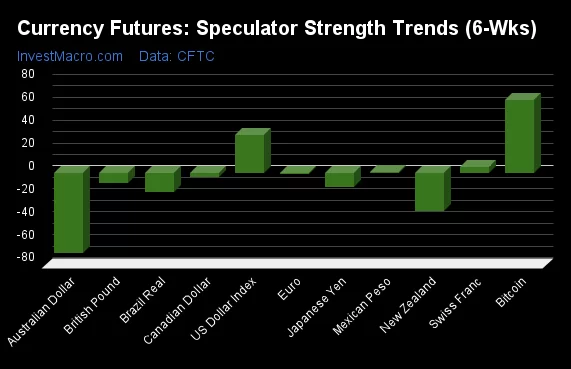
COT Strength Score Trends (or move index, calculates the 6-week changes in strength scores) showed that the Bitcoin (64 percent) and the US Dollar Index (33 percent) lead the past six weeks trends for the currencies.
The Australian Dollar (-70 percent) leads the downside trend scores currently with the New Zealand Dollar (-34 percent), Brazilian Real (-17 percent) and the Japanese Yen (-13 percent) following next with lower trend scores.
3-Year Strength Trends:
US Dollar Index (32.7 percent) vs US Dollar Index previous week (23.7 percent)
EuroFX (-1.1 percent) vs EuroFX previous week (-3.1 percent)
British Pound Sterling (-8.5 percent) vs British Pound Sterling previous week (-3.2 percent)
Japanese Yen (-12.7 percent) vs Japanese Yen previous week (1.0 percent)
Swiss Franc (4.8 percent) vs Swiss Franc previous week (3.6 percent)
Canadian Dollar (-3.5 percent) vs Canadian Dollar previous week (-11.0 percent)
Australian Dollar (-70.3 percent) vs Australian Dollar previous week (-74.6 percent)
New Zealand Dollar (-33.7 percent) vs New Zealand Dollar previous week (-35.4 percent)
Mexican Peso (0.9 percent) vs Mexican Peso previous week (4.6 percent)
Brazilian Real (-16.6 percent) vs Brazilian Real previous week (-24.1 percent)
Bitcoin (63.9 percent) vs Bitcoin previous week (52.1 percent)
Individual COT Forex Markets:
US Dollar Index Futures:
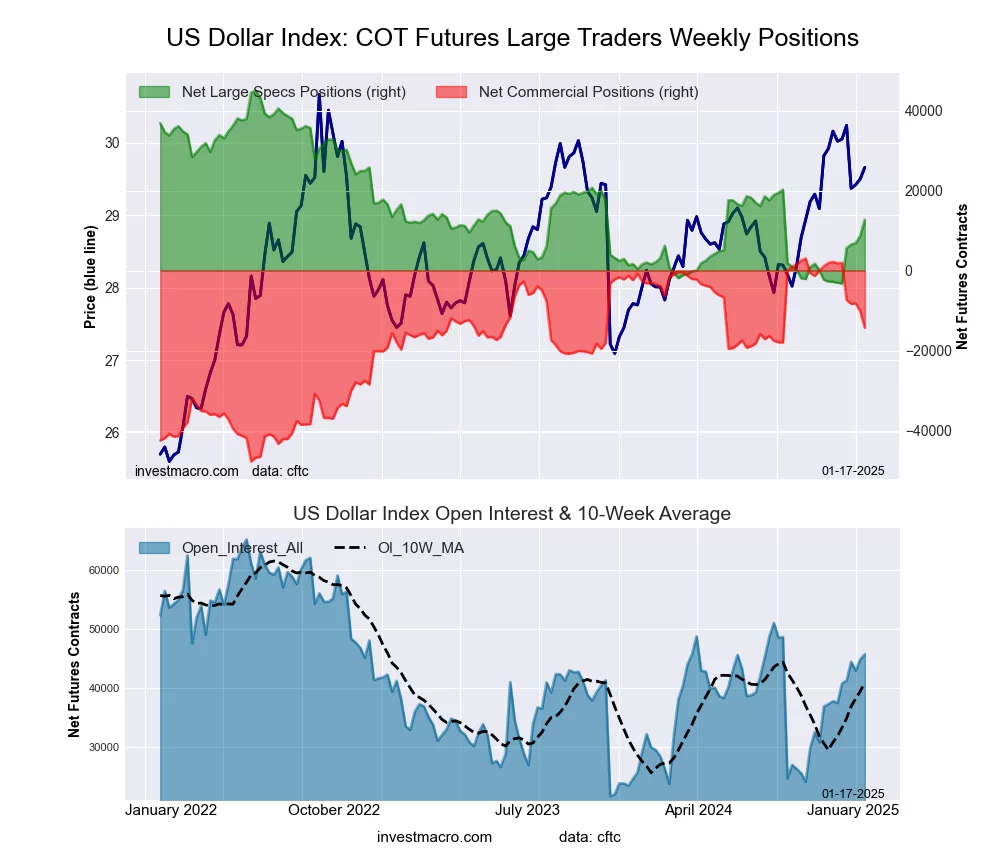 The US Dollar Index large speculator standing this week resulted in a net position of 12,729 contracts in the data reported through Tuesday. This was a weekly lift of 4,084 contracts from the previous week which had a total of 8,645 net contracts.
This week’s current strength score (the trader positioning range over the past three years, measured from 0 to 100) shows the speculators are currently Bearish with a score of 33.1 percent. The commercials are Bullish with a score of 65.9 percent and the small traders (not shown in chart) are Bearish with a score of 39.7 percent.
Price Trend-Following Model: Uptrend
Our weekly trend-following model classifies the current market price position as: Uptrend.
| US DOLLAR INDEX Statistics | SPECULATORS | COMMERCIALS | SMALL TRADERS |
| – Percent of Open Interest Longs: | 64.5 | 24.0 | 8.8 |
| – Percent of Open Interest Shorts: | 36.7 | 55.2 | 5.4 |
| – Net Position: | 12,729 | -14,288 | 1,559 |
| – Gross Longs: | 29,512 | 10,978 | 4,033 |
| – Gross Shorts: | 16,783 | 25,266 | 2,474 |
| – Long to Short Ratio: | 1.8 to 1 | 0.4 to 1 | 1.6 to 1 |
| NET POSITION TREND: | | | |
| – Strength Index Score (3 Year Range Pct): | 33.1 | 65.9 | 39.7 |
| – Strength Index Reading (3 Year Range): | Bearish | Bullish | Bearish |
| NET POSITION MOVEMENT INDEX: | | | |
| – 6-Week Change in Strength Index: | 32.7 | -31.7 | 3.2 |
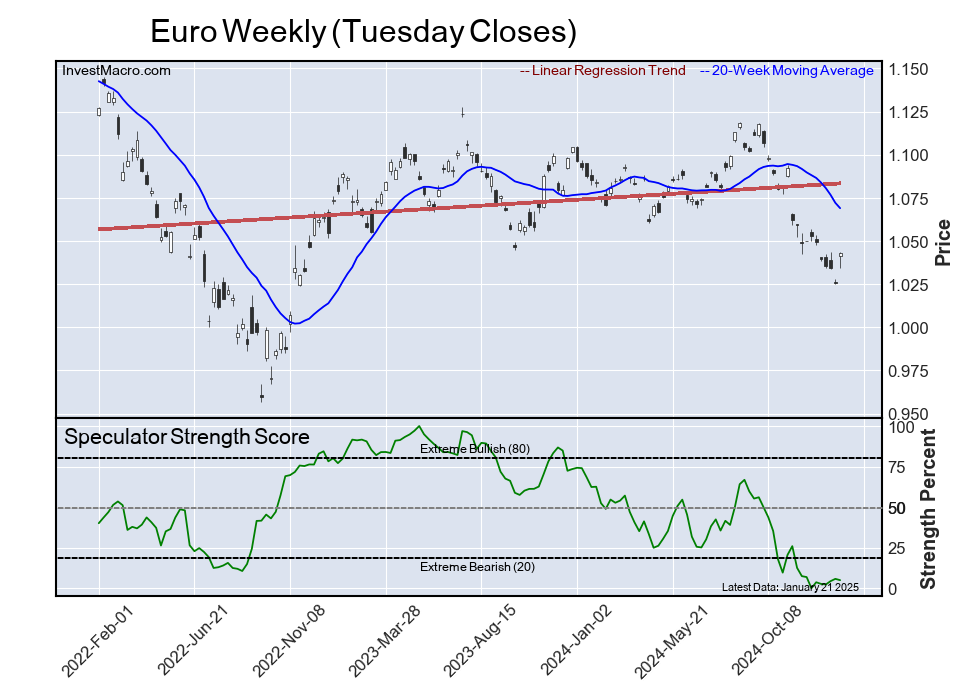
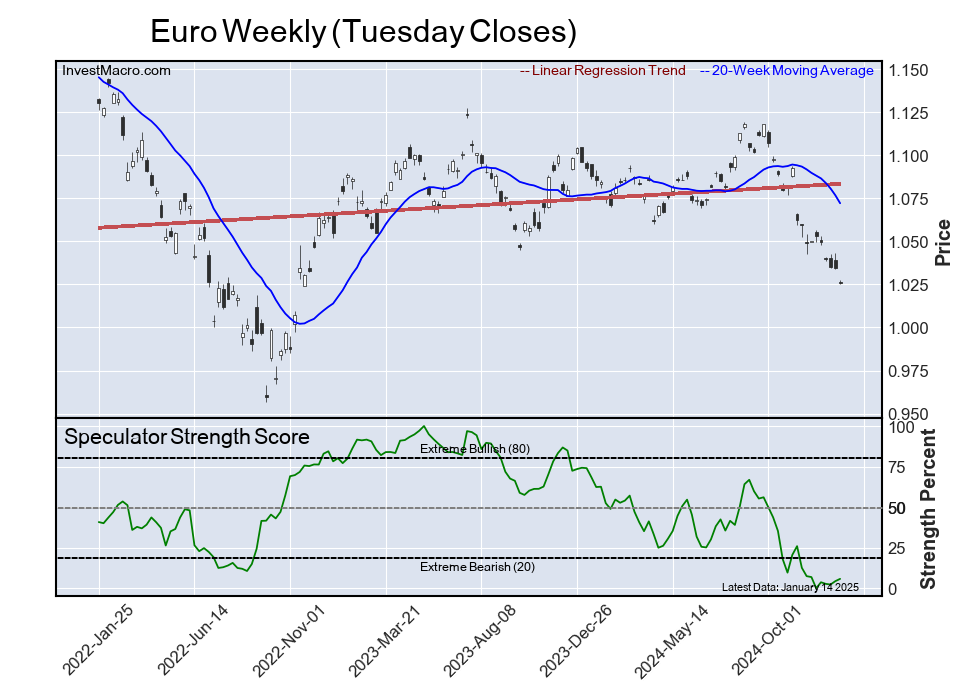
Euro Currency Futures:
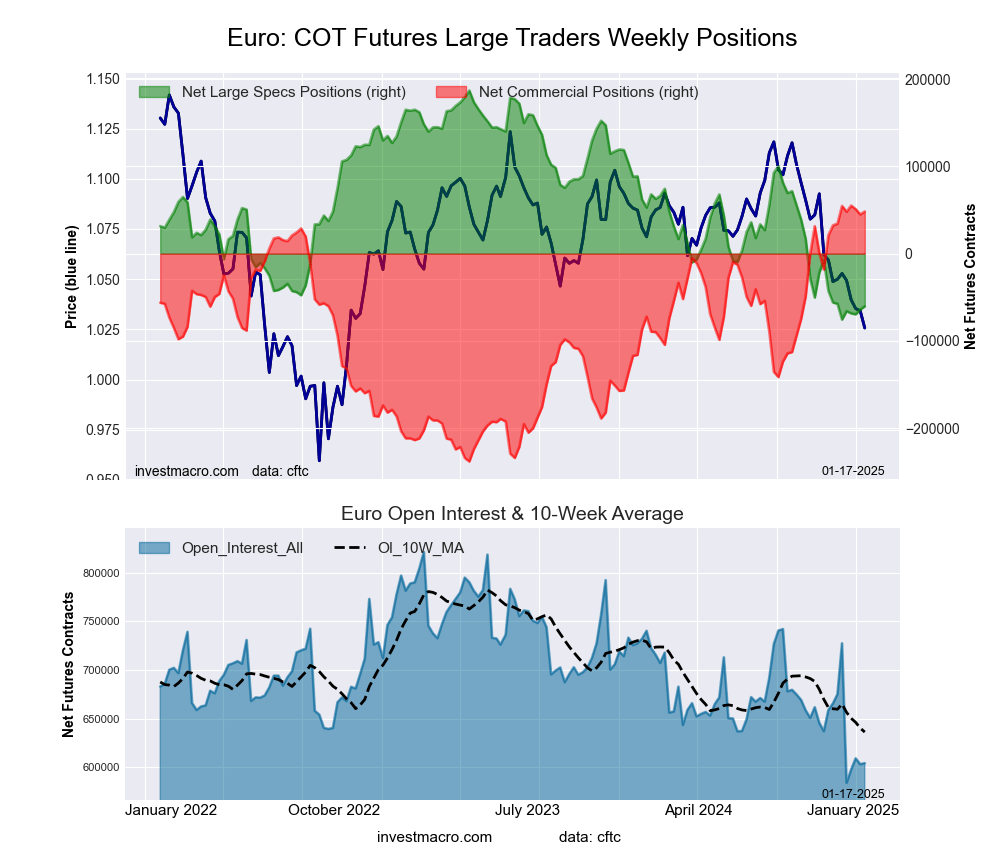 The Euro Currency large speculator standing this week resulted in a net position of -60,397 contracts in the data reported through Tuesday. This was a weekly advance of 3,727 contracts from the previous week which had a total of -64,124 net contracts.
This week’s current strength score (the trader positioning range over the past three years, measured from 0 to 100) shows the speculators are currently Bearish-Extreme with a score of 5.8 percent. The commercials are Bullish-Extreme with a score of 97.7 percent and the small traders (not shown in chart) are Bearish-Extreme with a score of 0.0 percent.
Price Trend-Following Model: Downtrend
Our weekly trend-following model classifies the current market price position as: Downtrend.
| EURO Currency Statistics | SPECULATORS | COMMERCIALS | SMALL TRADERS |
| – Percent of Open Interest Longs: | 26.9 | 56.4 | 12.0 |
| – Percent of Open Interest Shorts: | 36.9 | 48.4 | 10.0 |
| – Net Position: | -60,397 | 48,337 | 12,060 |
| – Gross Longs: | 162,760 | 341,025 | 72,682 |
| – Gross Shorts: | 223,157 | 292,688 | 60,622 |
| – Long to Short Ratio: | 0.7 to 1 | 1.2 to 1 | 1.2 to 1 |
| NET POSITION TREND: | | | |
| – Strength Index Score (3 Year Range Pct): | 5.8 | 97.7 | 0.0 |
| – Strength Index Reading (3 Year Range): | Bearish-Extreme | Bullish-Extreme | Bearish-Extreme |
| NET POSITION MOVEMENT INDEX: | | | |
| – 6-Week Change in Strength Index: | -1.1 | 4.7 | -24.4 |
British Pound Sterling Futures:
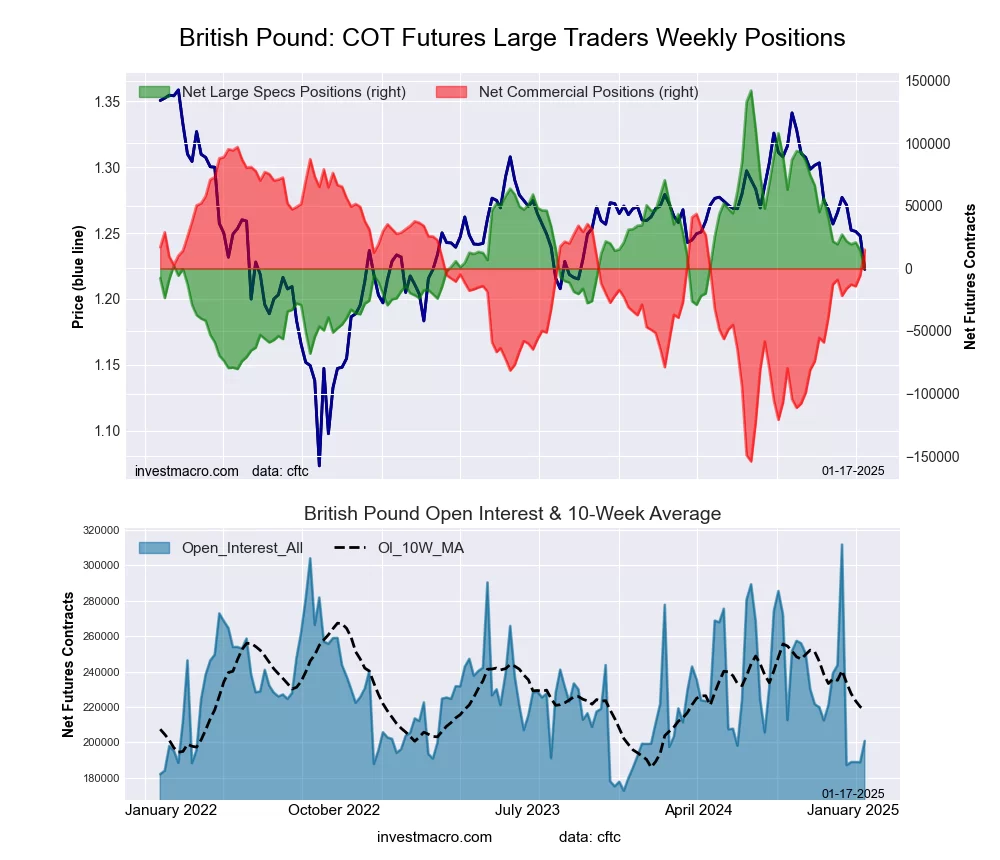 The British Pound Sterling large speculator standing this week resulted in a net position of 438 contracts in the data reported through Tuesday. This was a weekly reduction of -14,068 contracts from the previous week which had a total of 14,506 net contracts.
This week’s current strength score (the trader positioning range over the past three years, measured from 0 to 100) shows the speculators are currently Bearish with a score of 36.3 percent. The commercials are Bullish with a score of 67.3 percent and the small traders (not shown in chart) are Bearish with a score of 29.8 percent.
Price Trend-Following Model: Strong Downtrend
Our weekly trend-following model classifies the current market price position as: Strong Downtrend.
| BRITISH POUND Statistics | SPECULATORS | COMMERCIALS | SMALL TRADERS |
| – Percent of Open Interest Longs: | 40.1 | 47.0 | 10.9 |
| – Percent of Open Interest Shorts: | 39.9 | 39.5 | 18.5 |
| – Net Position: | 438 | 14,985 | -15,423 |
| – Gross Longs: | 80,557 | 94,313 | 21,817 |
| – Gross Shorts: | 80,119 | 79,328 | 37,240 |
| – Long to Short Ratio: | 1.0 to 1 | 1.2 to 1 | 0.6 to 1 |
| NET POSITION TREND: | | | |
| – Strength Index Score (3 Year Range Pct): | 36.3 | 67.3 | 29.8 |
| – Strength Index Reading (3 Year Range): | Bearish | Bullish | Bearish |
| NET POSITION MOVEMENT INDEX: | | | |
| – 6-Week Change in Strength Index: | -8.5 | 9.5 | -10.7 |
Japanese Yen Futures:
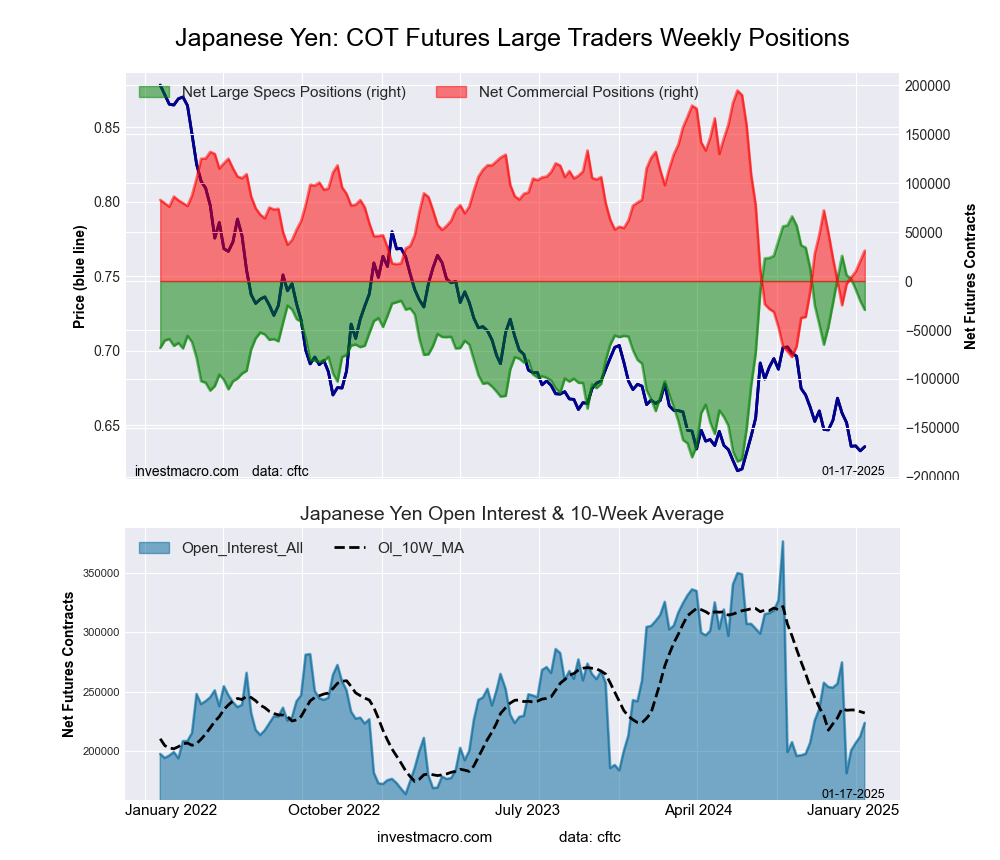 The Japanese Yen large speculator standing this week resulted in a net position of -29,411 contracts in the data reported through Tuesday. This was a weekly decrease of -9,222 contracts from the previous week which had a total of -20,189 net contracts.
This week’s current strength score (the trader positioning range over the past three years, measured from 0 to 100) shows the speculators are currently Bullish with a score of 61.9 percent. The commercials are Bearish with a score of 39.9 percent and the small traders (not shown in chart) are Bullish with a score of 59.8 percent.
Price Trend-Following Model: Downtrend
Our weekly trend-following model classifies the current market price position as: Downtrend.
| JAPANESE YEN Statistics | SPECULATORS | COMMERCIALS | SMALL TRADERS |
| – Percent of Open Interest Longs: | 40.8 | 39.3 | 18.0 |
| – Percent of Open Interest Shorts: | 54.0 | 25.5 | 18.7 |
| – Net Position: | -29,411 | 31,023 | -1,612 |
| – Gross Longs: | 91,434 | 88,113 | 40,268 |
| – Gross Shorts: | 120,845 | 57,090 | 41,880 |
| – Long to Short Ratio: | 0.8 to 1 | 1.5 to 1 | 1.0 to 1 |
| NET POSITION TREND: | | | |
| – Strength Index Score (3 Year Range Pct): | 61.9 | 39.9 | 59.8 |
| – Strength Index Reading (3 Year Range): | Bullish | Bearish | Bullish |
| NET POSITION MOVEMENT INDEX: | | | |
| – 6-Week Change in Strength Index: | -12.7 | 11.5 | 1.4 |
Swiss Franc Futures:
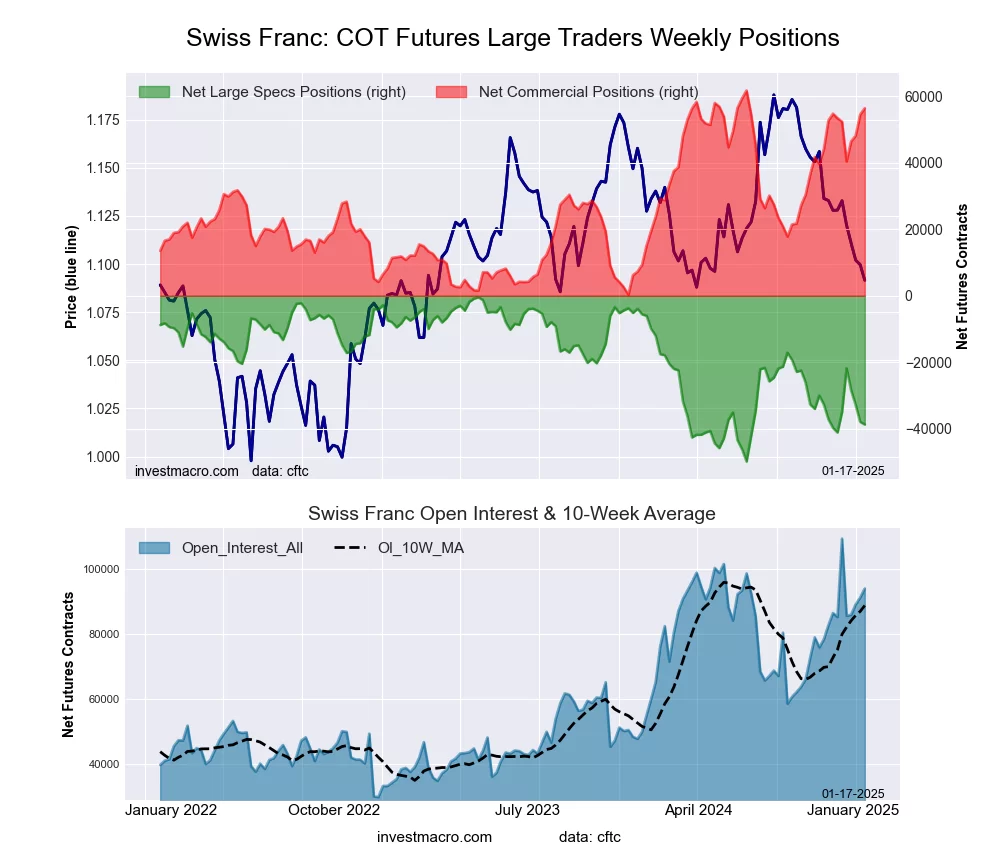 The Swiss Franc large speculator standing this week resulted in a net position of -38,701 contracts in the data reported through Tuesday. This was a weekly decline of -813 contracts from the previous week which had a total of -37,888 net contracts.
This week’s current strength score (the trader positioning range over the past three years, measured from 0 to 100) shows the speculators are currently Bearish with a score of 22.5 percent. The commercials are Bullish-Extreme with a score of 91.3 percent and the small traders (not shown in chart) are Bearish-Extreme with a score of 4.0 percent.
Price Trend-Following Model: Strong Downtrend
Our weekly trend-following model classifies the current market price position as: Strong Downtrend.
| SWISS FRANC Statistics | SPECULATORS | COMMERCIALS | SMALL TRADERS |
| – Percent of Open Interest Longs: | 8.0 | 83.7 | 7.8 |
| – Percent of Open Interest Shorts: | 49.2 | 23.8 | 26.5 |
| – Net Position: | -38,701 | 56,343 | -17,642 |
| – Gross Longs: | 7,557 | 78,690 | 7,316 |
| – Gross Shorts: | 46,258 | 22,347 | 24,958 |
| – Long to Short Ratio: | 0.2 to 1 | 3.5 to 1 | 0.3 to 1 |
| NET POSITION TREND: | | | |
| – Strength Index Score (3 Year Range Pct): | 22.5 | 91.3 | 4.0 |
| – Strength Index Reading (3 Year Range): | Bearish | Bullish-Extreme | Bearish-Extreme |
| NET POSITION MOVEMENT INDEX: | | | |
| – 6-Week Change in Strength Index: | 4.8 | 4.9 | -22.8 |
Canadian Dollar Futures:
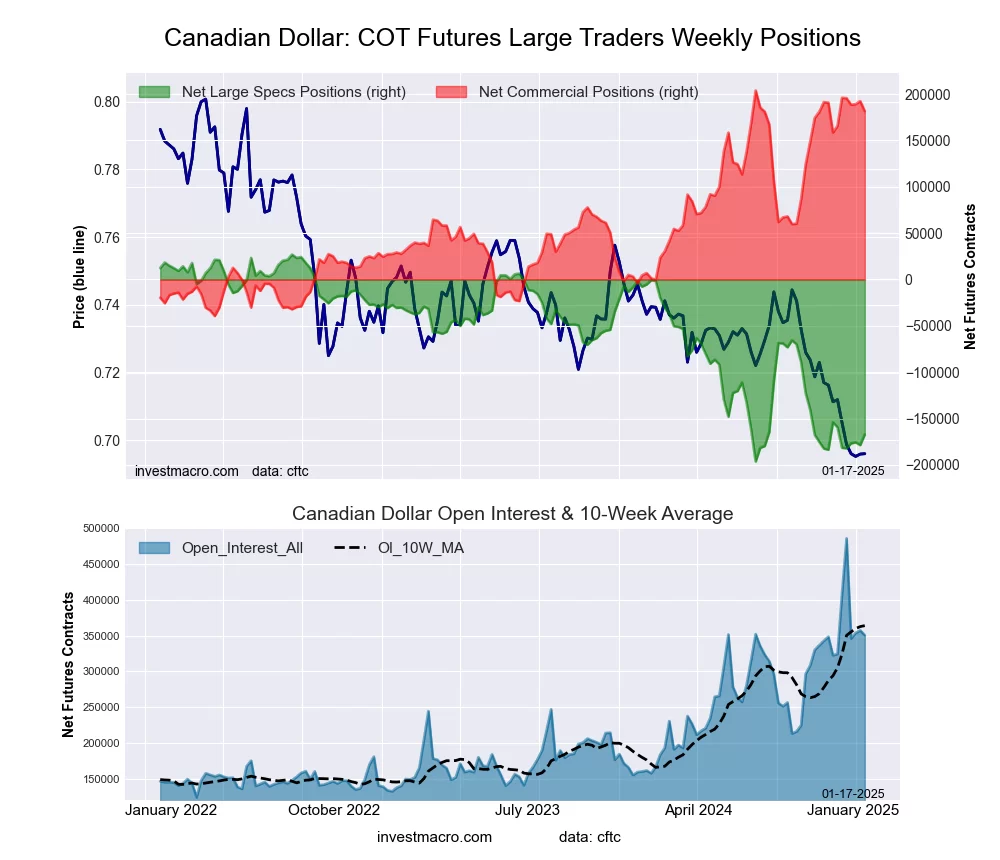 The Canadian Dollar large speculator standing this week resulted in a net position of -167,153 contracts in the data reported through Tuesday. This was a weekly lift of 11,436 contracts from the previous week which had a total of -178,589 net contracts.
This week’s current strength score (the trader positioning range over the past three years, measured from 0 to 100) shows the speculators are currently Bearish-Extreme with a score of 13.0 percent. The commercials are Bullish-Extreme with a score of 90.8 percent and the small traders (not shown in chart) are Bearish-Extreme with a score of 0.1 percent.
Price Trend-Following Model: Downtrend
Our weekly trend-following model classifies the current market price position as: Downtrend.
| CANADIAN DOLLAR Statistics | SPECULATORS | COMMERCIALS | SMALL TRADERS |
| – Percent of Open Interest Longs: | 6.6 | 83.6 | 7.9 |
| – Percent of Open Interest Shorts: | 54.3 | 31.8 | 11.9 |
| – Net Position: | -167,153 | 181,481 | -14,328 |
| – Gross Longs: | 23,031 | 292,957 | 27,533 |
| – Gross Shorts: | 190,184 | 111,476 | 41,861 |
| – Long to Short Ratio: | 0.1 to 1 | 2.6 to 1 | 0.7 to 1 |
| NET POSITION TREND: | | | |
| – Strength Index Score (3 Year Range Pct): | 13.0 | 90.8 | 0.1 |
| – Strength Index Reading (3 Year Range): | Bearish-Extreme | Bullish-Extreme | Bearish-Extreme |
| NET POSITION MOVEMENT INDEX: | | | |
| – 6-Week Change in Strength Index: | -3.5 | 6.6 | -21.6 |
Australian Dollar Futures:
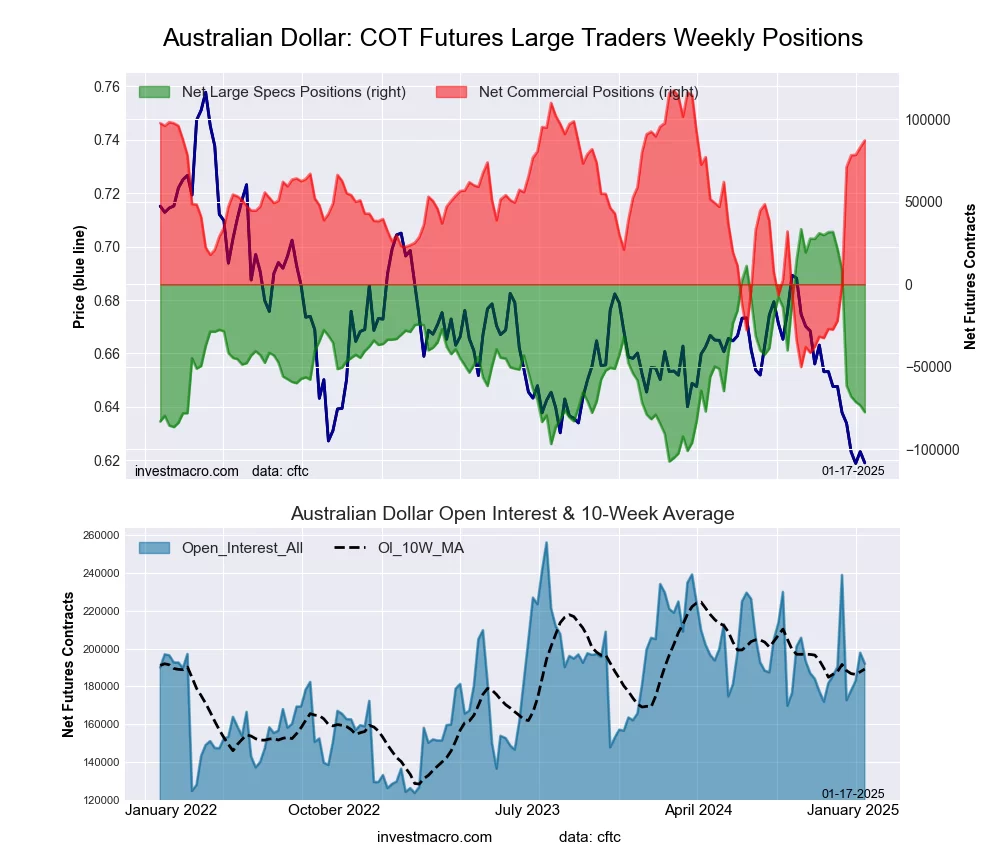 The Australian Dollar large speculator standing this week resulted in a net position of -77,631 contracts in the data reported through Tuesday. This was a weekly decline of -4,198 contracts from the previous week which had a total of -73,433 net contracts.
This week’s current strength score (the trader positioning range over the past three years, measured from 0 to 100) shows the speculators are currently Bearish with a score of 21.2 percent. The commercials are Bullish-Extreme with a score of 82.0 percent and the small traders (not shown in chart) are Bearish with a score of 23.6 percent.
Price Trend-Following Model: Downtrend
Our weekly trend-following model classifies the current market price position as: Downtrend.
| AUSTRALIAN DOLLAR Statistics | SPECULATORS | COMMERCIALS | SMALL TRADERS |
| – Percent of Open Interest Longs: | 13.6 | 69.9 | 12.1 |
| – Percent of Open Interest Shorts: | 54.0 | 24.4 | 17.2 |
| – Net Position: | -77,631 | 87,297 | -9,666 |
| – Gross Longs: | 26,135 | 134,239 | 23,314 |
| – Gross Shorts: | 103,766 | 46,942 | 32,980 |
| – Long to Short Ratio: | 0.3 to 1 | 2.9 to 1 | 0.7 to 1 |
| NET POSITION TREND: | | | |
| – Strength Index Score (3 Year Range Pct): | 21.2 | 82.0 | 23.6 |
| – Strength Index Reading (3 Year Range): | Bearish | Bullish-Extreme | Bearish |
| NET POSITION MOVEMENT INDEX: | | | |
| – 6-Week Change in Strength Index: | -70.3 | 65.3 | -27.8 |
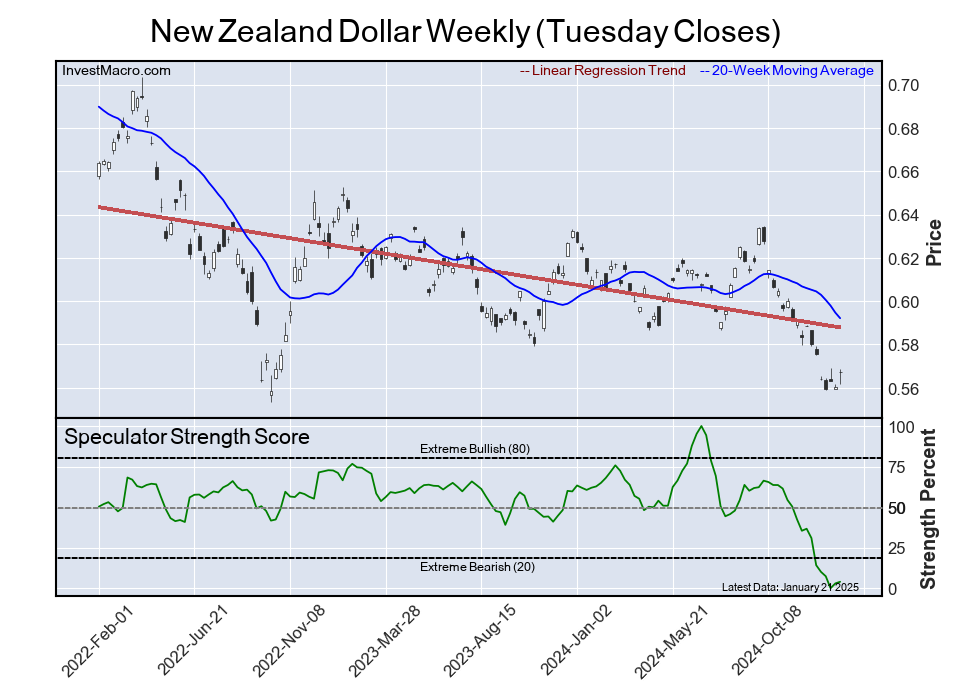
New Zealand Dollar Futures:
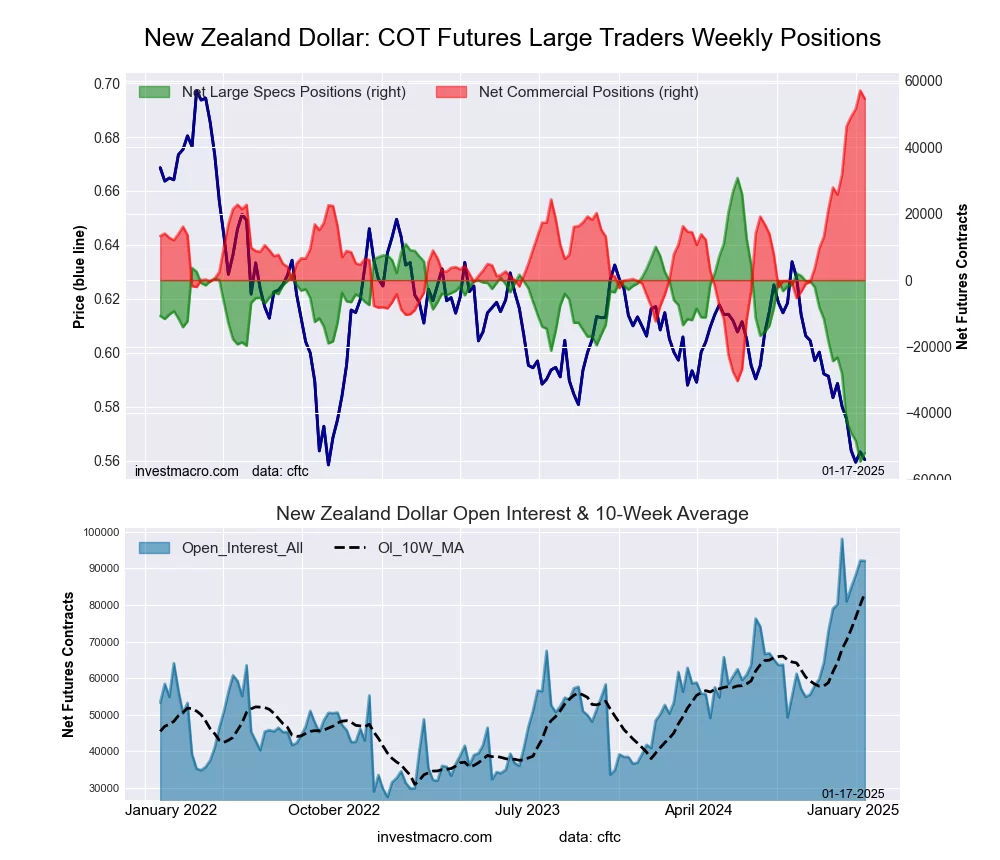 The New Zealand Dollar large speculator standing this week resulted in a net position of -52,089 contracts in the data reported through Tuesday. This was a weekly advance of 2,535 contracts from the previous week which had a total of -54,624 net contracts.
This week’s current strength score (the trader positioning range over the past three years, measured from 0 to 100) shows the speculators are currently Bearish-Extreme with a score of 3.0 percent. The commercials are Bullish-Extreme with a score of 97.2 percent and the small traders (not shown in chart) are Bearish with a score of 20.9 percent.
Price Trend-Following Model: Downtrend
Our weekly trend-following model classifies the current market price position as: Downtrend.
| NEW ZEALAND DOLLAR Statistics | SPECULATORS | COMMERCIALS | SMALL TRADERS |
| – Percent of Open Interest Longs: | 11.9 | 83.8 | 3.9 |
| – Percent of Open Interest Shorts: | 68.4 | 24.4 | 6.7 |
| – Net Position: | -52,089 | 54,644 | -2,555 |
| – Gross Longs: | 10,921 | 77,144 | 3,632 |
| – Gross Shorts: | 63,010 | 22,500 | 6,187 |
| – Long to Short Ratio: | 0.2 to 1 | 3.4 to 1 | 0.6 to 1 |
| NET POSITION TREND: | | | |
| – Strength Index Score (3 Year Range Pct): | 3.0 | 97.2 | 20.9 |
| – Strength Index Reading (3 Year Range): | Bearish-Extreme | Bullish-Extreme | Bearish |
| NET POSITION MOVEMENT INDEX: | | | |
| – 6-Week Change in Strength Index: | -33.7 | 33.1 | -1.7 |
Mexican Peso Futures:
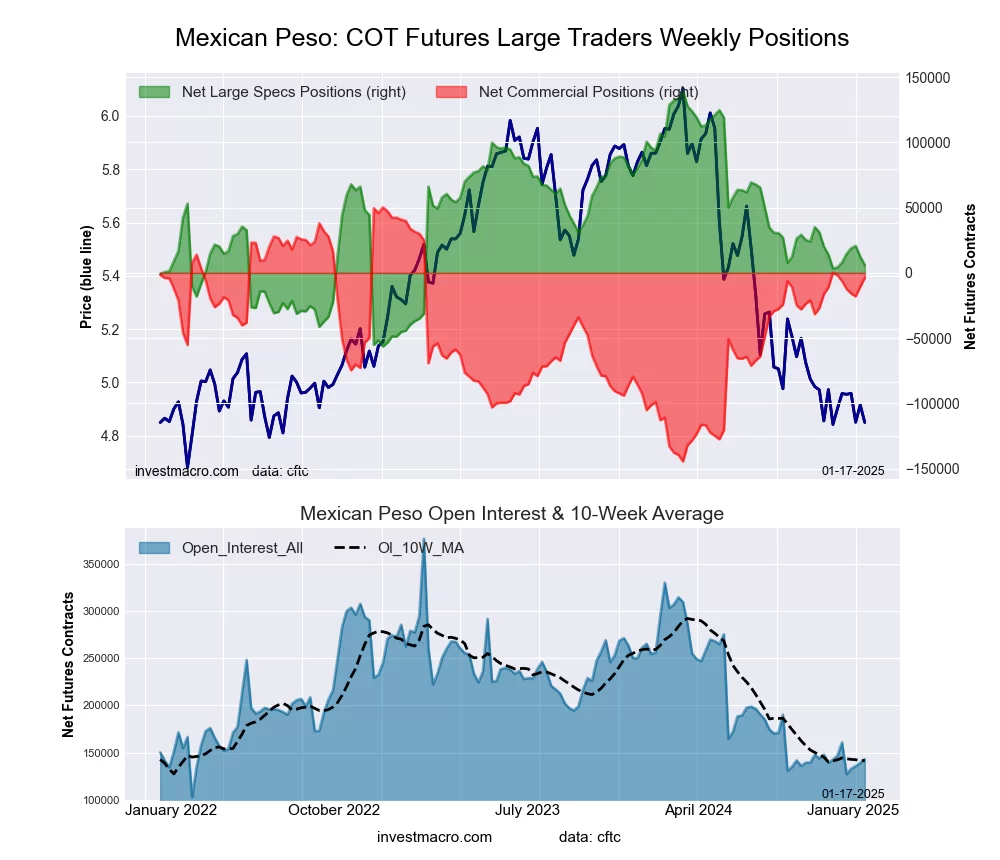 The Mexican Peso large speculator standing this week resulted in a net position of 5,997 contracts in the data reported through Tuesday. This was a weekly reduction of -6,394 contracts from the previous week which had a total of 12,391 net contracts.
This week’s current strength score (the trader positioning range over the past three years, measured from 0 to 100) shows the speculators are currently Bearish with a score of 31.8 percent. The commercials are Bullish with a score of 72.3 percent and the small traders (not shown in chart) are Bearish-Extreme with a score of 10.3 percent.
Price Trend-Following Model: Strong Downtrend
Our weekly trend-following model classifies the current market price position as: Strong Downtrend.
| MEXICAN PESO Statistics | SPECULATORS | COMMERCIALS | SMALL TRADERS |
| – Percent of Open Interest Longs: | 40.0 | 54.5 | 2.7 |
| – Percent of Open Interest Shorts: | 35.8 | 57.1 | 4.2 |
| – Net Position: | 5,997 | -3,765 | -2,232 |
| – Gross Longs: | 57,188 | 77,842 | 3,823 |
| – Gross Shorts: | 51,191 | 81,607 | 6,055 |
| – Long to Short Ratio: | 1.1 to 1 | 1.0 to 1 | 0.6 to 1 |
| NET POSITION TREND: | | | |
| – Strength Index Score (3 Year Range Pct): | 31.8 | 72.3 | 10.3 |
| – Strength Index Reading (3 Year Range): | Bearish | Bullish | Bearish-Extreme |
| NET POSITION MOVEMENT INDEX: | | | |
| – 6-Week Change in Strength Index: | 0.9 | -1.0 | 0.6 |
Brazilian Real Futures:
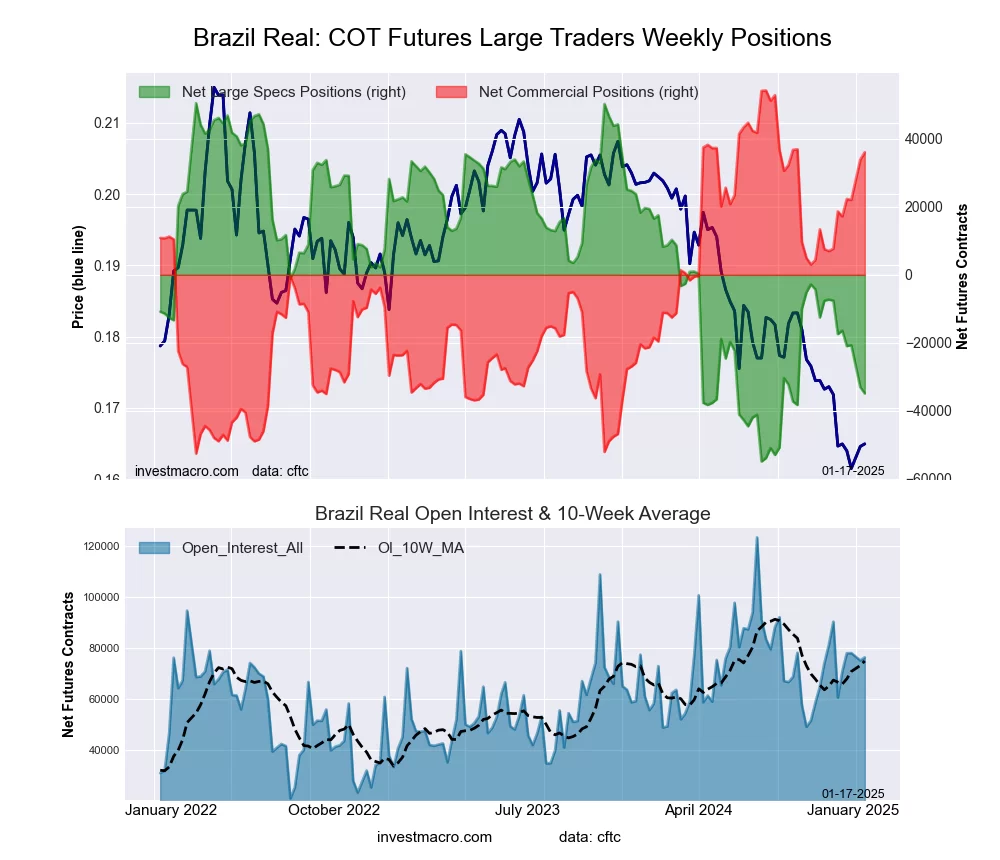 The Brazilian Real large speculator standing this week resulted in a net position of -34,874 contracts in the data reported through Tuesday. This was a weekly reduction of -1,897 contracts from the previous week which had a total of -32,977 net contracts.
This week’s current strength score (the trader positioning range over the past three years, measured from 0 to 100) shows the speculators are currently Bearish-Extreme with a score of 19.0 percent. The commercials are Bullish-Extreme with a score of 83.0 percent and the small traders (not shown in chart) are Bearish-Extreme with a score of 14.1 percent.
Price Trend-Following Model: Downtrend
Our weekly trend-following model classifies the current market price position as: Downtrend.
| BRAZIL REAL Statistics | SPECULATORS | COMMERCIALS | SMALL TRADERS |
| – Percent of Open Interest Longs: | 26.1 | 68.0 | 2.8 |
| – Percent of Open Interest Shorts: | 71.8 | 20.7 | 4.3 |
| – Net Position: | -34,874 | 36,067 | -1,193 |
| – Gross Longs: | 19,951 | 51,899 | 2,111 |
| – Gross Shorts: | 54,825 | 15,832 | 3,304 |
| – Long to Short Ratio: | 0.4 to 1 | 3.3 to 1 | 0.6 to 1 |
| NET POSITION TREND: | | | |
| – Strength Index Score (3 Year Range Pct): | 19.0 | 83.0 | 14.1 |
| – Strength Index Reading (3 Year Range): | Bearish-Extreme | Bullish-Extreme | Bearish-Extreme |
| NET POSITION MOVEMENT INDEX: | | | |
| – 6-Week Change in Strength Index: | -16.6 | 16.3 | 0.2 |
Bitcoin Futures:
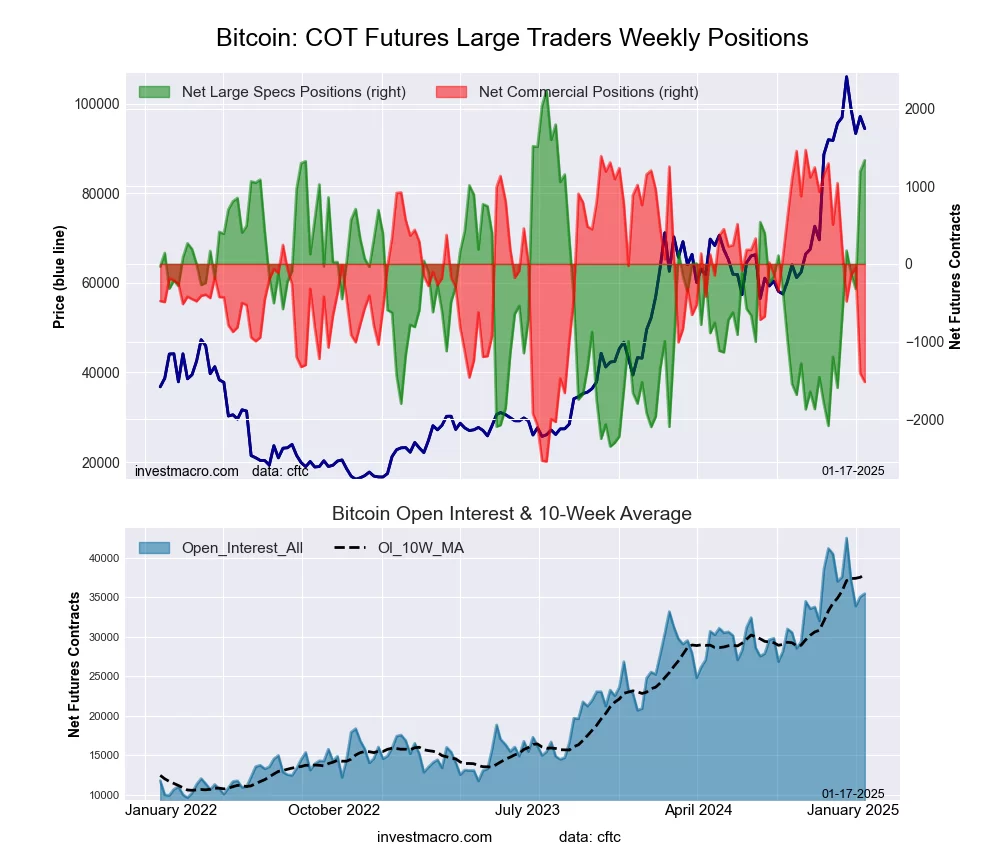 The Bitcoin large speculator standing this week resulted in a net position of 1,335 contracts in the data reported through Tuesday. This was a weekly gain of 145 contracts from the previous week which had a total of 1,190 net contracts.
This week’s current strength score (the trader positioning range over the past three years, measured from 0 to 100) shows the speculators are currently Bullish-Extreme with a score of 80.4 percent. The commercials are Bearish with a score of 25.5 percent and the small traders (not shown in chart) are Bearish with a score of 24.0 percent.
Price Trend-Following Model: Uptrend
Our weekly trend-following model classifies the current market price position as: Uptrend.
| BITCOIN Statistics | SPECULATORS | COMMERCIALS | SMALL TRADERS |
| – Percent of Open Interest Longs: | 81.7 | 3.7 | 3.7 |
| – Percent of Open Interest Shorts: | 77.9 | 8.0 | 3.2 |
| – Net Position: | 1,335 | -1,520 | 185 |
| – Gross Longs: | 28,966 | 1,330 | 1,304 |
| – Gross Shorts: | 27,631 | 2,850 | 1,119 |
| – Long to Short Ratio: | 1.0 to 1 | 0.5 to 1 | 1.2 to 1 |
| NET POSITION TREND: | | | |
| – Strength Index Score (3 Year Range Pct): | 80.4 | 25.5 | 24.0 |
| – Strength Index Reading (3 Year Range): | Bullish-Extreme | Bearish | Bearish |
| NET POSITION MOVEMENT INDEX: | | | |
| – 6-Week Change in Strength Index: | 63.9 | -63.9 | -27.4 |
Article By InvestMacro – Receive our weekly COT Newsletter
*COT Report: The COT data, released weekly to the public each Friday, is updated through the most recent Tuesday (data is 3 days old) and shows a quick view of how large speculators or non-commercials (for-profit traders) were positioned in the futures markets.
The CFTC categorizes trader positions according to commercial hedgers (traders who use futures contracts for hedging as part of the business), non-commercials (large traders who speculate to realize trading profits) and nonreportable traders (usually small traders/speculators) as well as their open interest (contracts open in the market at time of reporting). See CFTC criteria here.