By InvestMacro
Here are the latest charts and statistics for the Commitment of Traders (COT) data published by the Commodities Futures Trading Commission (CFTC).
The latest COT data is updated through Tuesday May 14th and shows a quick view of how large market participants (for-profit speculators and commercial traders) were positioned in the futures markets. All currency positions are in direct relation to the US dollar where, for example, a bet for the euro is a bet that the euro will rise versus the dollar while a bet against the euro will be a bet that the euro will decline versus the dollar.
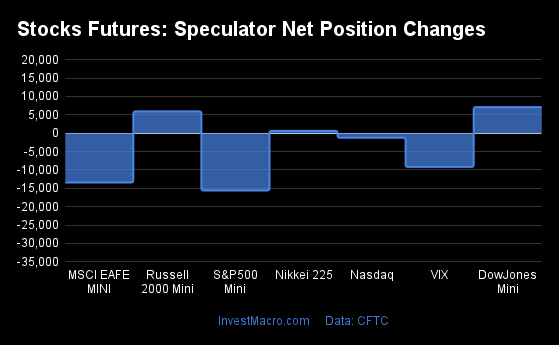
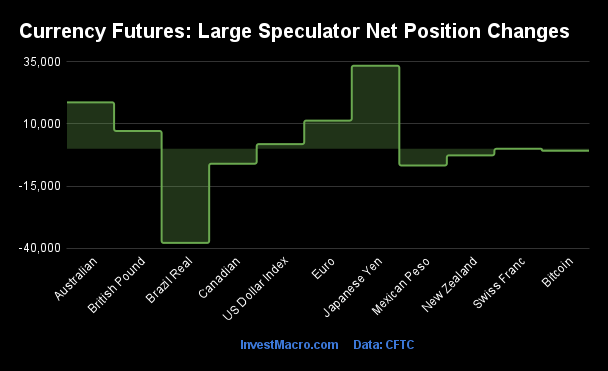
Weekly Speculator Changes led by Euro & Japanese Yen
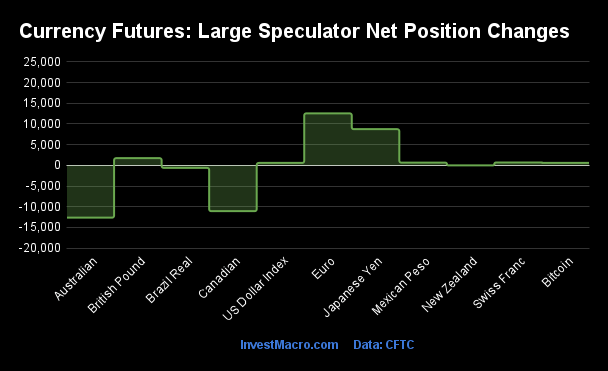
The COT currency market speculator bets were higher this week as seven out of the eleven currency markets we cover had higher positioning while the other four markets had lower speculator contracts.
Leading the gains for the currency markets was the EuroFX (12,565 contracts) with the Japanese Yen (8,740 contracts), the British Pound (1,738 contracts), the Swiss Franc (680 contracts), the Mexican Peso (649 contracts), Bitcoin (606 contracts) and the US Dollar Index (582 contracts) also having positive weeks.
The currencies seeing declines in speculator bets on the week were the Australian Dollar (-12,655 contracts), the Canadian Dollar (-11,082 contracts), the Brazilian Real (-616 contracts) and the New Zealand Dollar (-9 contracts) also registering lower bets on the week.
Currency Speculators raise Euro & US Dollar bets into positive levels
This week’s COT currency’s data saw a continued improvement in many currencies (EUR, USDIndex, GBP, JPY) that had seen their positions weakening significantly over the past few months. Overall, most of the currency positions remain in weak levels versus the US dollar as only the Mexican peso, the Euro and the USD Index currently have positive bullish speculator positions.
Here is this week’s COT currency roundup:
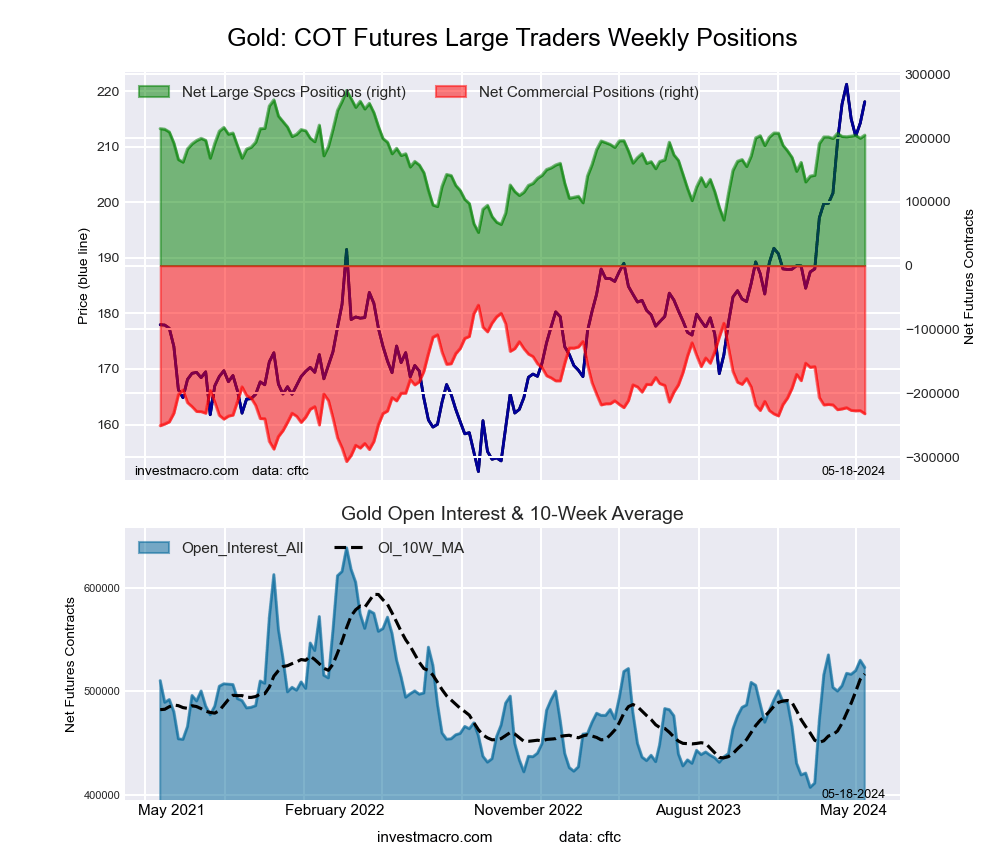
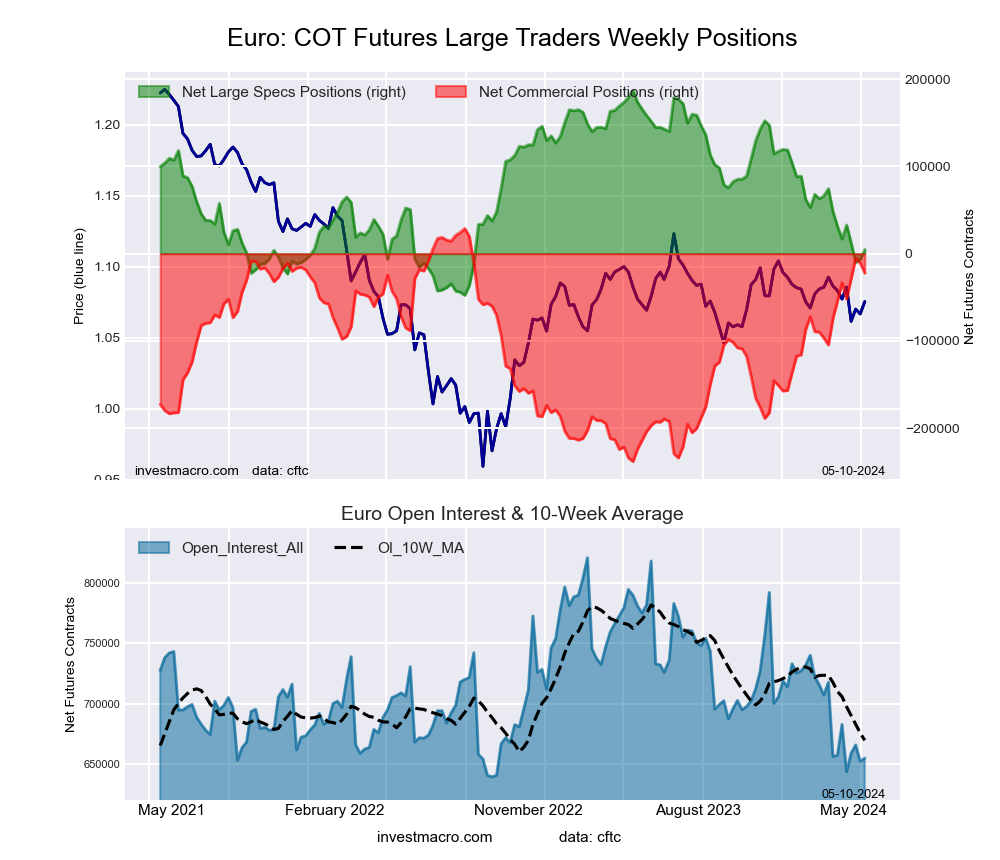
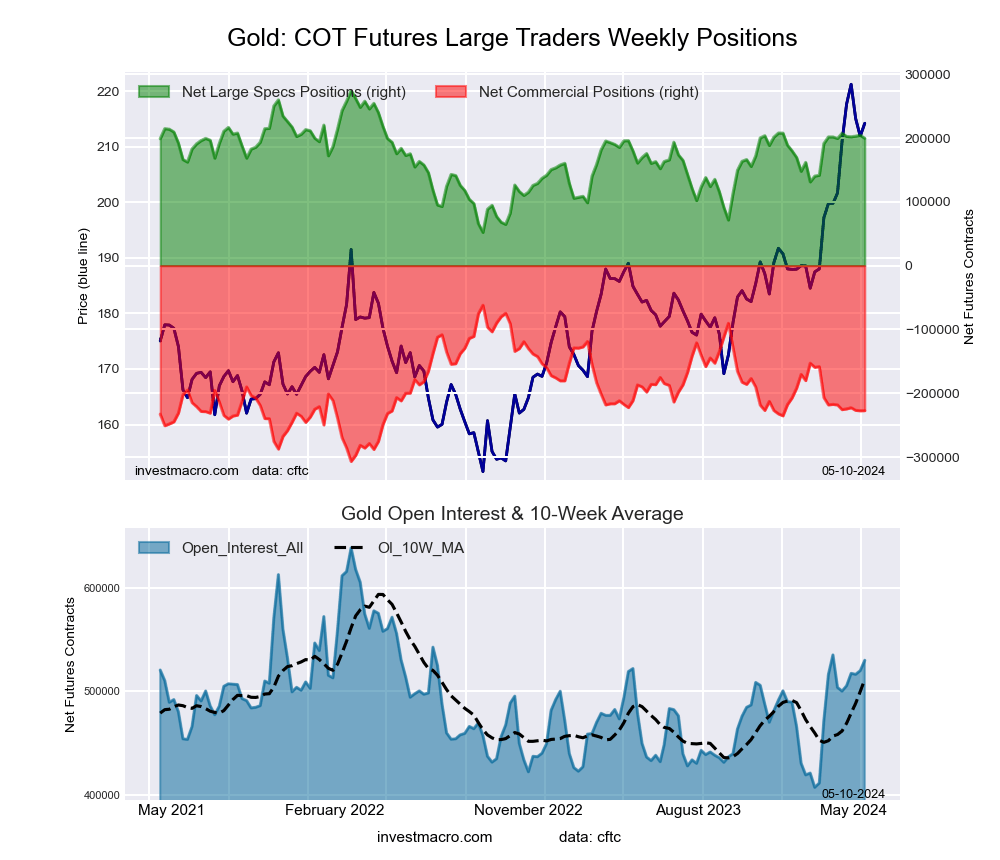
The Euro positions continue to rebound after a deeply negative stretch in March and April that took -84,396 contracts off the speculator position and dropped the Euro contracts into a bearish position for the first time since September of 2022. This week the Euro bets rose by +12,565 contracts following last week’s +11,367 contract gain and has brought the speculator standing to a current level of +17,155 contracts. The Euro exchange rate has been on a 5-week winning streak as well and closed this week at the 1.0889 level against the US dollar.
The US dollar index positions rose modestly again this week and have now been higher for six consecutive weeks. This recent bullishness has taken the speculator standing back into bullish territory after the position dipped into negative or bearish levels in March for the first time since 2021.
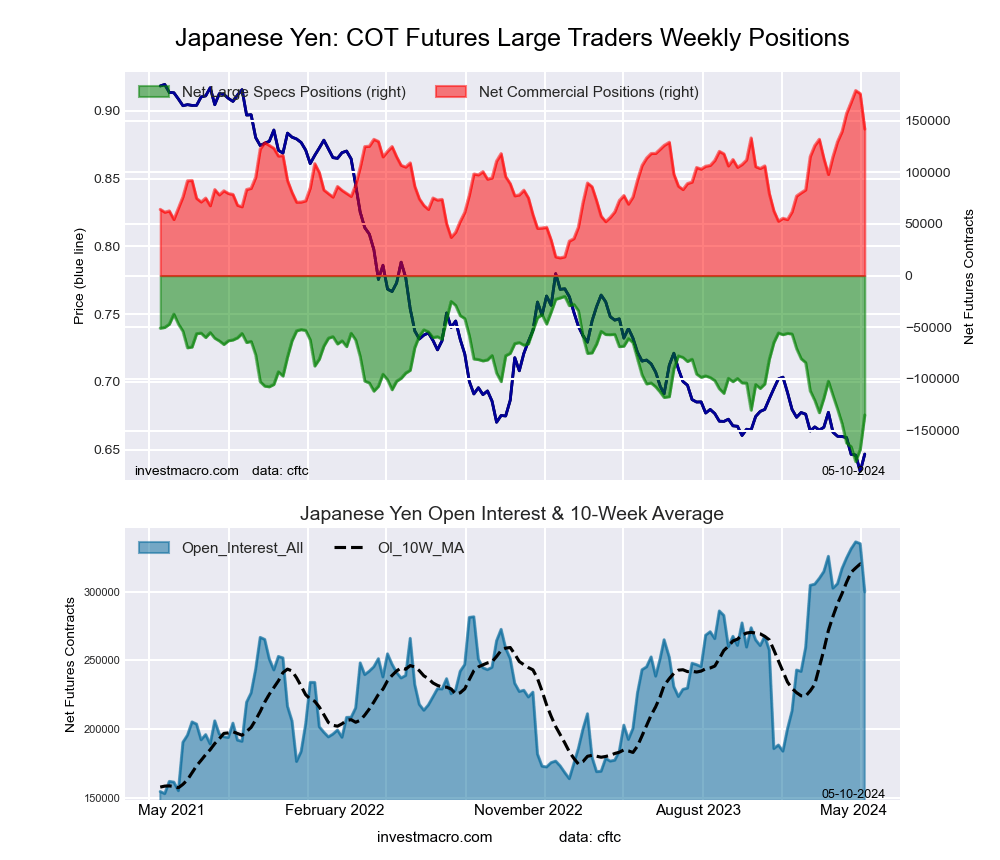
Japanese yen speculator bets continued to improve for a third straight week after falling to a multi-year low of -179,919 contracts on April 23rd. The three-week improvement has totaled +53,737 contracts and coincided with a reported intervention in the currency markets by the Japanese government to stop a sharp slide in the yen. Despite the intervention, the yen’s exchange rate versus the dollar continues to be historically weak with the USDJPY currency pair closing the week right around the 155.60 level.
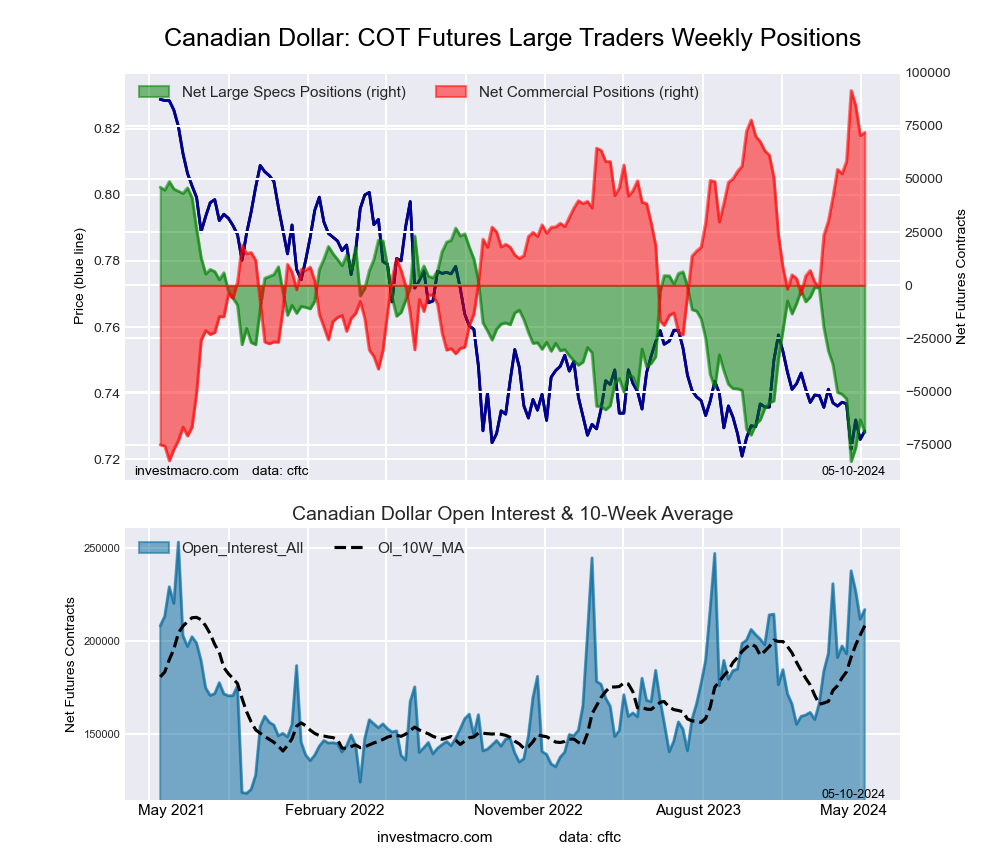
The Canadian dollar speculative position dropped for a second straight week this week and the current -80,303 contract level is the most bearish standing in a month for the CAD bets. The renewed bearishness for speculators has brought the CAD into extreme bearishness versus its range over the past three years with a 1.9 percent strength score. The Canadian dollar exchange rate remains in a down-trending channel versus the US dollar with our weekly trend model also considering the CAD to be in a downtrend at the moment. However, the CADUSD currency pair has recently bounced off a base of support around the 0.7250 level for the fourth time since 2022.
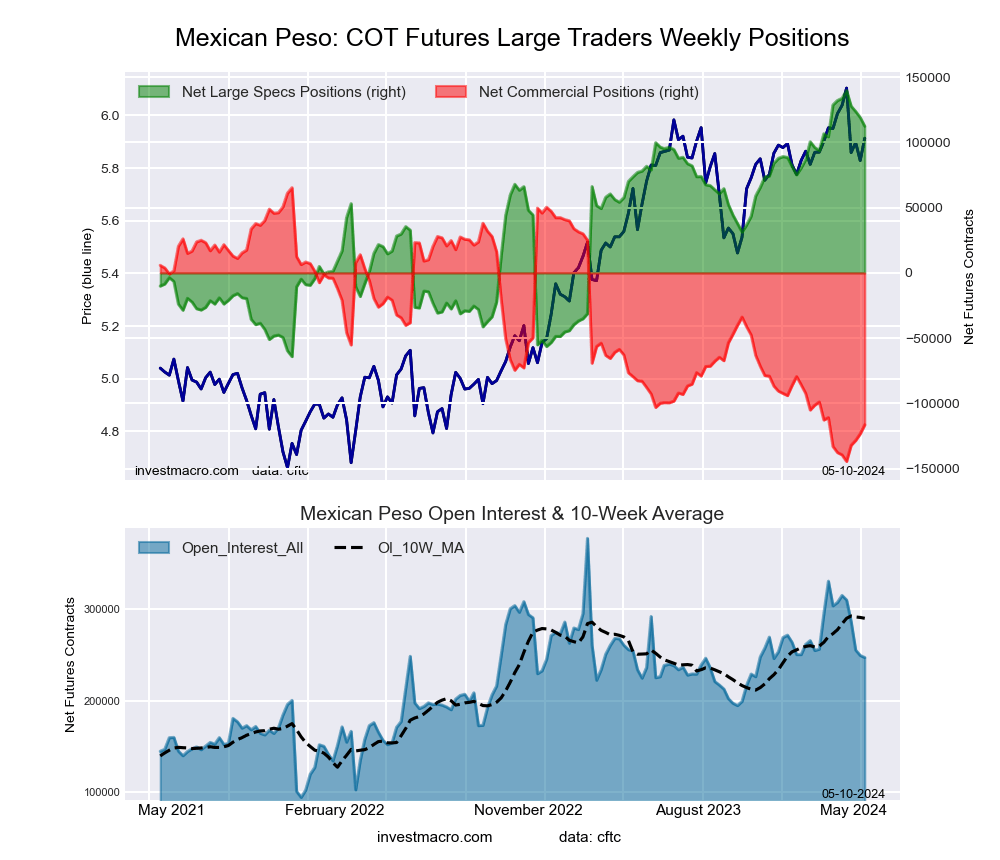
The Mexican Peso saw a small weekly gain by just 649 contracts but this broke a four-week losing streak that saw a total of -27,379 contracts subtracted from the overall bullish position. Despite the recent weakness in positions, the MXN speculative position has remained the most bullish currency versus the US dollar and has maintained a speculator position above the +100,000 contract level for eleven consecutive weeks. This is the best +100,000 contract streak since late-2019 into early-2020. The MXN exchange rate versus the USD has been trending strongly higher over the past three weeks with a gain of approximately 4 percent in these three weeks and has now brought the exchange rate into positive territory year-to-date.
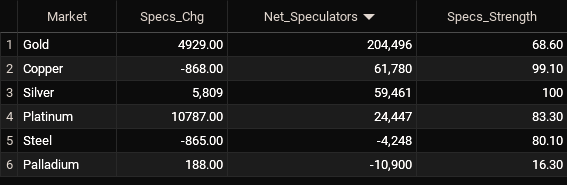
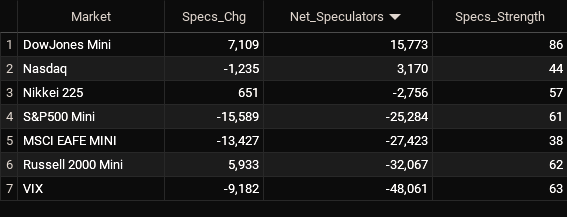
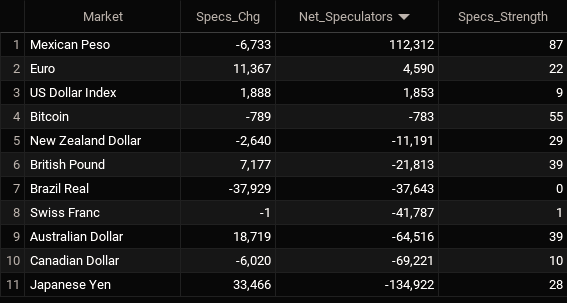
Currencies Net Speculators Leaderboard
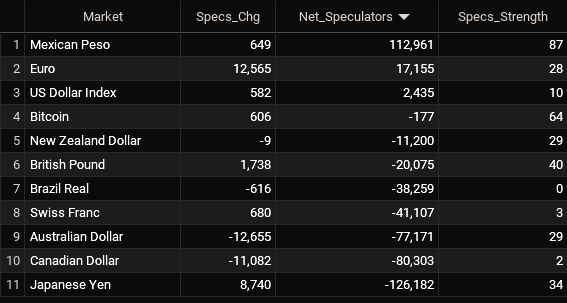
Legend: Weekly Speculators Change | Speculators Current Net Position | Speculators Strength Score compared to last 3-Years (0-100 range)
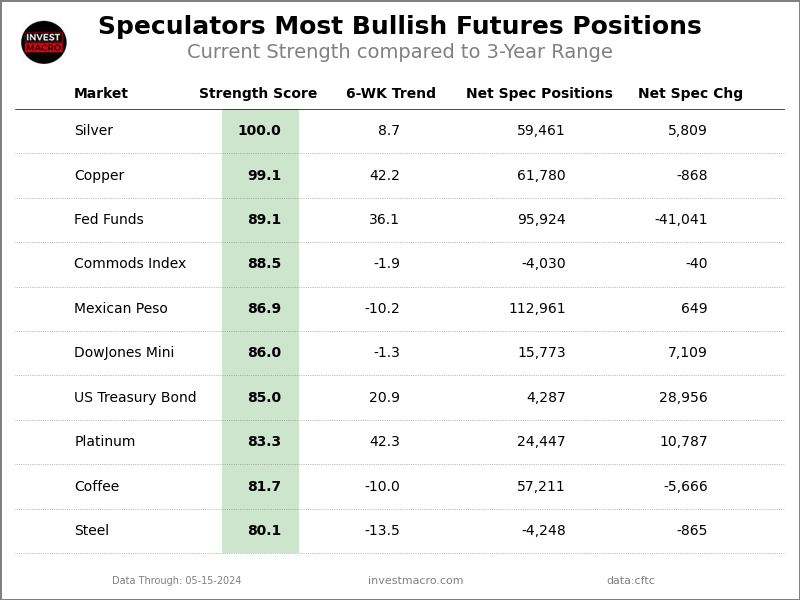
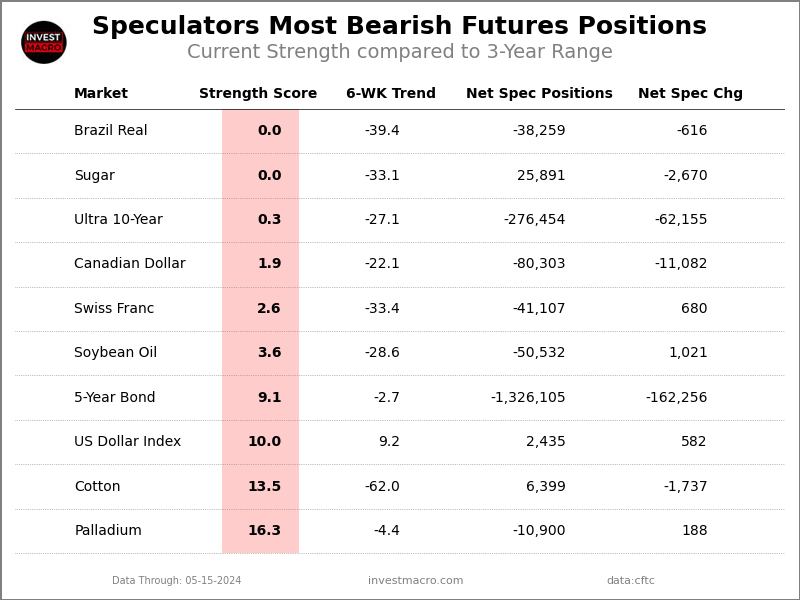
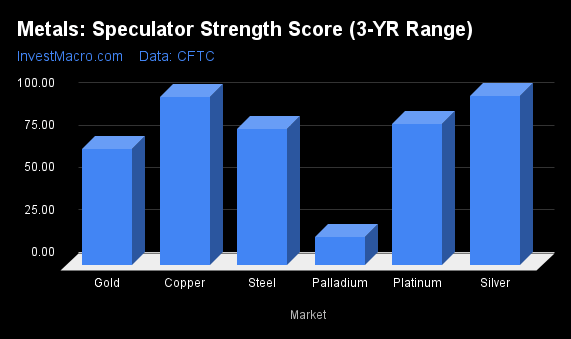
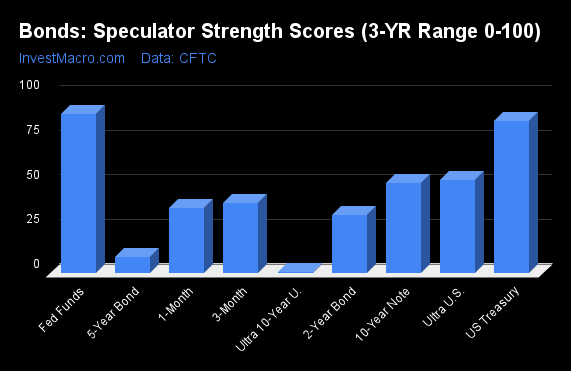
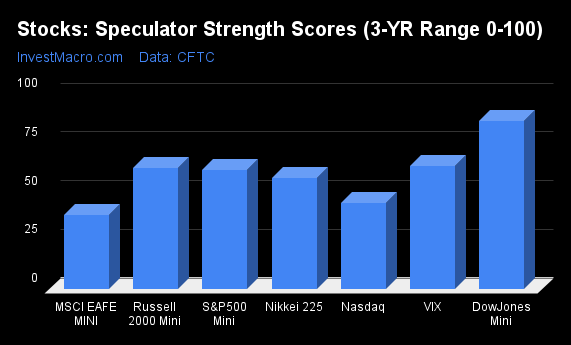
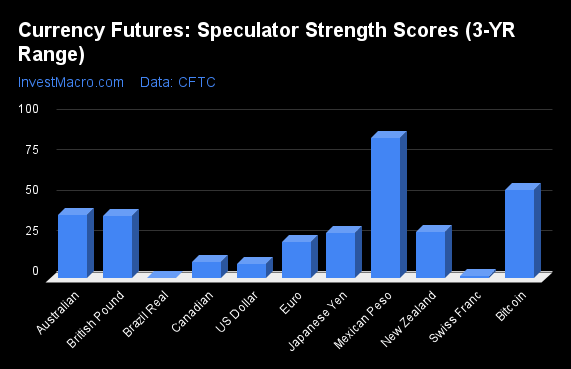
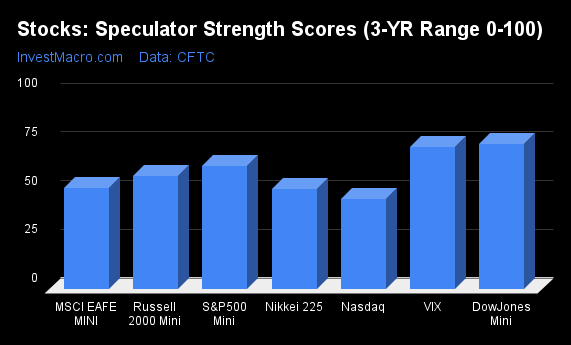
Strength Scores led by the Mexican Peso
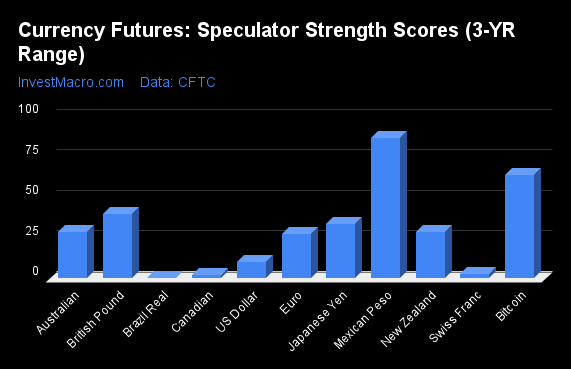
COT Strength Scores (a normalized measure of Speculator positions over a 3-Year range, from 0 to 100 where above 80 is Extreme-Bullish and below 20 is Extreme-Bearish) showed that the Mexican Peso (87 percent) leads the currency markets this week. Bitcoin (64 percent) comes in as the next highest in the weekly strength scores.
On the downside, the Brazilian Real (0 percent), the Canadian Dollar (2 percent), the Swiss Franc (3 percent) and the US Dollar Index (10 percent) come in at the lowest strength levels currently and are in Extreme-Bearish territory (below 20 percent).
Strength Statistics:
US Dollar Index (10.0 percent) vs US Dollar Index previous week (8.8 percent)
EuroFX (27.6 percent) vs EuroFX previous week (22.3 percent)
British Pound Sterling (40.0 percent) vs British Pound Sterling previous week (38.8 percent)
Japanese Yen (33.6 percent) vs Japanese Yen previous week (28.1 percent)
Swiss Franc (2.6 percent) vs Swiss Franc previous week (1.4 percent)
Canadian Dollar (1.9 percent) vs Canadian Dollar previous week (10.3 percent)
Australian Dollar (28.5 percent) vs Australian Dollar previous week (40.3 percent)
New Zealand Dollar (28.6 percent) vs New Zealand Dollar previous week (28.6 percent)
Mexican Peso (86.9 percent) vs Mexican Peso previous week (86.6 percent)
Brazilian Real (0.0 percent) vs Brazilian Real previous week (0.7 percent)
Bitcoin (63.7 percent) vs Bitcoin previous week (54.6 percent)
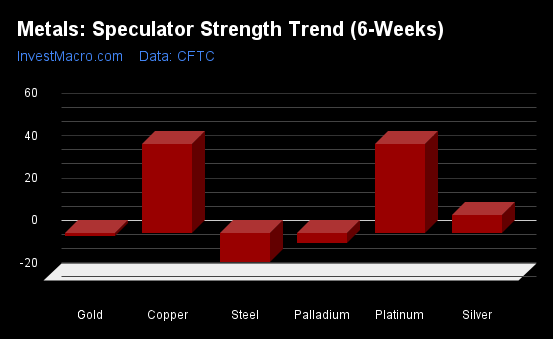
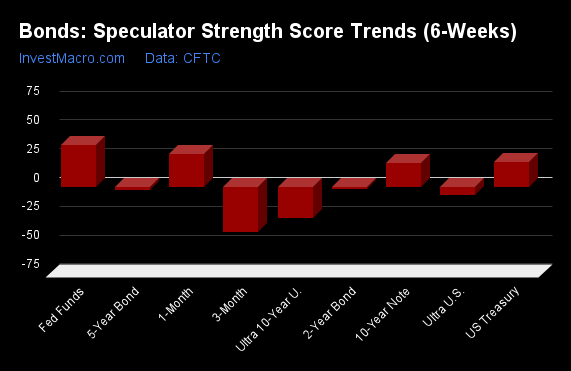
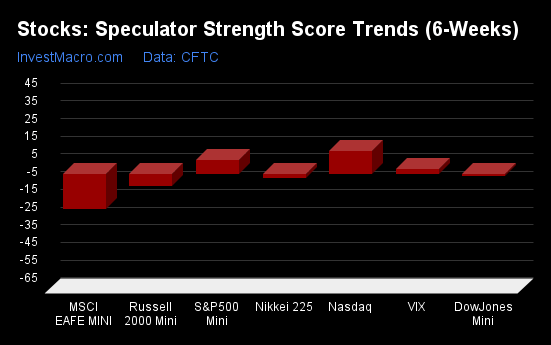
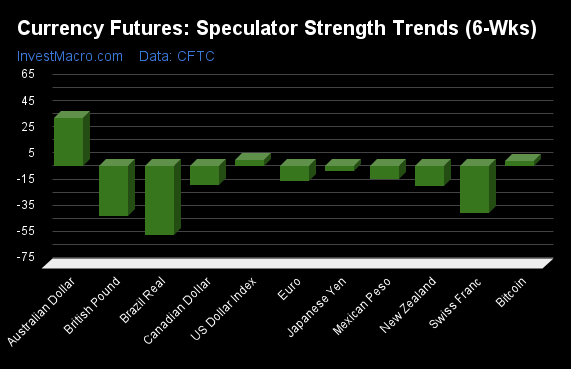
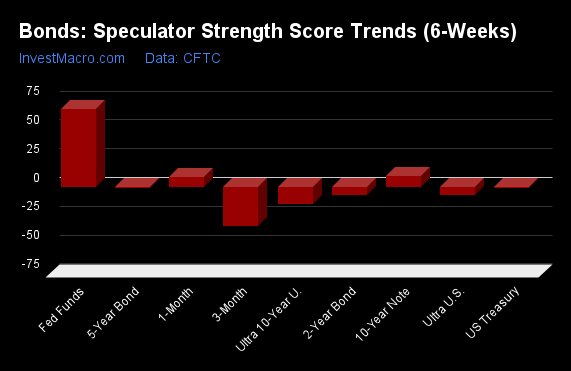
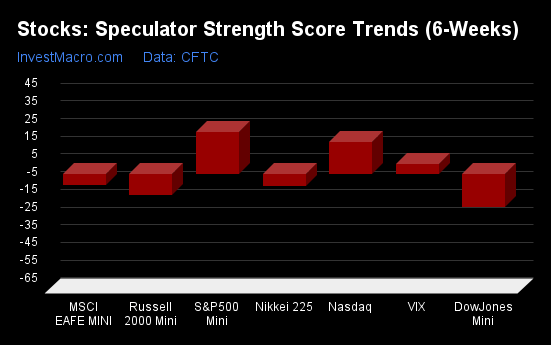
Australian Dollar & Japanese Yen top the 6-Week Strength Trends
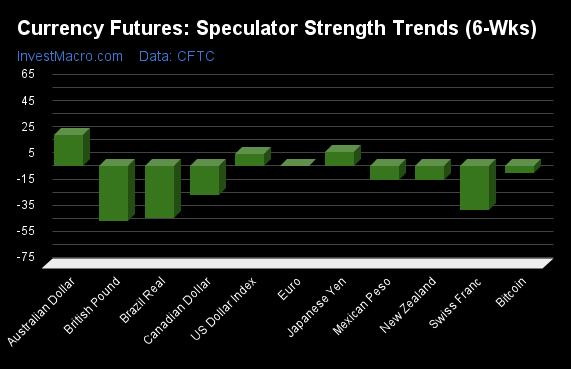
COT Strength Score Trends (or move index, calculates the 6-week changes in strength scores) showed that the Australian Dollar (24 percent) and the Japanese Yen (11 percent) lead the past six weeks trends for the currencies. The US Dollar Index (9 percent) is the next highest positive mover in the latest trends data.
The British Pound (-42 percent) leads the downside trend scores currently with the Brazilian Real (-39 percent), Swiss Franc (-33 percent) and the Canadian Dollar (-22 percent) following next with lower trend scores.
Strength Trend Statistics:
US Dollar Index (9.2 percent) vs US Dollar Index previous week (5.2 percent)
EuroFX (0.2 percent) vs EuroFX previous week (-11.3 percent)
British Pound Sterling (-42.1 percent) vs British Pound Sterling previous week (-37.8 percent)
Japanese Yen (10.7 percent) vs Japanese Yen previous week (-3.6 percent)
Swiss Franc (-33.4 percent) vs Swiss Franc previous week (-35.3 percent)
Canadian Dollar (-22.1 percent) vs Canadian Dollar previous week (-14.4 percent)
Australian Dollar (23.9 percent) vs Australian Dollar previous week (38.4 percent)
New Zealand Dollar (-10.4 percent) vs New Zealand Dollar previous week (-14.7 percent)
Mexican Peso (-10.2 percent) vs Mexican Peso previous week (-9.7 percent)
Brazilian Real (-39.4 percent) vs Brazilian Real previous week (-52.2 percent)
Bitcoin (-5.1 percent) vs Bitcoin previous week (4.4 percent)
Individual COT Forex Markets:
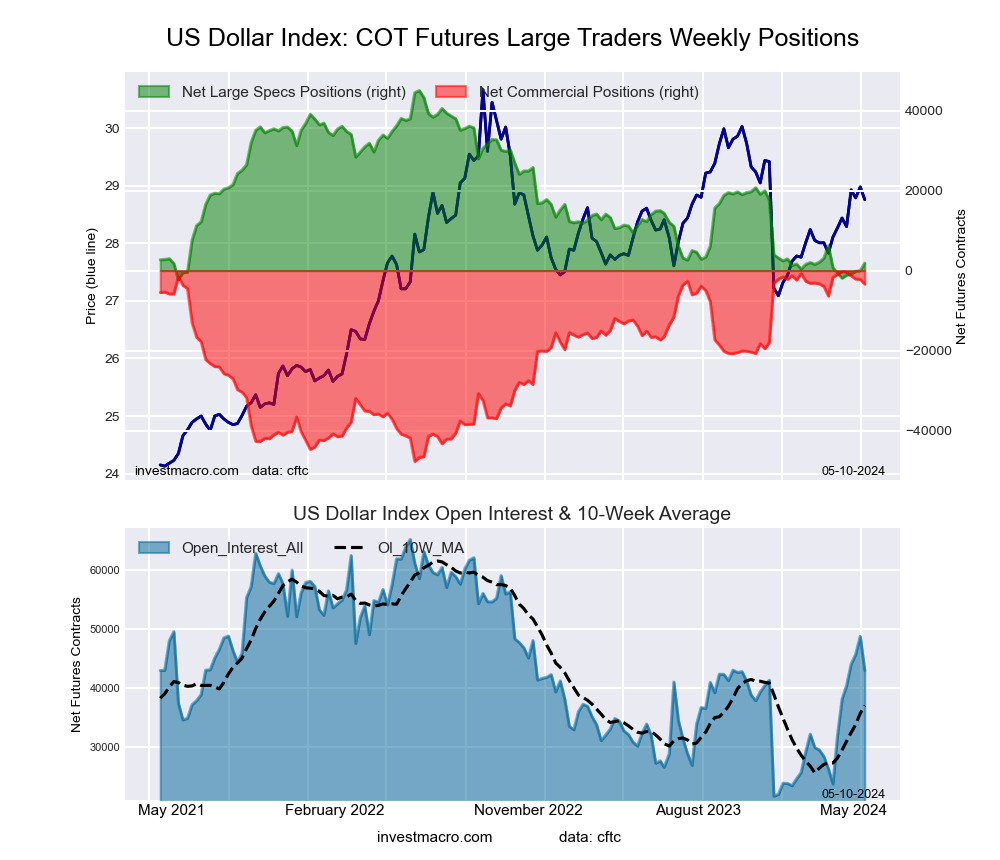
US Dollar Index Futures:
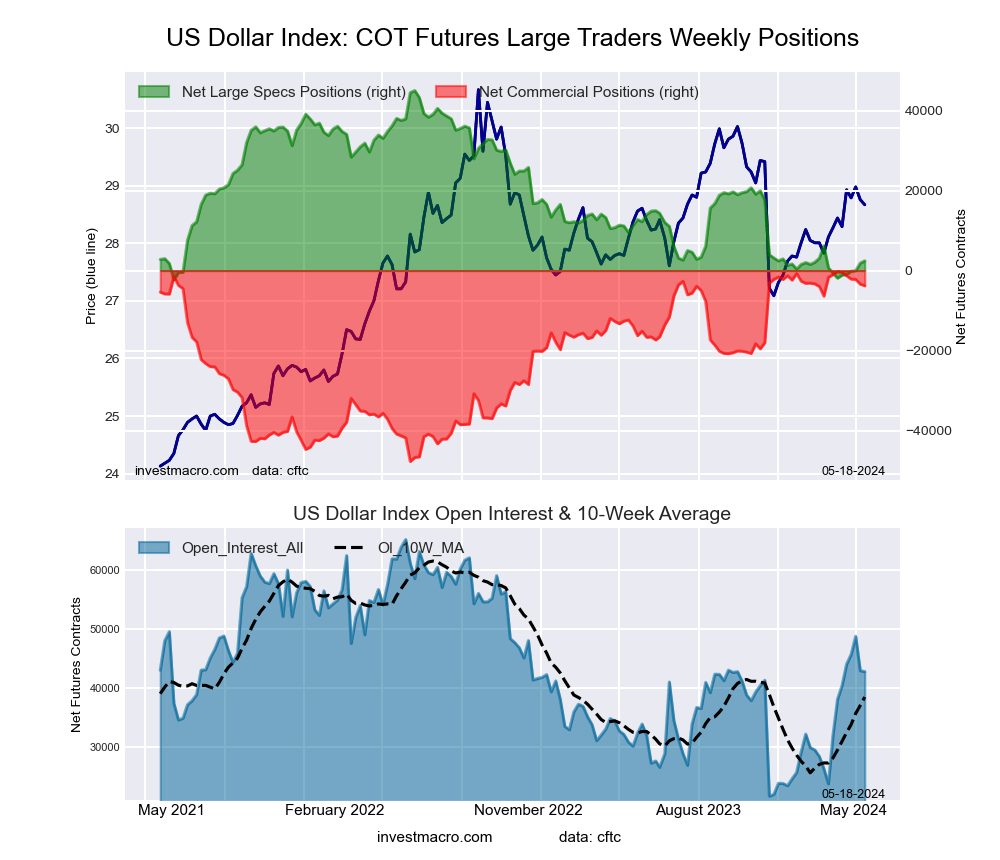 The US Dollar Index large speculator standing this week was a net position of 2,435 contracts in the data reported through Tuesday. This was a weekly boost of 582 contracts from the previous week which had a total of 1,853 net contracts.
This week’s current strength score (the trader positioning range over the past three years, measured from 0 to 100) shows the speculators are currently Bearish-Extreme with a score of 10.0 percent. The commercials are Bullish-Extreme with a score of 92.7 percent and the small traders (not shown in chart) are Bearish with a score of 26.9 percent.
Price Trend-Following Model: Uptrend
Our weekly trend-following model classifies the current market price position as: Uptrend. The current action for the model is considered to be: Hold – Maintain Long Position.
| US DOLLAR INDEX Statistics | SPECULATORS | COMMERCIALS | SMALL TRADERS |
| – Percent of Open Interest Longs: | 69.3 | 19.8 | 8.3 |
| – Percent of Open Interest Shorts: | 63.6 | 28.6 | 5.1 |
| – Net Position: | 2,435 | -3,790 | 1,355 |
| – Gross Longs: | 29,682 | 8,472 | 3,535 |
| – Gross Shorts: | 27,247 | 12,262 | 2,180 |
| – Long to Short Ratio: | 1.1 to 1 | 0.7 to 1 | 1.6 to 1 |
| NET POSITION TREND: | |||
| – Strength Index Score (3 Year Range Pct): | 10.0 | 92.7 | 26.9 |
| – Strength Index Reading (3 Year Range): | Bearish-Extreme | Bullish-Extreme | Bearish |
| NET POSITION MOVEMENT INDEX: | |||
| – 6-Week Change in Strength Index: | 9.2 | -7.3 | -9.8 |
Euro Currency Futures:
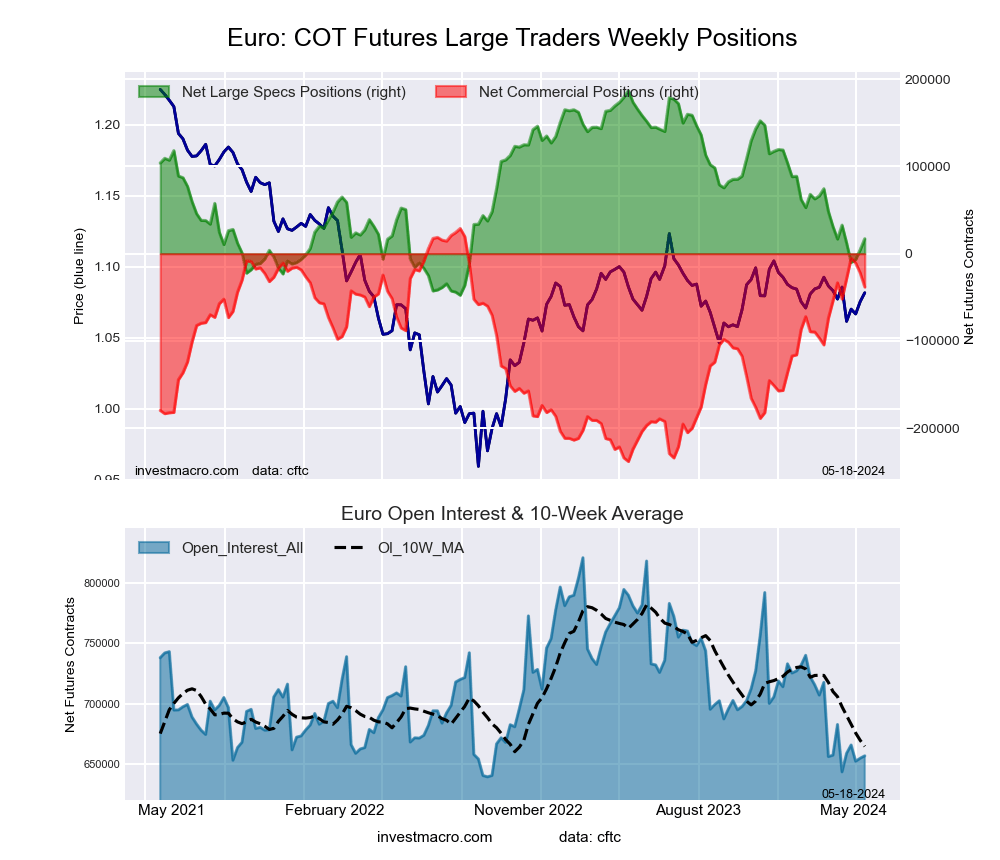 The Euro Currency large speculator standing this week was a net position of 17,155 contracts in the data reported through Tuesday. This was a weekly boost of 12,565 contracts from the previous week which had a total of 4,590 net contracts.
This week’s current strength score (the trader positioning range over the past three years, measured from 0 to 100) shows the speculators are currently Bearish with a score of 27.6 percent. The commercials are Bullish with a score of 74.9 percent and the small traders (not shown in chart) are Bearish-Extreme with a score of 12.7 percent.
Price Trend-Following Model: Weak Downtrend
Our weekly trend-following model classifies the current market price position as: Weak Downtrend. The current action for the model is considered to be: Hold – Maintain Short Position.
| EURO Currency Statistics | SPECULATORS | COMMERCIALS | SMALL TRADERS |
| – Percent of Open Interest Longs: | 27.2 | 59.0 | 11.6 |
| – Percent of Open Interest Shorts: | 24.5 | 64.9 | 8.4 |
| – Net Position: | 17,155 | -38,282 | 21,127 |
| – Gross Longs: | 178,398 | 387,812 | 76,472 |
| – Gross Shorts: | 161,243 | 426,094 | 55,345 |
| – Long to Short Ratio: | 1.1 to 1 | 0.9 to 1 | 1.4 to 1 |
| NET POSITION TREND: | |||
| – Strength Index Score (3 Year Range Pct): | 27.6 | 74.9 | 12.7 |
| – Strength Index Reading (3 Year Range): | Bearish | Bullish | Bearish-Extreme |
| NET POSITION MOVEMENT INDEX: | |||
| – 6-Week Change in Strength Index: | 0.2 | -1.8 | 7.2 |
British Pound Sterling Futures:
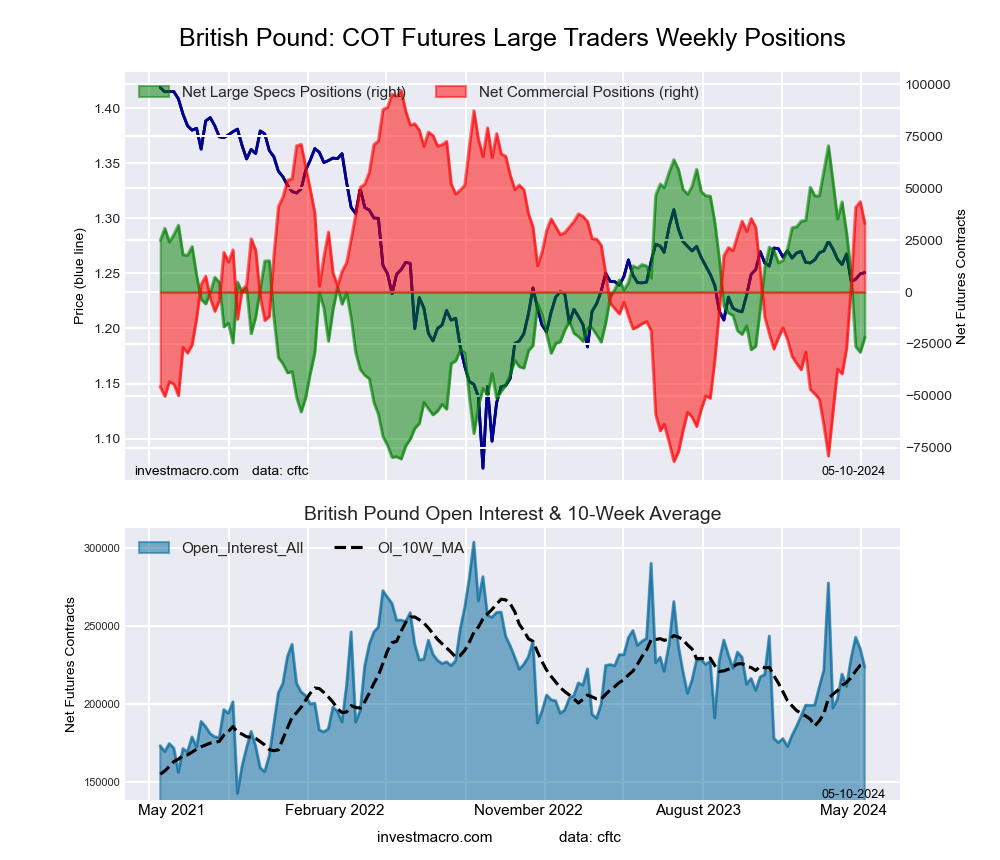
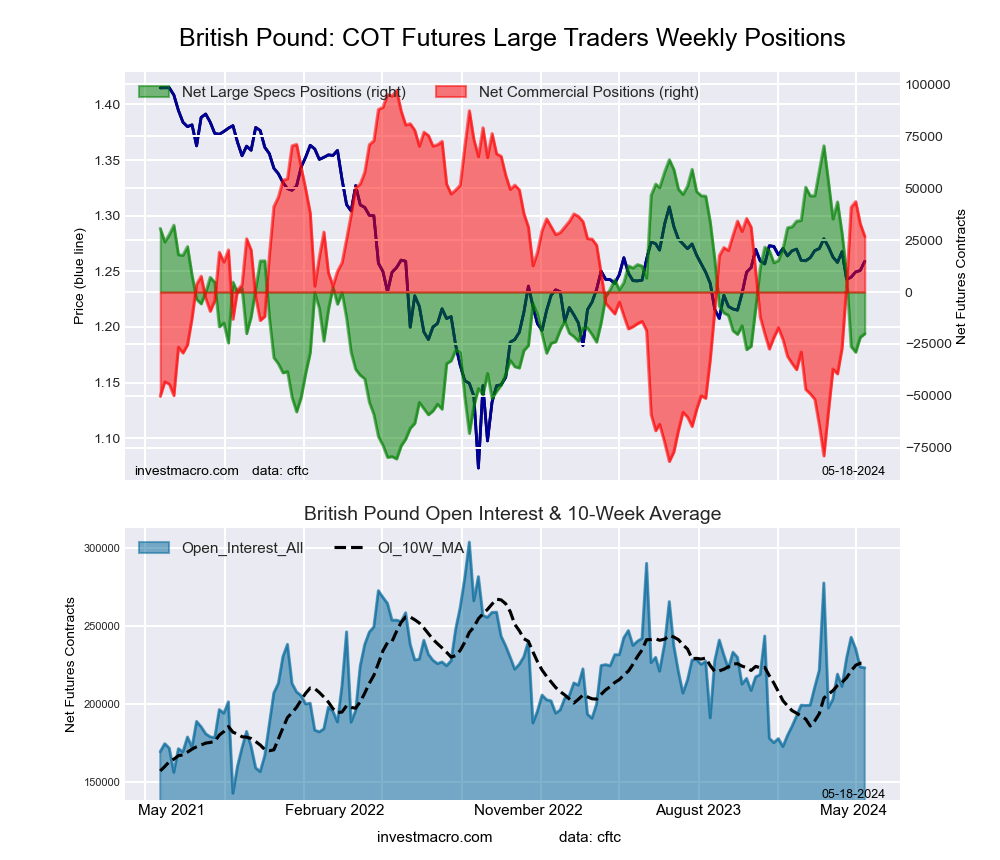 The British Pound Sterling large speculator standing this week was a net position of -20,075 contracts in the data reported through Tuesday. This was a weekly lift of 1,738 contracts from the previous week which had a total of -21,813 net contracts.
This week’s current strength score (the trader positioning range over the past three years, measured from 0 to 100) shows the speculators are currently Bearish with a score of 40.0 percent. The commercials are Bullish with a score of 60.7 percent and the small traders (not shown in chart) are Bearish with a score of 46.5 percent.
Price Trend-Following Model: Weak Downtrend
Our weekly trend-following model classifies the current market price position as: Weak Downtrend. The current action for the model is considered to be: Hold – Maintain Short Position.
| BRITISH POUND Statistics | SPECULATORS | COMMERCIALS | SMALL TRADERS |
| – Percent of Open Interest Longs: | 21.8 | 61.8 | 11.6 |
| – Percent of Open Interest Shorts: | 30.8 | 49.8 | 14.6 |
| – Net Position: | -20,075 | 26,795 | -6,720 |
| – Gross Longs: | 48,674 | 137,917 | 25,869 |
| – Gross Shorts: | 68,749 | 111,122 | 32,589 |
| – Long to Short Ratio: | 0.7 to 1 | 1.2 to 1 | 0.8 to 1 |
| NET POSITION TREND: | |||
| – Strength Index Score (3 Year Range Pct): | 40.0 | 60.7 | 46.5 |
| – Strength Index Reading (3 Year Range): | Bearish | Bullish | Bearish |
| NET POSITION MOVEMENT INDEX: | |||
| – 6-Week Change in Strength Index: | -42.1 | 37.1 | -5.5 |
Japanese Yen Futures:
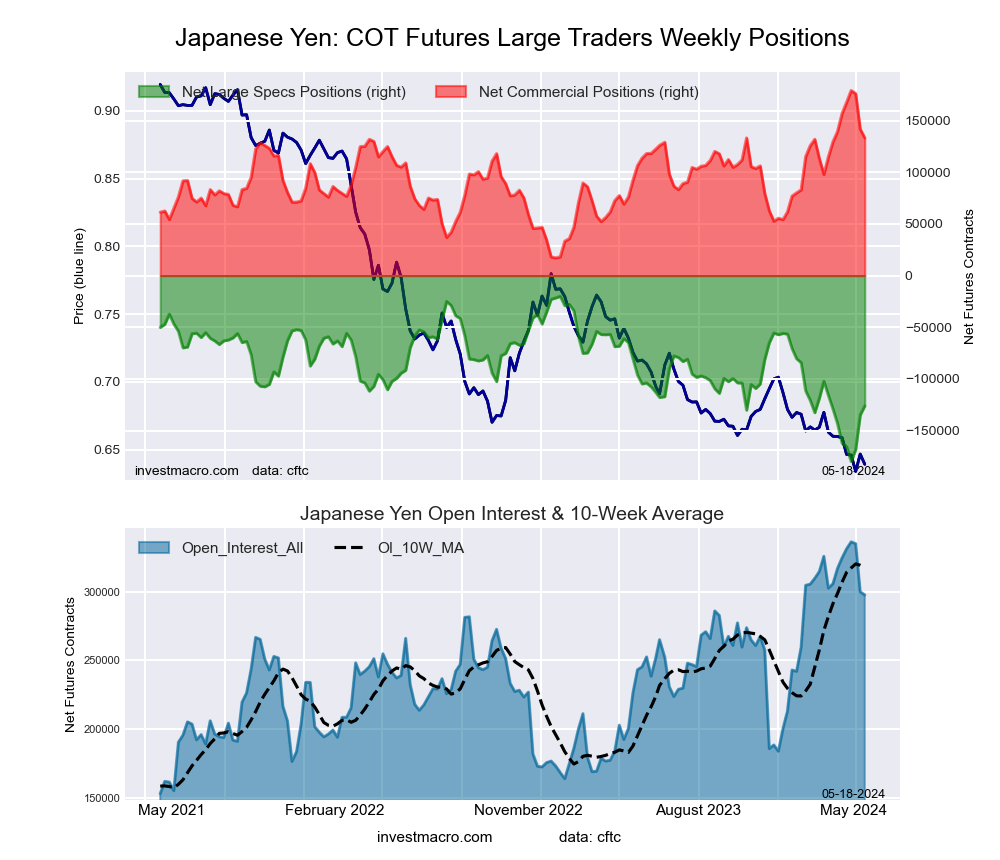 The Japanese Yen large speculator standing this week was a net position of -126,182 contracts in the data reported through Tuesday. This was a weekly rise of 8,740 contracts from the previous week which had a total of -134,922 net contracts.
This week’s current strength score (the trader positioning range over the past three years, measured from 0 to 100) shows the speculators are currently Bearish with a score of 33.6 percent. The commercials are Bullish with a score of 71.7 percent and the small traders (not shown in chart) are Bullish with a score of 60.3 percent.
Price Trend-Following Model: Downtrend
Our weekly trend-following model classifies the current market price position as: Downtrend. The current action for the model is considered to be: Hold – Maintain Short Position.
| JAPANESE YEN Statistics | SPECULATORS | COMMERCIALS | SMALL TRADERS |
| – Percent of Open Interest Longs: | 11.9 | 72.7 | 13.3 |
| – Percent of Open Interest Shorts: | 54.3 | 27.9 | 15.6 |
| – Net Position: | -126,182 | 133,294 | -7,112 |
| – Gross Longs: | 35,303 | 216,442 | 39,446 |
| – Gross Shorts: | 161,485 | 83,148 | 46,558 |
| – Long to Short Ratio: | 0.2 to 1 | 2.6 to 1 | 0.8 to 1 |
| NET POSITION TREND: | |||
| – Strength Index Score (3 Year Range Pct): | 33.6 | 71.7 | 60.3 |
| – Strength Index Reading (3 Year Range): | Bearish | Bullish | Bullish |
| NET POSITION MOVEMENT INDEX: | |||
| – 6-Week Change in Strength Index: | 10.7 | -3.8 | -34.1 |
Swiss Franc Futures:
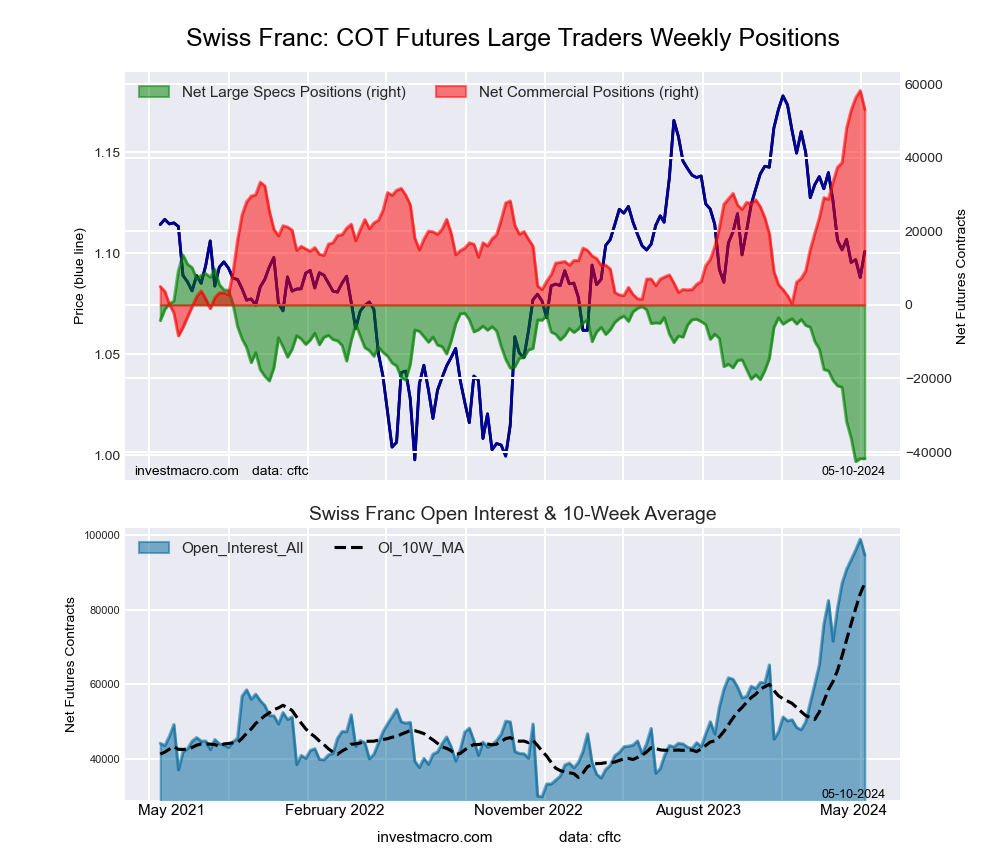
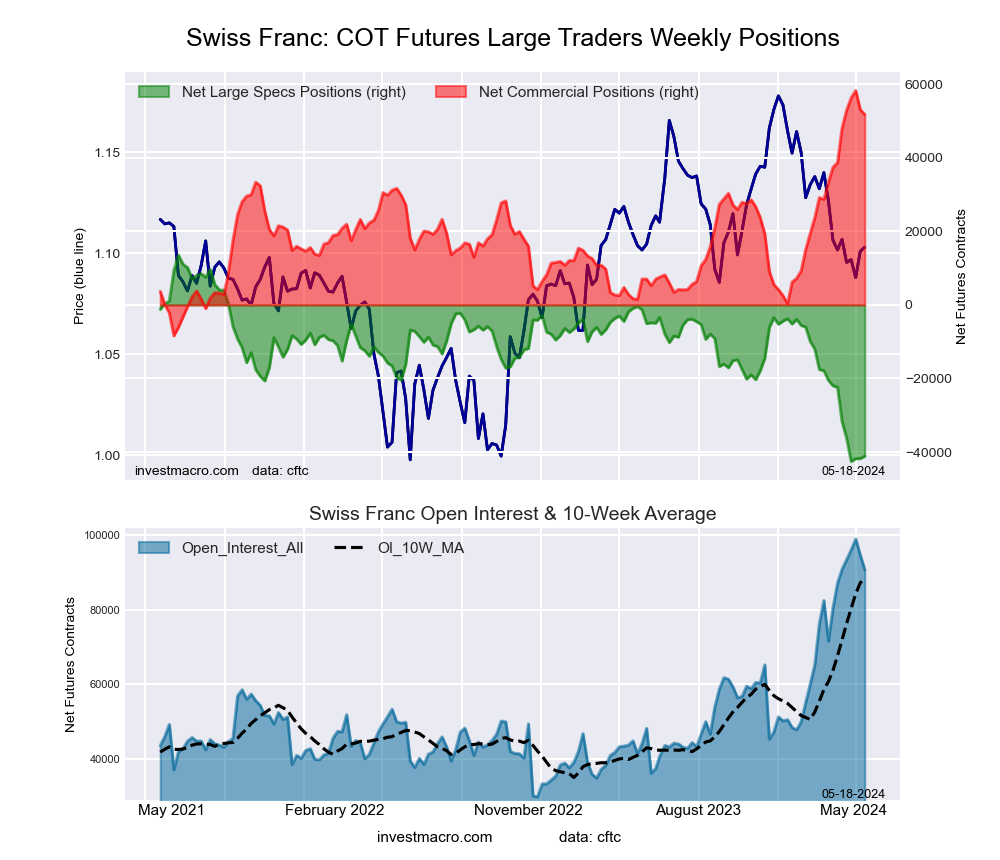 The Swiss Franc large speculator standing this week was a net position of -41,107 contracts in the data reported through Tuesday. This was a small weekly advance of 680 contracts from the previous week which had a total of -41,787 net contracts.
This week’s current strength score (the trader positioning range over the past three years, measured from 0 to 100) shows the speculators are currently Bearish-Extreme with a score of 2.6 percent. The commercials are Bullish-Extreme with a score of 90.2 percent and the small traders (not shown in chart) are Bearish with a score of 28.8 percent.
Price Trend-Following Model: Downtrend
Our weekly trend-following model classifies the current market price position as: Downtrend. The current action for the model is considered to be: Hold – Maintain Short Position.
| SWISS FRANC Statistics | SPECULATORS | COMMERCIALS | SMALL TRADERS |
| – Percent of Open Interest Longs: | 7.3 | 79.1 | 12.3 |
| – Percent of Open Interest Shorts: | 52.6 | 22.0 | 24.0 |
| – Net Position: | -41,107 | 51,769 | -10,662 |
| – Gross Longs: | 6,646 | 71,745 | 11,121 |
| – Gross Shorts: | 47,753 | 19,976 | 21,783 |
| – Long to Short Ratio: | 0.1 to 1 | 3.6 to 1 | 0.5 to 1 |
| NET POSITION TREND: | |||
| – Strength Index Score (3 Year Range Pct): | 2.6 | 90.2 | 28.8 |
| – Strength Index Reading (3 Year Range): | Bearish-Extreme | Bullish-Extreme | Bearish |
| NET POSITION MOVEMENT INDEX: | |||
| – 6-Week Change in Strength Index: | -33.4 | 19.6 | 25.7 |
Canadian Dollar Futures:
 The Canadian Dollar large speculator standing this week was a net position of -80,303 contracts in the data reported through Tuesday. This was a weekly decrease of -11,082 contracts from the previous week which had a total of -69,221 net contracts.
This week’s current strength score (the trader positioning range over the past three years, measured from 0 to 100) shows the speculators are currently Bearish-Extreme with a score of 1.9 percent. The commercials are Bullish-Extreme with a score of 92.3 percent and the small traders (not shown in chart) are Bearish with a score of 28.1 percent.
Price Trend-Following Model: Downtrend
Our weekly trend-following model classifies the current market price position as: Downtrend. The current action for the model is considered to be: Hold – Maintain Short Position.
| CANADIAN DOLLAR Statistics | SPECULATORS | COMMERCIALS | SMALL TRADERS |
| – Percent of Open Interest Longs: | 15.5 | 66.8 | 14.7 |
| – Percent of Open Interest Shorts: | 51.9 | 31.4 | 13.8 |
| – Net Position: | -80,303 | 78,220 | 2,083 |
| – Gross Longs: | 34,286 | 147,626 | 32,492 |
| – Gross Shorts: | 114,589 | 69,406 | 30,409 |
| – Long to Short Ratio: | 0.3 to 1 | 2.1 to 1 | 1.1 to 1 |
| NET POSITION TREND: | |||
| – Strength Index Score (3 Year Range Pct): | 1.9 | 92.3 | 28.1 |
| – Strength Index Reading (3 Year Range): | Bearish-Extreme | Bullish-Extreme | Bearish |
| NET POSITION MOVEMENT INDEX: | |||
| – 6-Week Change in Strength Index: | -22.1 | 14.8 | 7.6 |
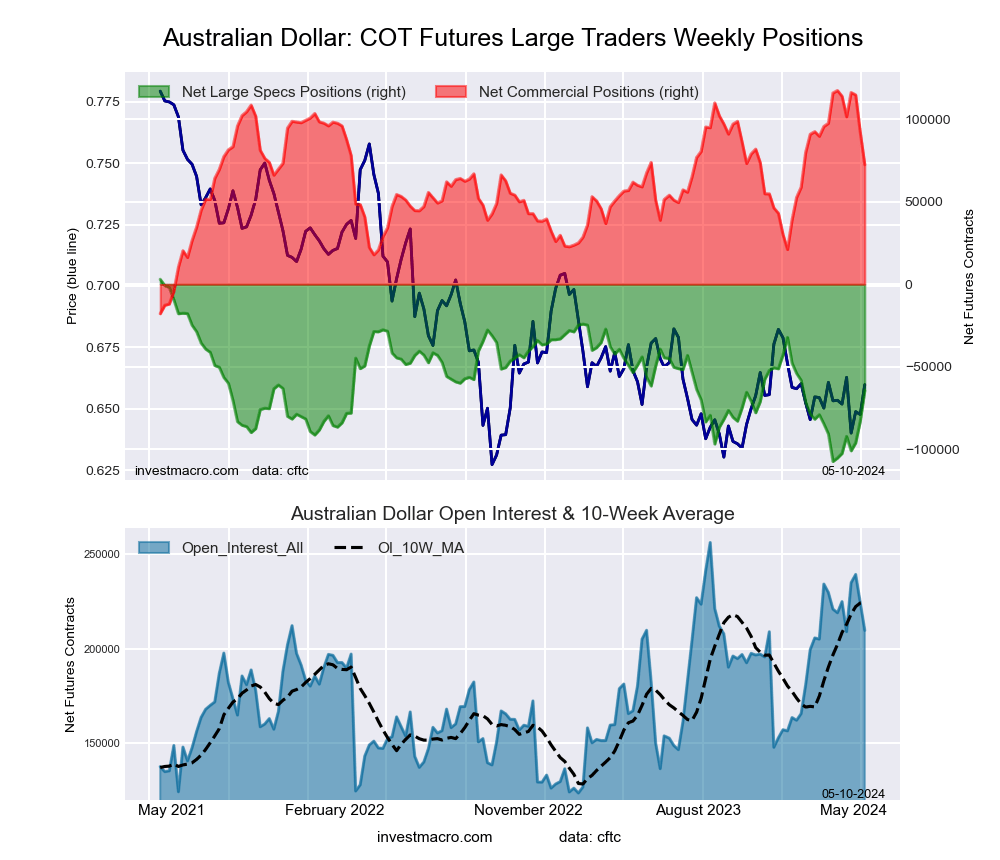
Australian Dollar Futures:
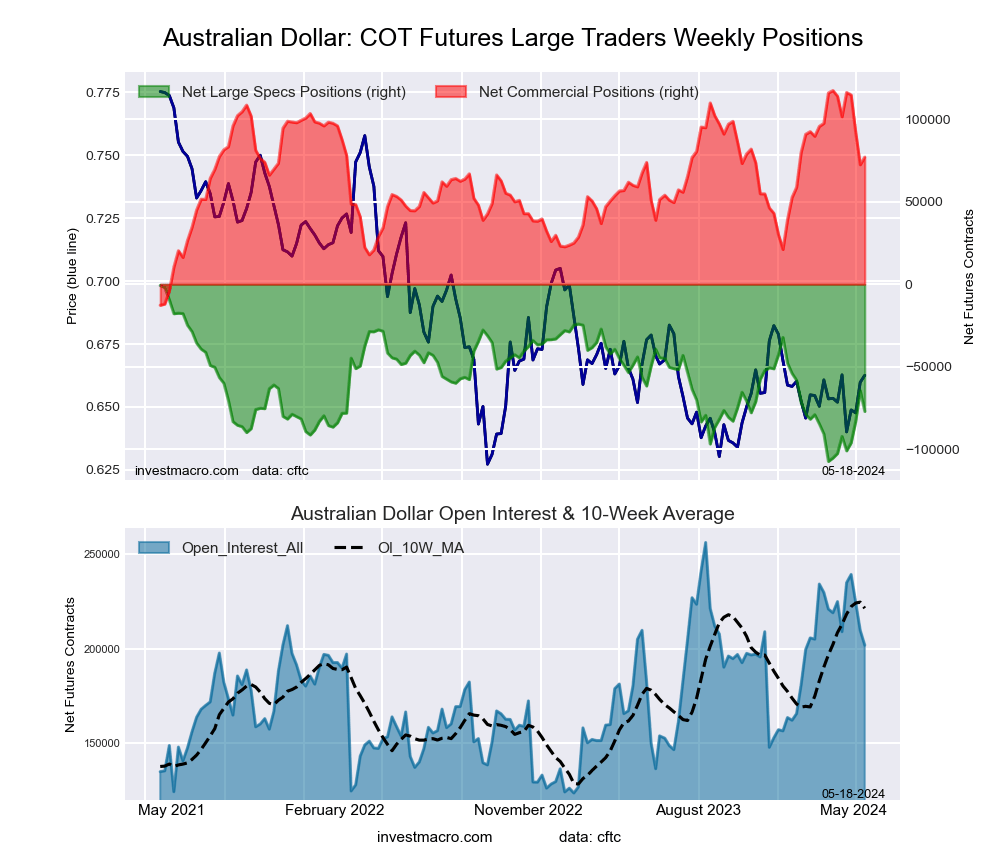 The Australian Dollar large speculator standing this week was a net position of -77,171 contracts in the data reported through Tuesday. This was a weekly drop of -12,655 contracts from the previous week which had a total of -64,516 net contracts.
This week’s current strength score (the trader positioning range over the past three years, measured from 0 to 100) shows the speculators are currently Bearish with a score of 28.5 percent. The commercials are Bullish with a score of 69.0 percent and the small traders (not shown in chart) are Bullish with a score of 58.7 percent.
Price Trend-Following Model: Weak Downtrend
Our weekly trend-following model classifies the current market price position as: Weak Downtrend. The current action for the model is considered to be: Hold – Maintain Short Position.
| AUSTRALIAN DOLLAR Statistics | SPECULATORS | COMMERCIALS | SMALL TRADERS |
| – Percent of Open Interest Longs: | 19.9 | 65.2 | 12.8 |
| – Percent of Open Interest Shorts: | 58.1 | 27.0 | 12.8 |
| – Net Position: | -77,171 | 77,142 | 29 |
| – Gross Longs: | 40,059 | 131,596 | 25,881 |
| – Gross Shorts: | 117,230 | 54,454 | 25,852 |
| – Long to Short Ratio: | 0.3 to 1 | 2.4 to 1 | 1.0 to 1 |
| NET POSITION TREND: | |||
| – Strength Index Score (3 Year Range Pct): | 28.5 | 69.0 | 58.7 |
| – Strength Index Reading (3 Year Range): | Bearish | Bullish | Bullish |
| NET POSITION MOVEMENT INDEX: | |||
| – 6-Week Change in Strength Index: | 23.9 | -28.3 | 31.2 |
New Zealand Dollar Futures:
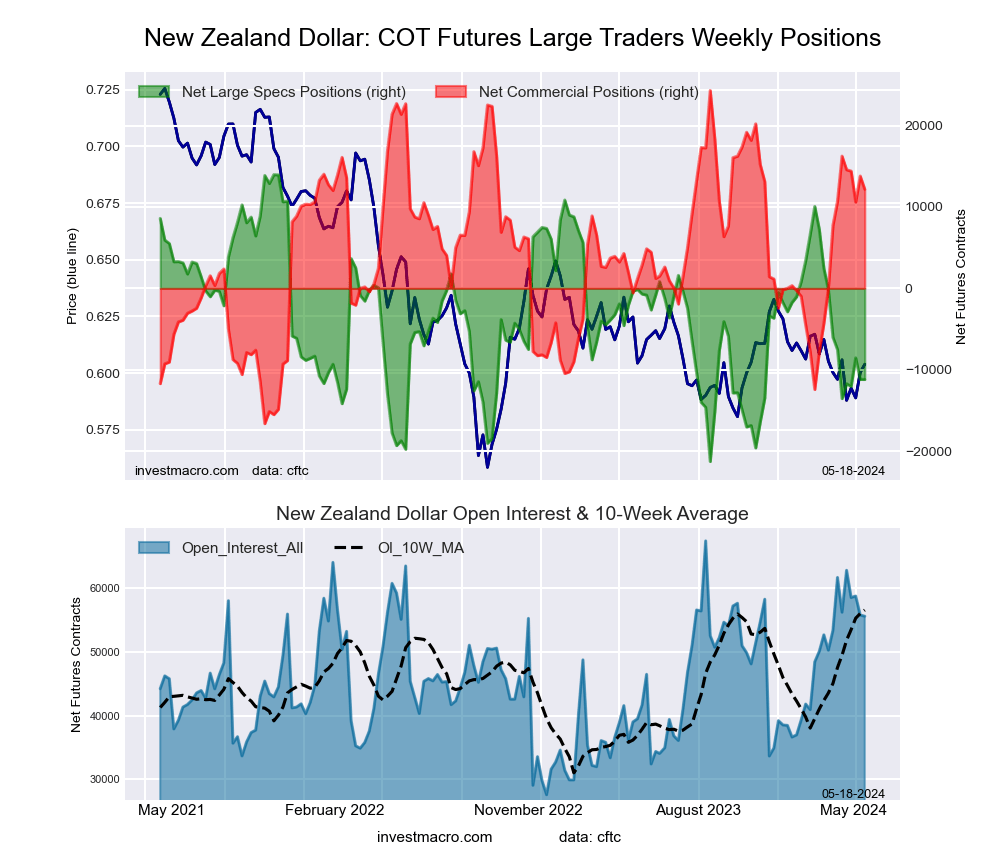 The New Zealand Dollar large speculator standing this week was a net position of -11,200 contracts in the data reported through Tuesday. This was a weekly dip of just -9 contracts from the previous week which had a total of -11,191 net contracts.
This week’s current strength score (the trader positioning range over the past three years, measured from 0 to 100) shows the speculators are currently Bearish with a score of 28.6 percent. The commercials are Bullish with a score of 70.3 percent and the small traders (not shown in chart) are Bearish with a score of 41.8 percent.
Price Trend-Following Model: Weak Downtrend
Our weekly trend-following model classifies the current market price position as: Weak Downtrend. The current action for the model is considered to be: Hold – Maintain Short Position.
| NEW ZEALAND DOLLAR Statistics | SPECULATORS | COMMERCIALS | SMALL TRADERS |
| – Percent of Open Interest Longs: | 34.7 | 58.3 | 6.6 |
| – Percent of Open Interest Shorts: | 54.8 | 36.5 | 8.3 |
| – Net Position: | -11,200 | 12,162 | -962 |
| – Gross Longs: | 19,284 | 32,451 | 3,683 |
| – Gross Shorts: | 30,484 | 20,289 | 4,645 |
| – Long to Short Ratio: | 0.6 to 1 | 1.6 to 1 | 0.8 to 1 |
| NET POSITION TREND: | |||
| – Strength Index Score (3 Year Range Pct): | 28.6 | 70.3 | 41.8 |
| – Strength Index Reading (3 Year Range): | Bearish | Bullish | Bearish |
| NET POSITION MOVEMENT INDEX: | |||
| – 6-Week Change in Strength Index: | -10.4 | 3.6 | 28.4 |
Mexican Peso Futures:
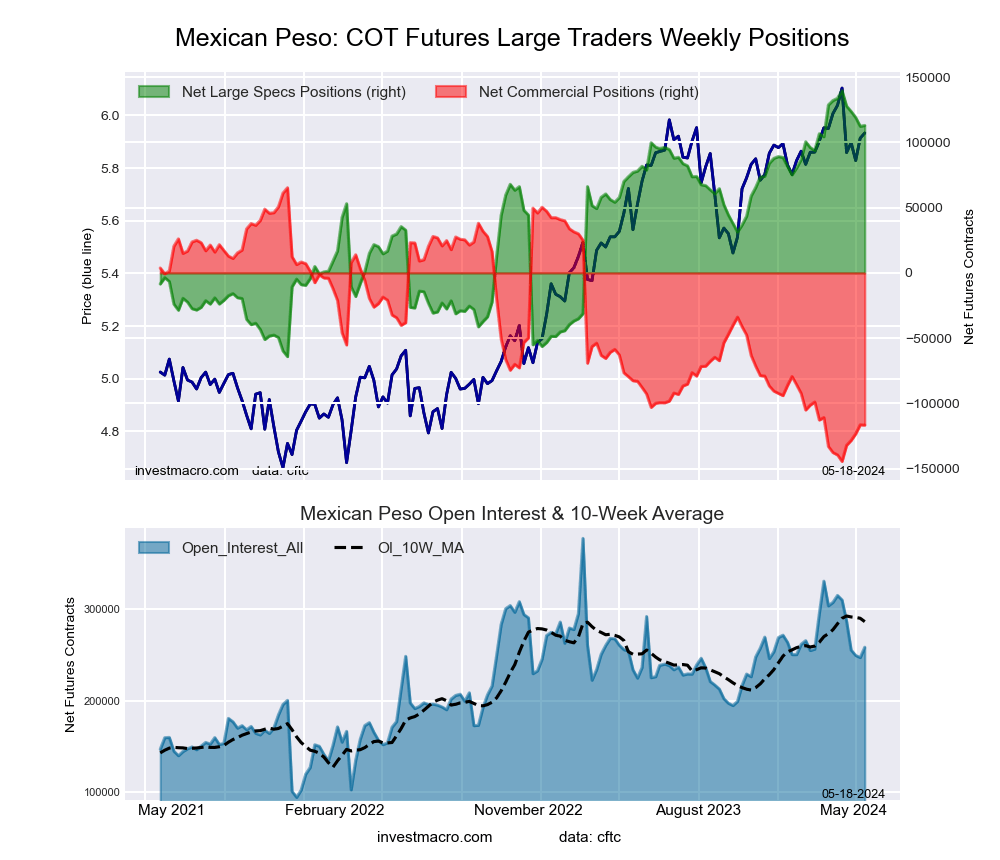 The Mexican Peso large speculator standing this week was a net position of 112,961 contracts in the data reported through Tuesday. This was a weekly advance of 649 contracts from the previous week which had a total of 112,312 net contracts.
This week’s current strength score (the trader positioning range over the past three years, measured from 0 to 100) shows the speculators are currently Bullish-Extreme with a score of 86.9 percent. The commercials are Bearish-Extreme with a score of 13.3 percent and the small traders (not shown in chart) are Bearish with a score of 34.4 percent.
Price Trend-Following Model: Strong Uptrend
Our weekly trend-following model classifies the current market price position as: Strong Uptrend. The current action for the model is considered to be: Hold – Maintain Long Position.
| MEXICAN PESO Statistics | SPECULATORS | COMMERCIALS | SMALL TRADERS |
| – Percent of Open Interest Longs: | 55.9 | 41.0 | 2.7 |
| – Percent of Open Interest Shorts: | 12.1 | 86.2 | 1.3 |
| – Net Position: | 112,961 | -116,601 | 3,640 |
| – Gross Longs: | 144,307 | 105,840 | 6,997 |
| – Gross Shorts: | 31,346 | 222,441 | 3,357 |
| – Long to Short Ratio: | 4.6 to 1 | 0.5 to 1 | 2.1 to 1 |
| NET POSITION TREND: | |||
| – Strength Index Score (3 Year Range Pct): | 86.9 | 13.3 | 34.4 |
| – Strength Index Reading (3 Year Range): | Bullish-Extreme | Bearish-Extreme | Bearish |
| NET POSITION MOVEMENT INDEX: | |||
| – 6-Week Change in Strength Index: | -10.2 | 10.9 | -13.2 |
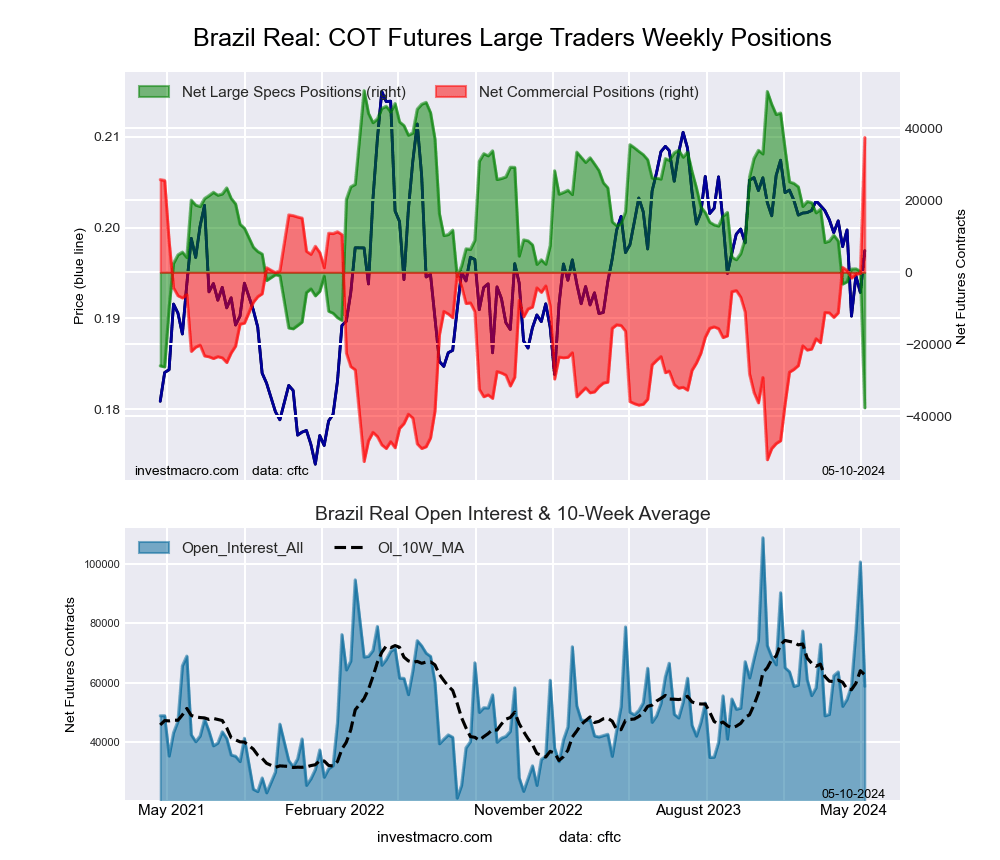
Brazilian Real Futures:
 The Brazilian Real large speculator standing this week was a net position of -38,259 contracts in the data reported through Tuesday. This was a weekly reduction of -616 contracts from the previous week which had a total of -37,643 net contracts.
This week’s current strength score (the trader positioning range over the past three years, measured from 0 to 100) shows the speculators are currently Bearish-Extreme with a score of 0.0 percent. The commercials are Bullish-Extreme with a score of 100.0 percent and the small traders (not shown in chart) are Bearish with a score of 34.5 percent.
Price Trend-Following Model: Downtrend
Our weekly trend-following model classifies the current market price position as: Downtrend. The current action for the model is considered to be: Hold – Maintain Short Position.
| BRAZIL REAL Statistics | SPECULATORS | COMMERCIALS | SMALL TRADERS |
| – Percent of Open Interest Longs: | 18.3 | 78.2 | 3.4 |
| – Percent of Open Interest Shorts: | 80.7 | 15.9 | 3.4 |
| – Net Position: | -38,259 | 38,249 | 10 |
| – Gross Longs: | 11,257 | 47,983 | 2,105 |
| – Gross Shorts: | 49,516 | 9,734 | 2,095 |
| – Long to Short Ratio: | 0.2 to 1 | 4.9 to 1 | 1.0 to 1 |
| NET POSITION TREND: | |||
| – Strength Index Score (3 Year Range Pct): | 0.0 | 100.0 | 34.5 |
| – Strength Index Reading (3 Year Range): | Bearish-Extreme | Bullish-Extreme | Bearish |
| NET POSITION MOVEMENT INDEX: | |||
| – 6-Week Change in Strength Index: | -39.4 | 40.6 | -17.6 |
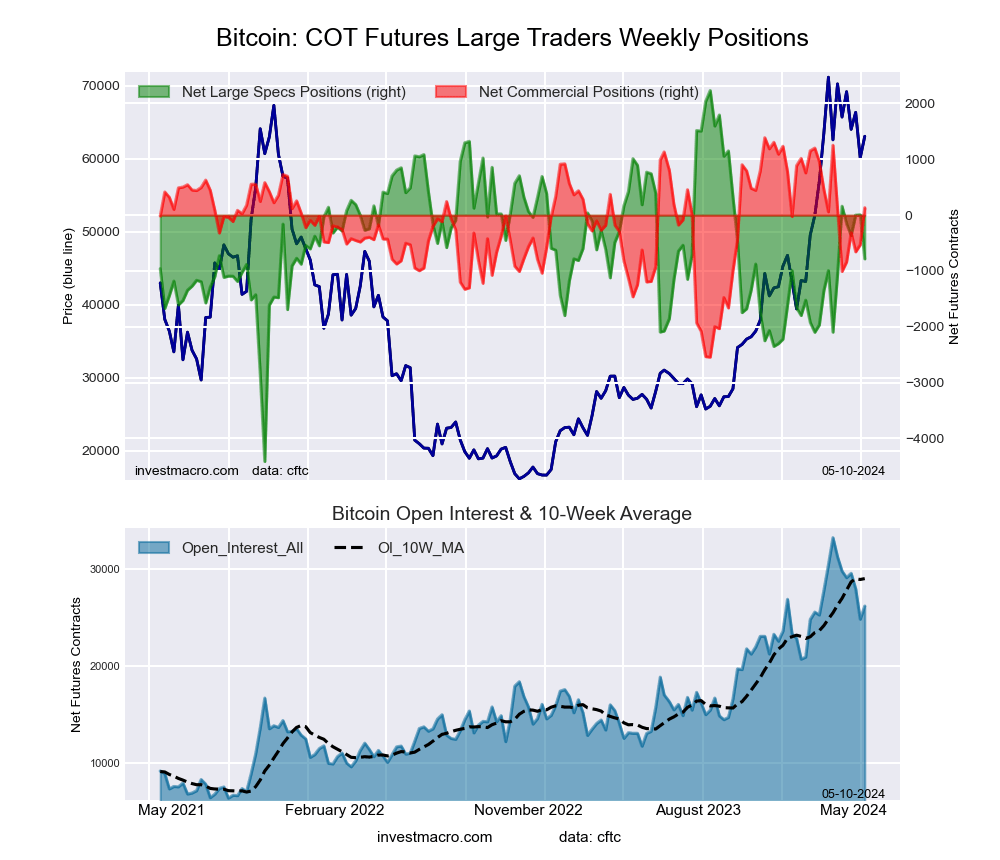
Bitcoin Futures:
 The Bitcoin large speculator standing this week was a net position of -177 contracts in the data reported through Tuesday. This was a weekly rise of 606 contracts from the previous week which had a total of -783 net contracts.
This week’s current strength score (the trader positioning range over the past three years, measured from 0 to 100) shows the speculators are currently Bullish with a score of 63.7 percent. The commercials are Bullish with a score of 54.0 percent and the small traders (not shown in chart) are Bearish with a score of 26.5 percent.
Price Trend-Following Model: Uptrend
Our weekly trend-following model classifies the current market price position as: Uptrend. The current action for the model is considered to be: Hold – Maintain Long Position.
| BITCOIN Statistics | SPECULATORS | COMMERCIALS | SMALL TRADERS |
| – Percent of Open Interest Longs: | 77.8 | 4.1 | 5.6 |
| – Percent of Open Interest Shorts: | 78.5 | 5.6 | 3.4 |
| – Net Position: | -177 | -421 | 598 |
| – Gross Longs: | 21,078 | 1,099 | 1,519 |
| – Gross Shorts: | 21,255 | 1,520 | 921 |
| – Long to Short Ratio: | 1.0 to 1 | 0.7 to 1 | 1.6 to 1 |
| NET POSITION TREND: | |||
| – Strength Index Score (3 Year Range Pct): | 63.7 | 54.0 | 26.5 |
| – Strength Index Reading (3 Year Range): | Bullish | Bullish | Bearish |
| NET POSITION MOVEMENT INDEX: | |||
| – 6-Week Change in Strength Index: | -5.1 | 14.9 | -5.7 |
Article By InvestMacro – Receive our weekly COT Newsletter
*COT Report: The COT data, released weekly to the public each Friday, is updated through the most recent Tuesday (data is 3 days old) and shows a quick view of how large speculators or non-commercials (for-profit traders) were positioned in the futures markets.
The CFTC categorizes trader positions according to commercial hedgers (traders who use futures contracts for hedging as part of the business), non-commercials (large traders who speculate to realize trading profits) and nonreportable traders (usually small traders/speculators) as well as their open interest (contracts open in the market at time of reporting). See CFTC criteria here.