By InvestMacro

Here are the latest charts and statistics for the Commitment of Traders (COT) data published by the Commodities Futures Trading Commission (CFTC).
The latest COT data is updated through Tuesday August 26th and shows a quick view of how large traders (for-profit speculators and commercial entities) were positioned in the futures markets.
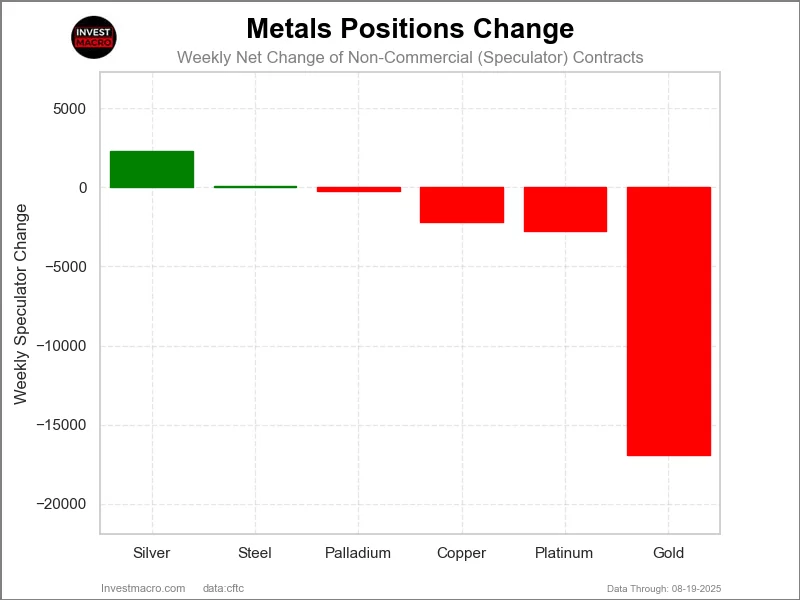
Weekly Speculator Changes led by Gold, Steel & Platinum
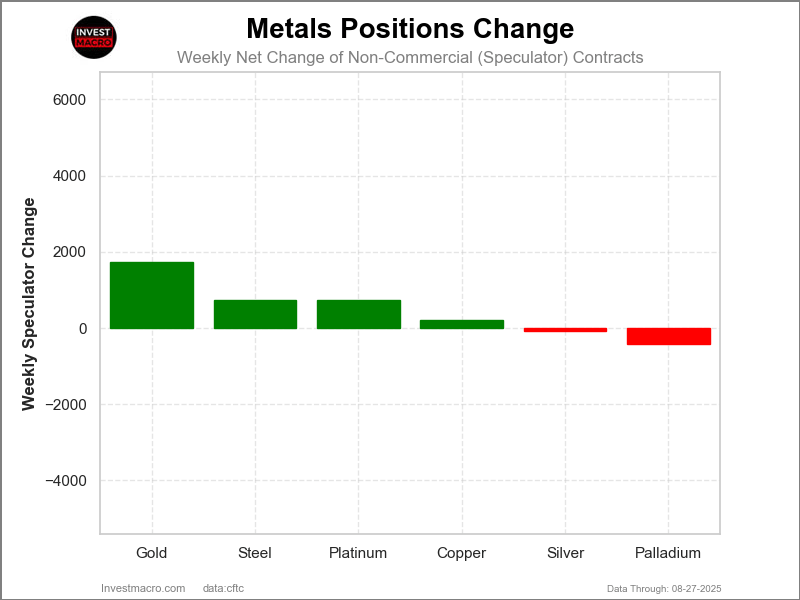
The COT metals markets speculator bets were overall higher this week as four out of the six metals markets we cover had higher positioning while the other two markets had lower speculator contracts.
Leading the gains for the metals was Gold (1,721 contracts), Steel (741 contracts), Platinum (736 contracts) and Copper (198 contracts) also showing positive weeks.
The markets with declines in speculator bets for the week were Palladium (-407 contracts) and Silver (-83 contracts) also registering lower bets on the week.
Metals Price Changes led by Gold & Silver
Metals markets price performance this week was led by Gold and Silver, which were higher by just about the same percent of 2.40%. Copper came in next with a 1.30% gain on the week while Platinum was higher by 1.14%.
Palladium was lower this week by -1.52%, followed by Steel, which saw the biggest loss on the week by -4.70%.
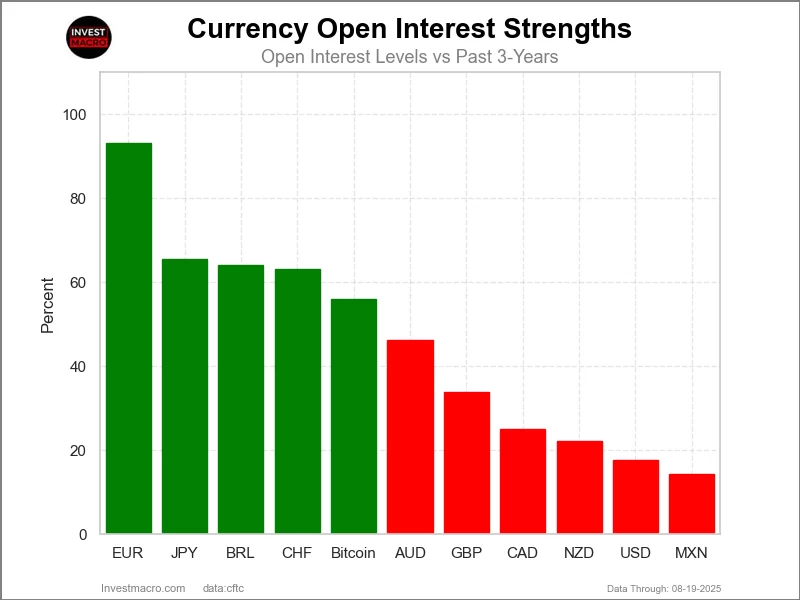
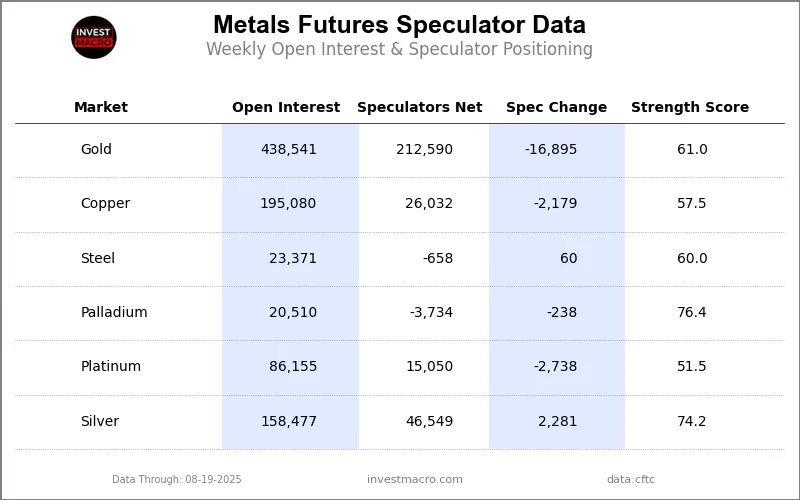
Strength Scores led by Silver & Palladium

COT Strength Scores (a normalized measure of Speculator positions over a 3-Year range, from 0 to 100 where above 80 is Extreme-Bullish and below 20 is Extreme-Bearish) showed that Silver (74 percent) and Palladium (73 percent) lead the metals markets this week. Gold (62 percent) comes in as the next highest in the weekly strength scores.
Strength Statistics:
Gold (61.6 percent) vs Gold previous week (61.0 percent)
Silver (74.1 percent) vs Silver previous week (74.2 percent)
Copper (57.7 percent) vs Copper previous week (57.5 percent)
Platinum (53.3 percent) vs Platinum previous week (51.5 percent)
Palladium (73.4 percent) vs Palladium previous week (76.4 percent)
Steel (61.1 percent) vs Palladium previous week (55.4 percent)
Gold & Steel top the 6-Week Strength Trends
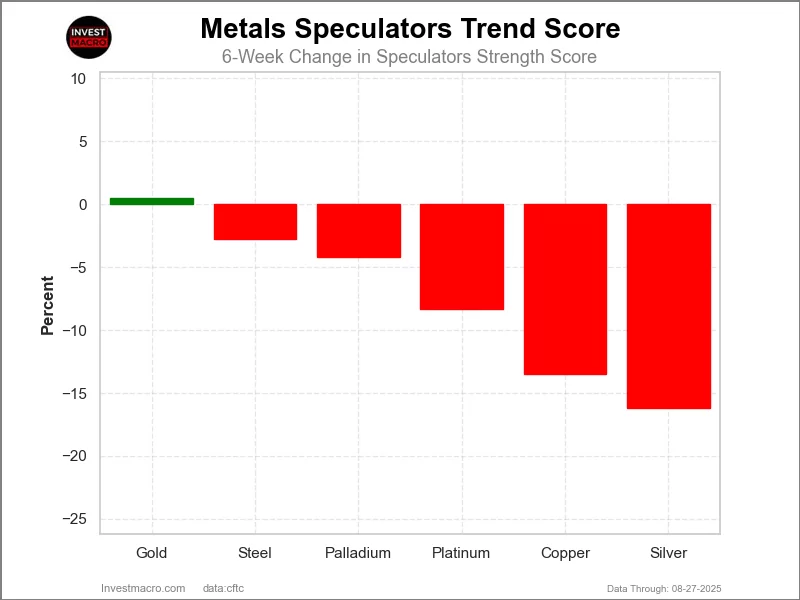
COT Strength Score Trends (or move index, calculates the 6-week changes in strength scores) showed that Gold (0.5 percent) leads the past six weeks trends for metals Gold was the only positive mover in the latest trends data and highlights the cool-off in sentiment for the metals market currently.
Silver (-16 percent), Copper (-13 percent) and Platinum (-8 percent) lead the downside trend scores currently.
Move Statistics:
Gold (0.5 percent) vs Gold previous week (3.7 percent)
Silver (-16.2 percent) vs Silver previous week (-15.0 percent)
Copper (-13.5 percent) vs Copper previous week (-12.6 percent)
Platinum (-8.3 percent) vs Platinum previous week (-13.5 percent)
Palladium (-4.2 percent) vs Palladium previous week (7.5 percent)
Steel (-2.8 percent) vs Steel previous week (-7.1 percent)
Individual Markets:
Gold Comex Futures:
 The Gold Comex Futures large speculator standing this week was a net position of 214,311 contracts in the data reported through Tuesday. This was a weekly increase of 1,721 contracts from the previous week which had a total of 212,590 net contracts.
This week’s current strength score (the trader positioning range over the past three years, measured from 0 to 100) shows the speculators are currently Bullish with a score of 61.6 percent. The commercials are Bearish with a score of 32.0 percent and the small traders (not shown in chart) are Bullish-Extreme with a score of 96.9 percent.
Price Trend-Following Model: Strong Uptrend
Our weekly trend-following model classifies the current market price position as: Strong Uptrend.
| Gold Futures Statistics | SPECULATORS | COMMERCIALS | SMALL TRADERS |
| – Percent of Open Interest Longs: | 62.1 | 16.4 | 12.8 |
| – Percent of Open Interest Shorts: | 13.8 | 73.0 | 4.5 |
| – Net Position: | 214,311 | -250,965 | 36,654 |
| – Gross Longs: | 275,767 | 72,908 | 56,712 |
| – Gross Shorts: | 61,456 | 323,873 | 20,058 |
| – Long to Short Ratio: | 4.5 to 1 | 0.2 to 1 | 2.8 to 1 |
| NET POSITION TREND: | |||
| – Strength Index Score (3 Year Range Pct): | 61.6 | 32.0 | 96.9 |
| – Strength Index Reading (3 Year Range): | Bullish | Bearish | Bullish-Extreme |
| NET POSITION MOVEMENT INDEX: | |||
| – 6-Week Change in Strength Index: | 0.5 | -0.1 | -3.1 |
Silver Comex Futures:
 The Silver Comex Futures large speculator standing this week was a net position of 46,466 contracts in the data reported through Tuesday. This was a weekly reduction of -83 contracts from the previous week which had a total of 46,549 net contracts.
This week’s current strength score (the trader positioning range over the past three years, measured from 0 to 100) shows the speculators are currently Bullish with a score of 74.1 percent. The commercials are Bearish-Extreme with a score of 19.4 percent and the small traders (not shown in chart) are Bullish with a score of 76.3 percent.
Price Trend-Following Model: Strong Uptrend
Our weekly trend-following model classifies the current market price position as: Strong Uptrend.
| Silver Futures Statistics | SPECULATORS | COMMERCIALS | SMALL TRADERS |
| – Percent of Open Interest Longs: | 43.0 | 29.1 | 20.6 |
| – Percent of Open Interest Shorts: | 13.7 | 72.1 | 6.8 |
| – Net Position: | 46,466 | -68,285 | 21,819 |
| – Gross Longs: | 68,227 | 46,134 | 32,659 |
| – Gross Shorts: | 21,761 | 114,419 | 10,840 |
| – Long to Short Ratio: | 3.1 to 1 | 0.4 to 1 | 3.0 to 1 |
| NET POSITION TREND: | |||
| – Strength Index Score (3 Year Range Pct): | 74.1 | 19.4 | 76.3 |
| – Strength Index Reading (3 Year Range): | Bullish | Bearish-Extreme | Bullish |
| NET POSITION MOVEMENT INDEX: | |||
| – 6-Week Change in Strength Index: | -16.2 | 12.5 | 7.9 |
Copper Grade #1 Futures:
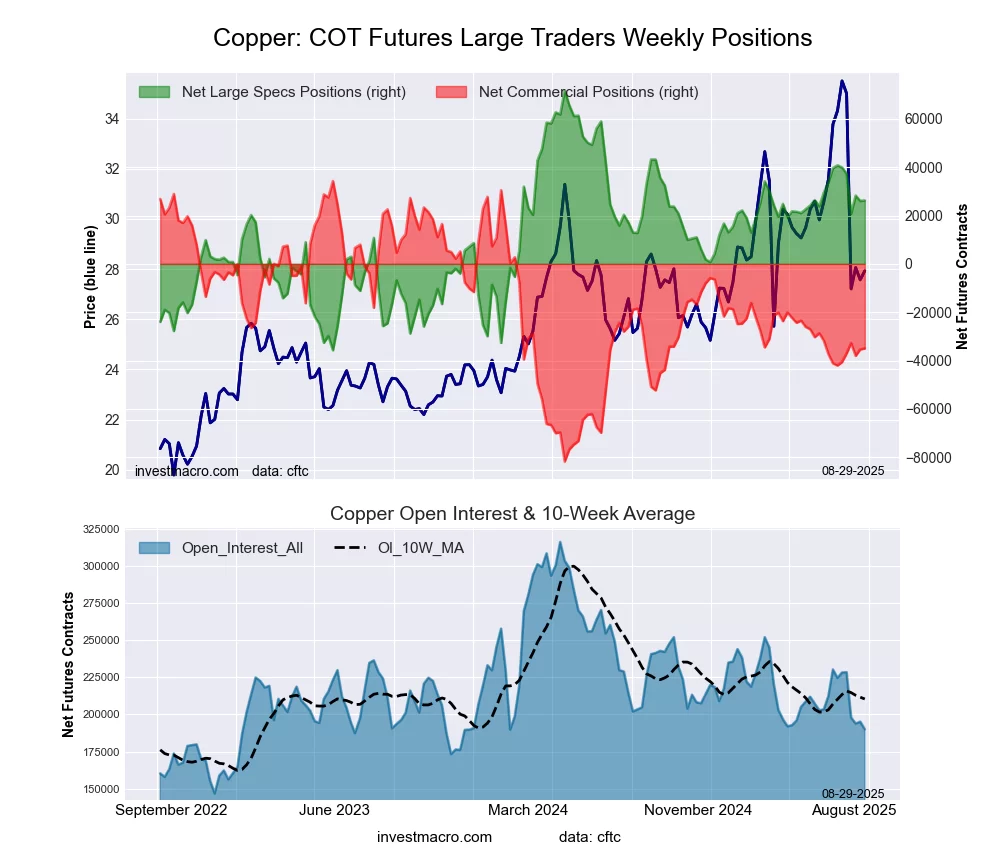 The Copper Grade #1 Futures large speculator standing this week was a net position of 26,230 contracts in the data reported through Tuesday. This was a weekly rise of 198 contracts from the previous week which had a total of 26,032 net contracts.
This week’s current strength score (the trader positioning range over the past three years, measured from 0 to 100) shows the speculators are currently Bullish with a score of 57.7 percent. The commercials are Bearish with a score of 40.3 percent and the small traders (not shown in chart) are Bullish with a score of 70.8 percent.
Price Trend-Following Model: Weak Uptrend
Our weekly trend-following model classifies the current market price position as: Weak Uptrend.
| Copper Futures Statistics | SPECULATORS | COMMERCIALS | SMALL TRADERS |
| – Percent of Open Interest Longs: | 29.9 | 34.8 | 9.2 |
| – Percent of Open Interest Shorts: | 16.1 | 53.3 | 4.6 |
| – Net Position: | 26,230 | -34,994 | 8,764 |
| – Gross Longs: | 56,762 | 66,222 | 17,555 |
| – Gross Shorts: | 30,532 | 101,216 | 8,791 |
| – Long to Short Ratio: | 1.9 to 1 | 0.7 to 1 | 2.0 to 1 |
| NET POSITION TREND: | |||
| – Strength Index Score (3 Year Range Pct): | 57.7 | 40.3 | 70.8 |
| – Strength Index Reading (3 Year Range): | Bullish | Bearish | Bullish |
| NET POSITION MOVEMENT INDEX: | |||
| – 6-Week Change in Strength Index: | -13.5 | 6.1 | 45.2 |
Platinum Futures:
 The Platinum Futures large speculator standing this week was a net position of 15,786 contracts in the data reported through Tuesday. This was a weekly gain of 736 contracts from the previous week which had a total of 15,050 net contracts.
This week’s current strength score (the trader positioning range over the past three years, measured from 0 to 100) shows the speculators are currently Bullish with a score of 53.3 percent. The commercials are Bearish with a score of 44.9 percent and the small traders (not shown in chart) are Bullish with a score of 63.7 percent.
Price Trend-Following Model: Uptrend
Our weekly trend-following model classifies the current market price position as: Uptrend.
| Platinum Futures Statistics | SPECULATORS | COMMERCIALS | SMALL TRADERS |
| – Percent of Open Interest Longs: | 57.6 | 19.3 | 11.7 |
| – Percent of Open Interest Shorts: | 39.2 | 44.4 | 5.0 |
| – Net Position: | 15,786 | -21,441 | 5,655 |
| – Gross Longs: | 49,314 | 16,518 | 9,976 |
| – Gross Shorts: | 33,528 | 37,959 | 4,321 |
| – Long to Short Ratio: | 1.5 to 1 | 0.4 to 1 | 2.3 to 1 |
| NET POSITION TREND: | |||
| – Strength Index Score (3 Year Range Pct): | 53.3 | 44.9 | 63.7 |
| – Strength Index Reading (3 Year Range): | Bullish | Bearish | Bullish |
| NET POSITION MOVEMENT INDEX: | |||
| – 6-Week Change in Strength Index: | -8.3 | 3.2 | 24.3 |
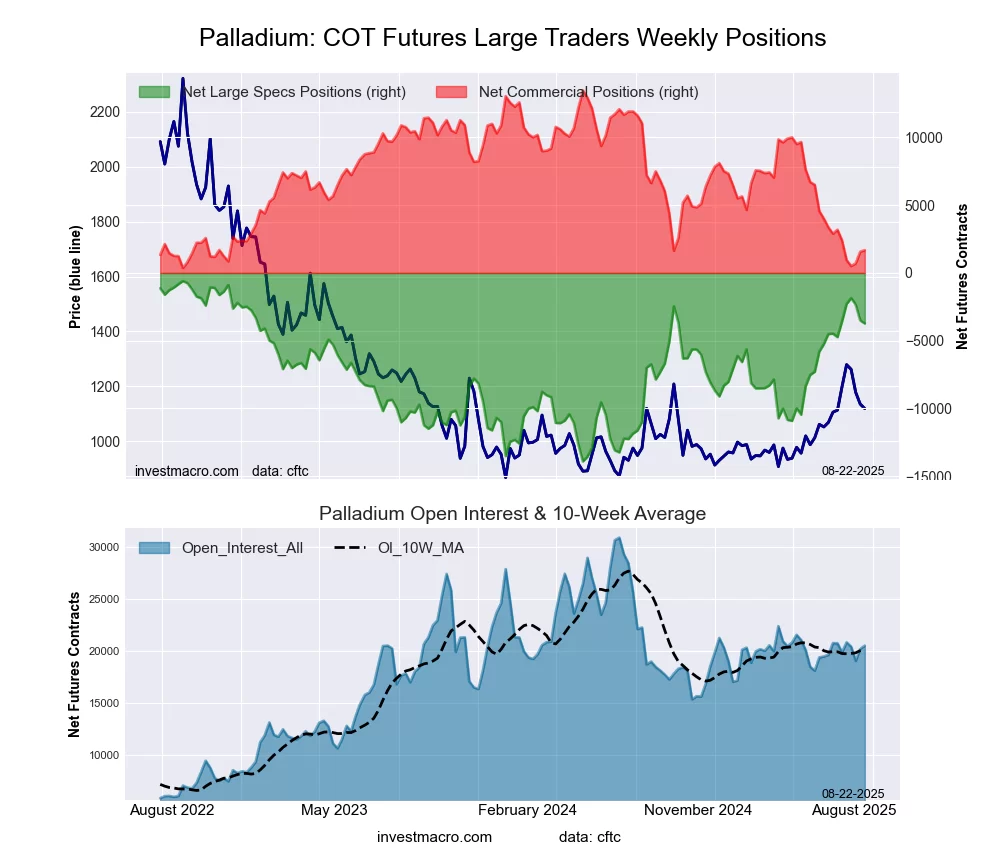
Palladium Futures:
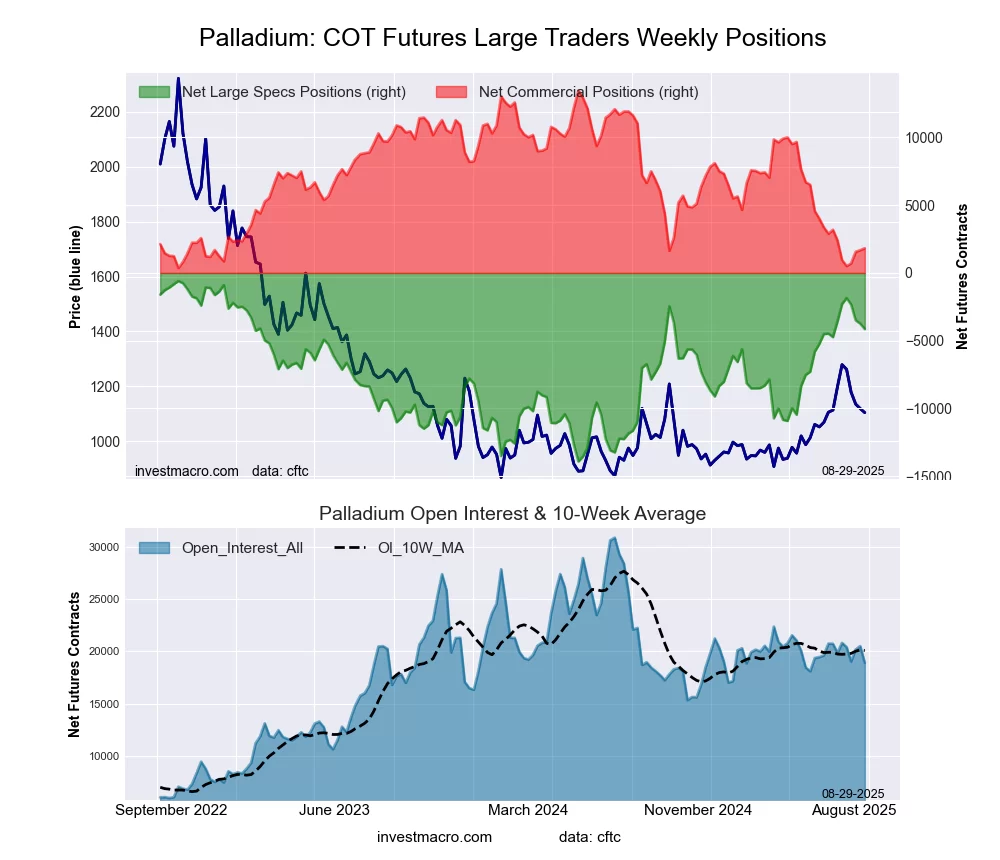 The Palladium Futures large speculator standing this week was a net position of -4,141 contracts in the data reported through Tuesday. This was a weekly decline of -407 contracts from the previous week which had a total of -3,734 net contracts.
This week’s current strength score (the trader positioning range over the past three years, measured from 0 to 100) shows the speculators are currently Bullish with a score of 73.4 percent. The commercials are Bearish-Extreme with a score of 11.1 percent and the small traders (not shown in chart) are Bullish-Extreme with a score of 100.0 percent.
Price Trend-Following Model: Uptrend
Our weekly trend-following model classifies the current market price position as: Uptrend.
| Palladium Futures Statistics | SPECULATORS | COMMERCIALS | SMALL TRADERS |
| – Percent of Open Interest Longs: | 39.3 | 34.6 | 18.5 |
| – Percent of Open Interest Shorts: | 61.2 | 25.0 | 6.3 |
| – Net Position: | -4,141 | 1,823 | 2,318 |
| – Gross Longs: | 7,433 | 6,552 | 3,505 |
| – Gross Shorts: | 11,574 | 4,729 | 1,187 |
| – Long to Short Ratio: | 0.6 to 1 | 1.4 to 1 | 3.0 to 1 |
| NET POSITION TREND: | |||
| – Strength Index Score (3 Year Range Pct): | 73.4 | 11.1 | 100.0 |
| – Strength Index Reading (3 Year Range): | Bullish | Bearish-Extreme | Bullish-Extreme |
| NET POSITION MOVEMENT INDEX: | |||
| – 6-Week Change in Strength Index: | -4.2 | -4.4 | 39.2 |
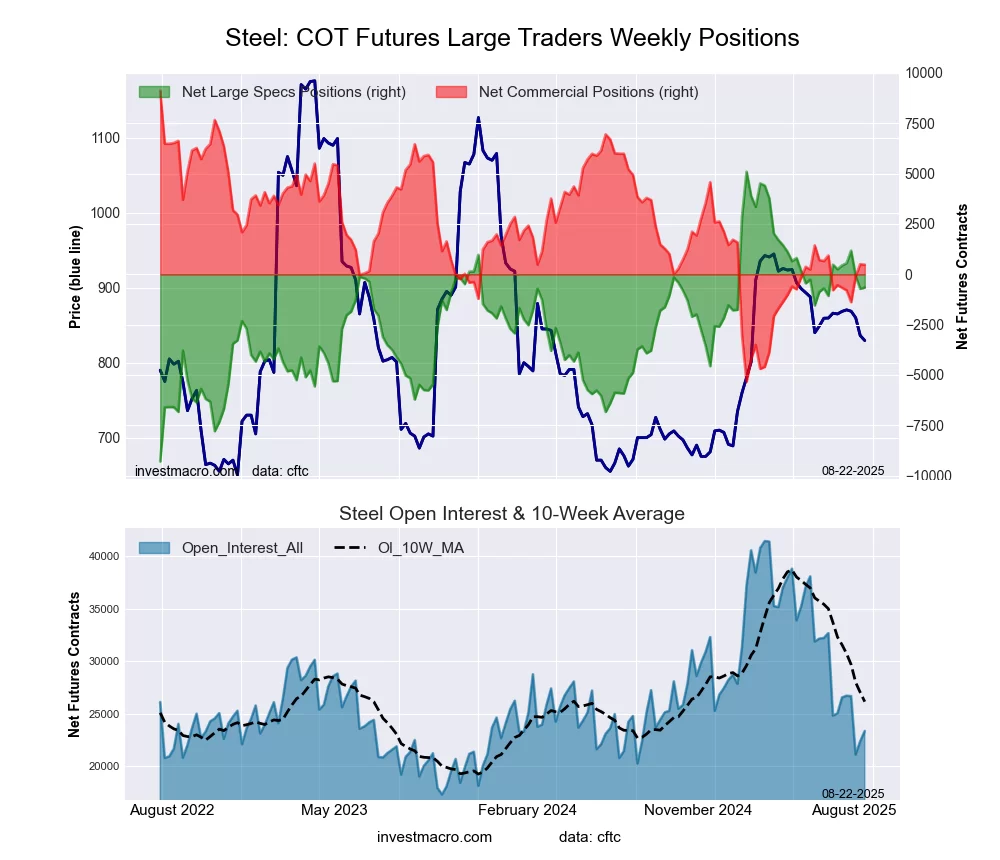
Steel Futures Futures:
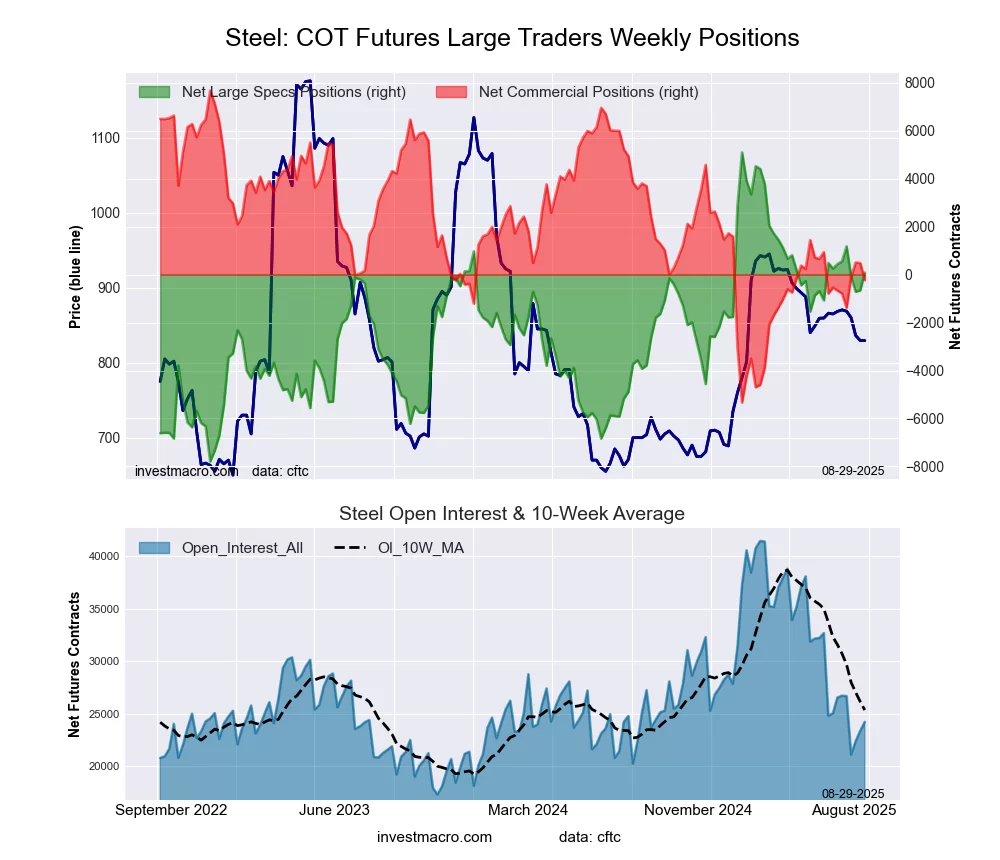 The Steel Futures large speculator standing this week was a net position of 83 contracts in the data reported through Tuesday. This was a weekly gain of 741 contracts from the previous week which had a total of -658 net contracts.
This week’s current strength score (the trader positioning range over the past three years, measured from 0 to 100) shows the speculators are currently Bullish with a score of 61.1 percent. The commercials are Bearish with a score of 39.2 percent and the small traders (not shown in chart) are Bullish with a score of 55.6 percent.
Price Trend-Following Model: Strong Downtrend
Our weekly trend-following model classifies the current market price position as: Strong Downtrend.
| Steel Futures Statistics | SPECULATORS | COMMERCIALS | SMALL TRADERS |
| – Percent of Open Interest Longs: | 18.7 | 76.3 | 1.8 |
| – Percent of Open Interest Shorts: | 18.4 | 77.3 | 1.2 |
| – Net Position: | 83 | -235 | 152 |
| – Gross Longs: | 4,544 | 18,488 | 431 |
| – Gross Shorts: | 4,461 | 18,723 | 279 |
| – Long to Short Ratio: | 1.0 to 1 | 1.0 to 1 | 1.5 to 1 |
| NET POSITION TREND: | |||
| – Strength Index Score (3 Year Range Pct): | 61.1 | 39.2 | 55.6 |
| – Strength Index Reading (3 Year Range): | Bullish | Bearish | Bullish |
| NET POSITION MOVEMENT INDEX: | |||
| – 6-Week Change in Strength Index: | -2.8 | 3.3 | -9.9 |
Article By InvestMacro – Receive our weekly COT Newsletter
*COT Report: The COT data, released weekly to the public each Friday, is updated through the most recent Tuesday (data is 3 days old) and shows a quick view of how large speculators or non-commercials (for-profit traders) were positioned in the futures markets.
The CFTC categorizes trader positions according to commercial hedgers (traders who use futures contracts for hedging as part of the business), non-commercials (large traders who speculate to realize trading profits) and nonreportable traders (usually small traders/speculators) as well as their open interest (contracts open in the market at time of reporting). See CFTC criteria here.